This is the multi-page printable view of this section. Click here to print.
Debugging and Troubleshooting
- 1: Common issues when running Dapr
- 2: Configure and view Dapr Logs
- 3: Dapr API Logs
- 4: Profiling & Debugging
1 - Common issues when running Dapr
This guide covers common issues you may encounter while installing and running Dapr.
Dapr can’t connect to Docker when installing the Dapr CLI
When installing and initializing the Dapr CLI, if you see the following error message after running dapr init:
⌛  Making the jump to hyperspace...
❌  could not connect to docker. docker may not be installed or running
Troubleshoot the error by ensuring:
-
In Docker Desktop, verify the Allow the default Docker socket to be used (requires password) option is selected.
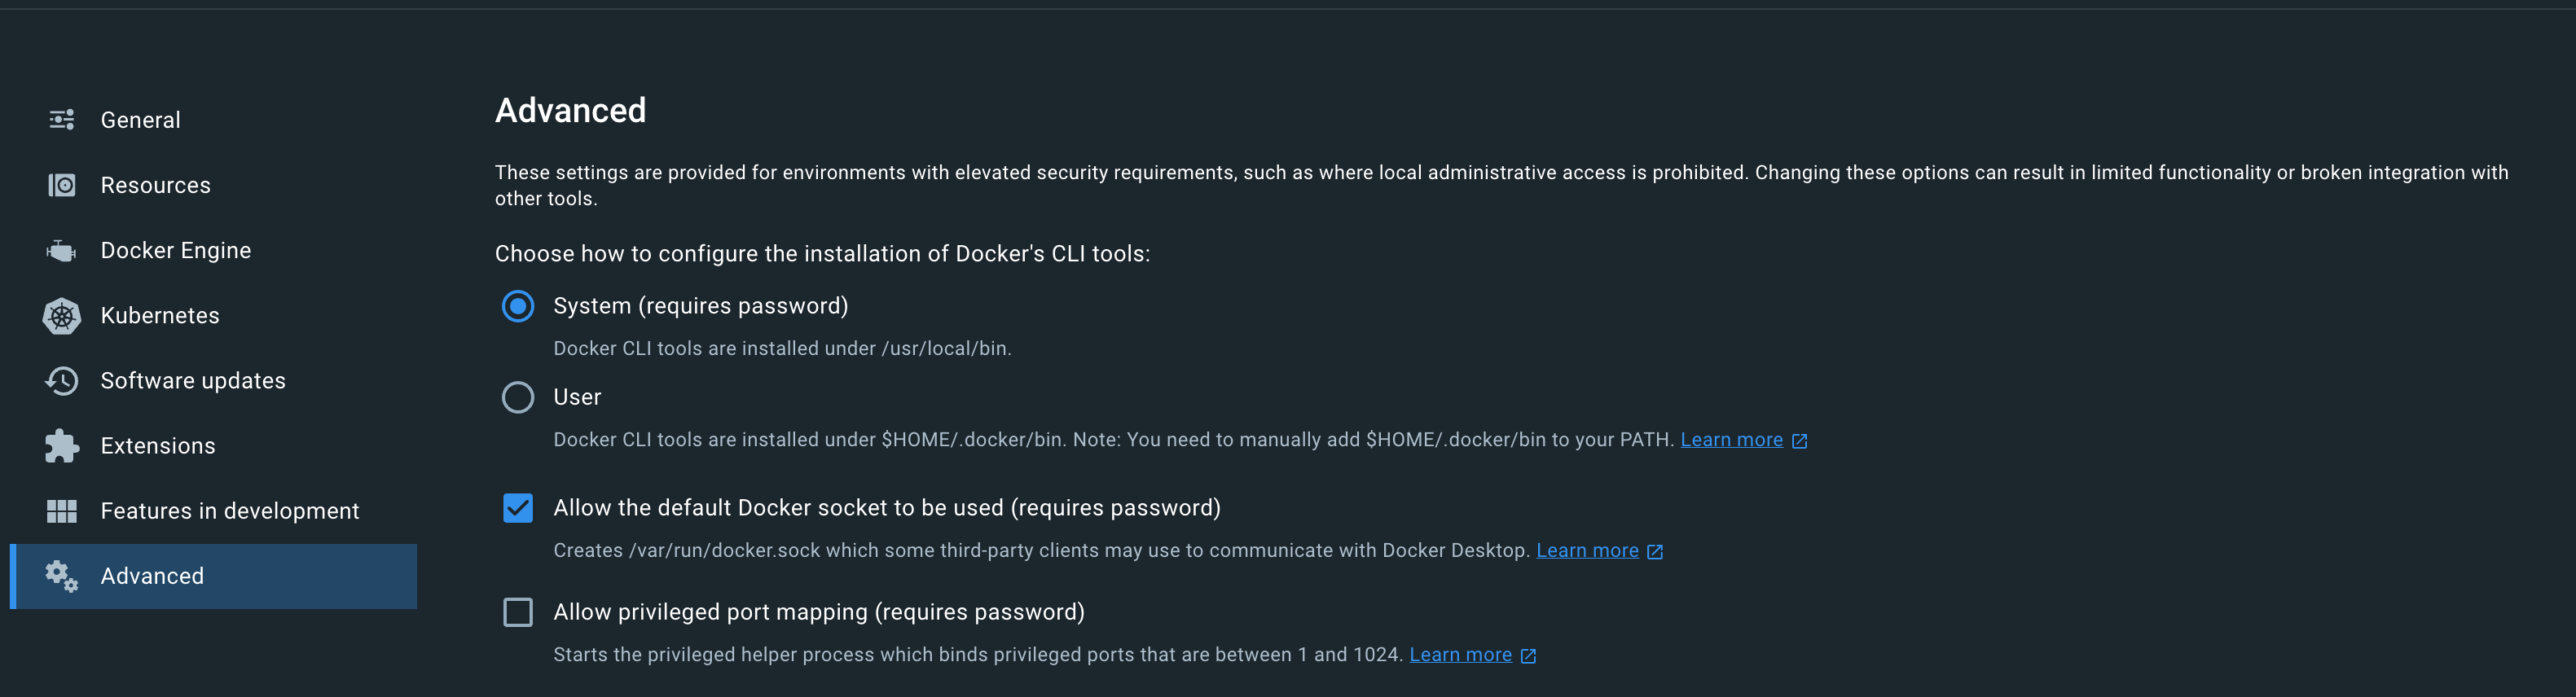
I don’t see the Dapr sidecar injected to my pod
There could be several reasons to why a sidecar will not be injected into a pod. First, check your deployment or pod YAML file, and check that you have the following annotations in the right place:
annotations:
  dapr.io/enabled: "true"
  dapr.io/app-id: "nodeapp"
  dapr.io/app-port: "3000"
Sample deployment:
apiVersion: apps/v1
kind: Deployment
metadata:
  name: nodeapp
  namespace: default
  labels:
    app: node
spec:
  replicas: 1
  selector:
    matchLabels:
      app: node
  template:
    metadata:
      labels:
        app: node
      annotations:
        dapr.io/enabled: "true"
        dapr.io/app-id: "nodeapp"
        dapr.io/app-port: "3000"
    spec:
      containers:
      - name: node
        image: dapriosamples/hello-k8s-node
        ports:
        - containerPort: 3000
        imagePullPolicy: Always
There are some known cases where this might not properly work:
-
If your pod spec template is annotated correctly, and you still don’t see the sidecar injected, make sure Dapr was deployed to the cluster before your deployment or pod were deployed.
If this is the case, restarting the pods will fix the issue.
-
If you are deploying Dapr on a private GKE cluster, sidecar injection does not work without extra steps. See Setup a Google Kubernetes Engine cluster.
In order to further diagnose any issue, check the logs of the Dapr sidecar injector:
kubectl logs -l app=dapr-sidecar-injector -n dapr-systemNote: If you installed Dapr to a different namespace, replace dapr-system above with the desired namespace
-
If you are deploying Dapr on Amazon EKS and using an overlay network such as Calico, you will need to set
hostNetworkparameter to true, this is a limitation of EKS with such CNIs.You can set this parameter using Helm
values.yamlfile:helm upgrade --install dapr dapr/dapr \ --namespace dapr-system \ --create-namespace \ --values values.yamlvalues.yamldapr_sidecar_injector: hostNetwork: trueor using command line:
helm upgrade --install dapr dapr/dapr \ --namespace dapr-system \ --create-namespace \ --set dapr_sidecar_injector.hostNetwork=true -
Make sure the kube api server can reach the following webhooks services:
- Sidecar Mutating Webhook Injector Service at port 4000 that is served from the sidecar injector.
- Resource Conversion Webhook Service at port 19443 that is served from the operator.
Check with your cluster administrators to setup allow ingress rules to the above ports, 4000 and 19443, in the cluster from the kube api servers.
My pod is in CrashLoopBackoff or another failed state due to the daprd sidecar
If the Dapr sidecar (daprd) is taking too long to initialize, this might be surfaced as a failing health check by Kubernetes.
If your pod is in a failed state you should check this:
kubectl describe pod <name-of-pod>
You might see a table like the following at the end of the command output:
  Normal   Created    7m41s (x2 over 8m2s)   kubelet, aks-agentpool-12499885-vmss000000  Created container daprd
  Normal   Started    7m41s (x2 over 8m2s)   kubelet, aks-agentpool-12499885-vmss000000  Started container daprd
  Warning  Unhealthy  7m28s (x5 over 7m58s)  kubelet, aks-agentpool-12499885-vmss000000  Readiness probe failed: Get http://10.244.1.10:3500/v1.0/healthz: dial tcp 10.244.1.10:3500: connect: connection refused
  Warning  Unhealthy  7m25s (x6 over 7m55s)  kubelet, aks-agentpool-12499885-vmss000000  Liveness probe failed: Get http://10.244.1.10:3500/v1.0/healthz: dial tcp 10.244.1.10:3500: connect: connection refused
  Normal   Killing    7m25s (x2 over 7m43s)  kubelet, aks-agentpool-12499885-vmss000000  Container daprd failed liveness probe, will be restarted
  Warning  BackOff    3m2s (x18 over 6m48s)  kubelet, aks-agentpool-12499885-vmss000000  Back-off restarting failed container
The message Container daprd failed liveness probe, will be restarted indicates at the Dapr sidecar has failed its health checks and will be restarted. The messages Readiness probe failed: Get http://10.244.1.10:3500/v1.0/healthz: dial tcp 10.244.1.10:3500: connect: connection refused and Liveness probe failed: Get http://10.244.1.10:3500/v1.0/healthz: dial tcp 10.244.1.10:3500: connect: connection refused show that the health check failed because no connection could be made to the sidecar.
The most common cause of this failure is that a component (such as a state store) is misconfigured and is causing initialization to take too long. When initialization takes a long time, it’s possible that the health check could terminate the sidecar before anything useful is logged by the sidecar.
To diagnose the root cause:
- Significantly increase the liveness probe delay - link
- Set the log level of the sidecar to debug - link
- Watch the logs for meaningful information - link
Remember to configure the liveness check delay and log level back to your desired values after solving the problem.
I am unable to save state or get state
Have you installed an Dapr State store in your cluster?
To check, use kubectl get a list of components:
kubectl get components
If there isn’t a state store component, it means you need to set one up. Visit here for more details.
If everything’s set up correctly, make sure you got the credentials right. Search the Dapr runtime logs and look for any state store errors:
kubectl logs <name-of-pod> daprd
I am unable to publish and receive events
Have you installed an Dapr Message Bus in your cluster?
To check, use kubectl get a list of components:
kubectl get components
If there isn’t a pub/sub component, it means you need to set one up. Visit here for more details.
If everything is set up correctly, make sure you got the credentials right. Search the Dapr runtime logs and look for any pub/sub errors:
kubectl logs <name-of-pod> daprd
I’m getting 500 Error responses when calling Dapr
This means there are some internal issue inside the Dapr runtime. To diagnose, view the logs of the sidecar:
kubectl logs <name-of-pod> daprd
I’m getting 404 Not Found responses when calling Dapr
This means you’re trying to call an Dapr API endpoint that either doesn’t exist or the URL is malformed. Look at the Dapr API reference here and make sure you’re calling the right endpoint.
I don’t see any incoming events or calls from other services
Have you specified the port your app is listening on?
In Kubernetes, make sure the dapr.io/app-port annotation is specified:
annotations:
  dapr.io/enabled: "true"
  dapr.io/app-id: "nodeapp"
  dapr.io/app-port: "3000"
If using Dapr Standalone and the Dapr CLI, make sure you pass the --app-port flag to the dapr run command.
My Dapr-enabled app isn’t behaving correctly
The first thing to do is inspect the HTTP error code returned from the Dapr API, if any.
If you still can’t find the issue, try enabling debug log levels for the Dapr runtime. See here how to do so.
You might also want to look at error logs from your own process. If running on Kubernetes, find the pod containing your app, and execute the following:
kubectl logs <pod-name> <name-of-your-container>
If running in Standalone mode, you should see the stderr and stdout outputs from your app displayed in the main console session.
I’m getting timeout/connection errors when running Actors locally
Each Dapr instance reports it’s host address to the placement service. The placement service then distributes a table of nodes and their addresses to all Dapr instances. If that host address is unreachable, you are likely to encounter socket timeout errors or other variants of failing request errors.
Unless the host name has been specified by setting an environment variable named DAPR_HOST_IP to a reachable, pingable address, Dapr will loop over the network interfaces and select the first non-loopback address it finds.
As described above, in order to tell Dapr what the host name should be used, simply set an environment variable with the name of DAPR_HOST_IP.
The following example shows how to set the Host IP env var to 127.0.0.1:
Note: for versions <= 0.4.0 use HOST_IP
export DAPR_HOST_IP=127.0.0.1
None of my components are getting loaded when my application starts. I keep getting “Error component X cannot be found”
This is usually due to one of the following issues
- You may have defined the
NAMESPACEenvironment variable locally or deployed your components into a different namespace in Kubernetes. Check which namespace your app and the components are deployed to. Read scoping components to one or more applications for more information. - You may have not provided a
--resources-pathwith the Daprruncommands or not placed your components into the default components folder for your OS. Read define a component for more information. - You may have a syntax issue in component YAML file. Check your component YAML with the component YAML samples.
Service invocation is failing and my Dapr service is missing an appId (macOS)
Some organizations will implement software that filters out all UDP traffic, which is what mDNS is based on. Mostly commonly, on MacOS, Microsoft Content Filter is the culprit.
In order for mDNS to function properly, ensure Microsoft Content Filter is inactive.
- Open a terminal shell.
- Type
mdatp system-extension network-filter disableand hit enter. - Enter your account password.
Microsoft Content Filter is disabled when the output is “Success”.
Some organizations will re-enable the filter from time to time. If you repeatedly encounter app-id values missing, first check to see if the filter has been re-enabled before doing more extensive troubleshooting.
Admission webhook denied the request
You may encounter an error similar to the one below due to admission webhook having an allowlist for service accounts to create or modify resources.
root:[dapr]$ kubectl run -i --tty --rm debug --image=busybox --restart=Never -- sh
Error from server: admission webhook "sidecar-injector.dapr.io" denied the request: service account 'user-xdd5l' not on the list of allowed controller accounts
To resolve this error, you should create a clusterrolebind for the current user:
kubectl create clusterrolebinding dapr-<name-of-user> --clusterrole=dapr-operator-admin --user <name-of-user>
You can run the below command to get all users in your cluster:
kubectl config get-users
You may learn more about webhooks here.
Ports not available during dapr init
You might encounter the following error on Windows after attempting to execute dapr init:
PS C:\Users\You> dapr init Making the jump to hyperspace… Container images will be pulled from Docker Hub Installing runtime version 1.14.4 Downloading binaries and setting up components… docker: Error response from daemon: Ports are not available: exposing port TCP 0.0.0.0:52379 -> 0.0.0.0:0: listen tcp4 0.0.0.0:52379: bind: An attempt was made to access a socket in a way forbidden by its access permissions.
To resolve this error, open a command prompt in an elevated terminal and run:
nat stop winnat
dapr init
net start winnat
2 - Configure and view Dapr Logs
This section will assist you in understanding how logging works in Dapr, configuring and viewing logs.
Overview
Logs have different, configurable verbosity levels. The levels outlined below are the same for both system components and the Dapr sidecar process/container:
- error
- warn
- info
- debug
error produces the minimum amount of output, where debug produces the maximum amount. The default level is info, which provides a balanced amount of information for operating Dapr in normal conditions.
To set the output level, you can use the --log-level command-line option. For example:
./daprd --log-level error
./placement --log-level debug
This will start the Dapr runtime binary with a log level of error and the Dapr Actor Placement Service with a log level of debug.
Logs in stand-alone mode
To set the log level when running your app with the Dapr CLI, pass the log-level param:
dapr run --log-level warn node myapp.js
As outlined above, every Dapr binary takes a --log-level argument. For example, to launch the placement service with a log level of warning:
./placement --log-level warn
Viewing Logs on Standalone Mode
When running Dapr with the Dapr CLI, both your app’s log output and the runtime’s output will be redirected to the same session, for easy debugging. For example, this is the output when running Dapr:
dapr run node myapp.js
ℹ️  Starting Dapr with id Trackgreat-Lancer on port 56730
✅  You are up and running! Both Dapr and your app logs will appear here.

== APP == App listening on port 3000!
== DAPR == time="2019-09-05T12:26:43-07:00" level=info msg="starting Dapr Runtime -- version 0.3.0-alpha -- commit b6f2810-dirty"
== DAPR == time="2019-09-05T12:26:43-07:00" level=info msg="log level set to: info"
== DAPR == time="2019-09-05T12:26:43-07:00" level=info msg="standalone mode configured"
== DAPR == time="2019-09-05T12:26:43-07:00" level=info msg="app id: Trackgreat-Lancer"
== DAPR == time="2019-09-05T12:26:43-07:00" level=info msg="loaded component statestore (state.redis)"
== DAPR == time="2019-09-05T12:26:43-07:00" level=info msg="loaded component messagebus (pubsub.redis)"
== DAPR == 2019/09/05 12:26:43 redis: connecting to localhost:6379
== DAPR == 2019/09/05 12:26:43 redis: connected to localhost:6379 (localAddr: [::1]:56734, remAddr: [::1]:6379)
== DAPR == time="2019-09-05T12:26:43-07:00" level=warn msg="failed to init input bindings: app channel not initialized"
== DAPR == time="2019-09-05T12:26:43-07:00" level=info msg="actor runtime started. actor idle timeout: 1h0m0s. actor scan interval: 30s"
== DAPR == time="2019-09-05T12:26:43-07:00" level=info msg="actors: starting connection attempt to placement service at localhost:50005"
== DAPR == time="2019-09-05T12:26:43-07:00" level=info msg="http server is running on port 56730"
== DAPR == time="2019-09-05T12:26:43-07:00" level=info msg="gRPC server is running on port 56731"
== DAPR == time="2019-09-05T12:26:43-07:00" level=info msg="dapr initialized. Status: Running. Init Elapsed 8.772922000000001ms"
== DAPR == time="2019-09-05T12:26:43-07:00" level=info msg="actors: established connection to placement service at localhost:50005"
Logs in Kubernetes mode
You can set the log level individually for every sidecar by providing the following annotation in your pod spec template:
annotations:
  dapr.io/log-level: "debug"
Setting system pods log level
When deploying Dapr to your cluster using Helm 3.x, you can individually set the log level for every Dapr system component:
helm install dapr dapr/dapr --namespace dapr-system --set <COMPONENT>.logLevel=<LEVEL>
Components:
- dapr_operator
- dapr_placement
- dapr_sidecar_injector
Example:
helm install dapr dapr/dapr --namespace dapr-system --set dapr_operator.logLevel=error
Viewing Logs on Kubernetes
Dapr logs are written to stdout and stderr. This section will guide you on how to view logs for Dapr system components as well as the Dapr sidecar.
Sidecar Logs
When deployed in Kubernetes, the Dapr sidecar injector will inject a Dapr container named daprd into your annotated pod.
In order to view logs for the sidecar, simply find the pod in question by running kubectl get pods:
NAME                                        READY     STATUS    RESTARTS   AGE
addapp-74b57fb78c-67zm6                     2/2       Running   0          40h
Next, get the logs for the Dapr sidecar container:
kubectl logs addapp-74b57fb78c-67zm6 -c daprd

time="2019-09-04T02:52:27Z" level=info msg="starting Dapr Runtime -- version 0.3.0-alpha -- commit b6f2810-dirty"
time="2019-09-04T02:52:27Z" level=info msg="log level set to: info"
time="2019-09-04T02:52:27Z" level=info msg="kubernetes mode configured"
time="2019-09-04T02:52:27Z" level=info msg="app id: addapp"
time="2019-09-04T02:52:27Z" level=info msg="application protocol: http. waiting on port 6000"
time="2019-09-04T02:52:27Z" level=info msg="application discovered on port 6000"
time="2019-09-04T02:52:27Z" level=info msg="actor runtime started. actor idle timeout: 1h0m0s. actor scan interval: 30s"
time="2019-09-04T02:52:27Z" level=info msg="actors: starting connection attempt to placement service at dapr-placement.dapr-system.svc.cluster.local:80"
time="2019-09-04T02:52:27Z" level=info msg="http server is running on port 3500"
time="2019-09-04T02:52:27Z" level=info msg="gRPC server is running on port 50001"
time="2019-09-04T02:52:27Z" level=info msg="dapr initialized. Status: Running. Init Elapsed 64.234049ms"
time="2019-09-04T02:52:27Z" level=info msg="actors: established connection to placement service at dapr-placement.dapr-system.svc.cluster.local:80"
System Logs
Dapr runs the following system pods:
- Dapr operator
- Dapr sidecar injector
- Dapr placement service
Operator Logs
kubectl logs -l app=dapr-operator -n dapr-system

I1207 06:01:02.891031 1 leaderelection.go:243] attempting to acquire leader lease dapr-system/operator.dapr.io...
I1207 06:01:02.913696 1 leaderelection.go:253] successfully acquired lease dapr-system/operator.dapr.io
time="2021-12-07T06:01:03.092529085Z" level=info msg="getting tls certificates" instance=dapr-operator-84bb47f895-dvbsj scope=dapr.operator type=log ver=unknown
time="2021-12-07T06:01:03.092703283Z" level=info msg="tls certificates loaded successfully" instance=dapr-operator-84bb47f895-dvbsj scope=dapr.operator type=log ver=unknown
time="2021-12-07T06:01:03.093062379Z" level=info msg="starting gRPC server" instance=dapr-operator-84bb47f895-dvbsj scope=dapr.operator.api type=log ver=unknown
time="2021-12-07T06:01:03.093123778Z" level=info msg="Healthz server is listening on :8080" instance=dapr-operator-84bb47f895-dvbsj scope=dapr.operator type=log ver=unknown
time="2021-12-07T06:01:03.497889776Z" level=info msg="starting webhooks" instance=dapr-operator-84bb47f895-dvbsj scope=dapr.operator type=log ver=unknown
I1207 06:01:03.497944 1 leaderelection.go:243] attempting to acquire leader lease dapr-system/webhooks.dapr.io...
I1207 06:01:03.516641 1 leaderelection.go:253] successfully acquired lease dapr-system/webhooks.dapr.io
time="2021-12-07T06:01:03.526202227Z" level=info msg="Successfully patched webhook in CRD "subscriptions.dapr.io"" instance=dapr-operator-84bb47f895-dvbsj scope=dapr.operator type=log ver=unknown
Note: If Dapr is installed to a different namespace than dapr-system, simply replace the namespace to the desired one in the command above
Sidecar Injector Logs
kubectl logs -l app=dapr-sidecar-injector -n dapr-system

time="2021-12-07T06:01:01.554859058Z" level=info msg="log level set to: info" instance=dapr-sidecar-injector-5d88fcfcf5-2gmvv scope=dapr.injector type=log ver=unknown
time="2021-12-07T06:01:01.555114755Z" level=info msg="metrics server started on :9090/" instance=dapr-sidecar-injector-5d88fcfcf5-2gmvv scope=dapr.metrics type=log ver=unknown
time="2021-12-07T06:01:01.555233253Z" level=info msg="starting Dapr Sidecar Injector -- version 1.5.1 -- commit c6daae8e9b11b3e241a9cb84c33e5aa740d74368" instance=dapr-sidecar-injector-5d88fcfcf5-2gmvv scope=dapr.injector type=log ver=unknown
time="2021-12-07T06:01:01.557646524Z" level=info msg="Healthz server is listening on :8080" instance=dapr-sidecar-injector-5d88fcfcf5-2gmvv scope=dapr.injector type=log ver=unknown
time="2021-12-07T06:01:01.621291968Z" level=info msg="Sidecar injector is listening on :4000, patching Dapr-enabled pods" instance=dapr-sidecar-injector-5d88fcfcf5-2gmvv scope=dapr.injector type=log ver=unknown
Note: If Dapr is installed to a different namespace than dapr-system, simply replace the namespace to the desired one in the command above
Viewing Placement Service Logs
kubectl logs -l app=dapr-placement-server -n dapr-system

time="2021-12-04T05:08:05.733416791Z" level=info msg="starting Dapr Placement Service -- version 1.5.0 -- commit 83fe579f5dc93bef1ce3b464d3167a225a3aff3a" instance=dapr-placement-server-0 scope=dapr.placement type=log ver=unknown
time="2021-12-04T05:08:05.733469491Z" level=info msg="log level set to: info" instance=dapr-placement-server-0 scope=dapr.placement type=log ver=1.5.0
time="2021-12-04T05:08:05.733512692Z" level=info msg="metrics server started on :9090/" instance=dapr-placement-server-0 scope=dapr.metrics type=log ver=1.5.0
time="2021-12-04T05:08:05.735207095Z" level=info msg="Raft server is starting on 127.0.0.1:8201..." instance=dapr-placement-server-0 scope=dapr.placement.raft type=log ver=1.5.0
time="2021-12-04T05:08:05.735221195Z" level=info msg="mTLS enabled, getting tls certificates" instance=dapr-placement-server-0 scope=dapr.placement type=log ver=1.5.0
time="2021-12-04T05:08:05.735265696Z" level=info msg="tls certificates loaded successfully" instance=dapr-placement-server-0 scope=dapr.placement type=log ver=1.5.0
time="2021-12-04T05:08:05.735276396Z" level=info msg="placement service started on port 50005" instance=dapr-placement-server-0 scope=dapr.placement type=log ver=1.5.0
time="2021-12-04T05:08:05.735553696Z" level=info msg="Healthz server is listening on :8080" instance=dapr-placement-server-0 scope=dapr.placement type=log ver=1.5.0
time="2021-12-04T05:08:07.036850257Z" level=info msg="cluster leadership acquired" instance=dapr-placement-server-0 scope=dapr.placement type=log ver=1.5.0
time="2021-12-04T05:08:07.036909357Z" level=info msg="leader is established." instance=dapr-placement-server-0 scope=dapr.placement type=log ver=1.5.0
Note: If Dapr is installed to a different namespace than dapr-system, simply replace the namespace to the desired one in the command above
Non Kubernetes Environments
The examples above are specific specific to Kubernetes, but the principal is the same for any kind of container based environment: simply grab the container ID of the Dapr sidecar and/or system component (if applicable) and view its logs.
References
3 - Dapr API Logs
API logging enables you to see the API calls your application makes to the Dapr sidecar. This is useful to monitor your application’s behavior or for other debugging purposes. You can also combine Dapr API logging with Dapr log events (see configure and view Dapr Logs into the output if you want to use the logging capabilities together.
Overview
API logging is disabled by default.
To enable API logging, you can use the --enable-api-logging command-line option when starting the daprd process. For example:
./daprd --enable-api-logging
Configuring API logging in self-hosted mode
To enable API logging when running your app with the Dapr CLI, pass the --enable-api-logging flag:
dapr run \
  --enable-api-logging \
  -- node myapp.js
Viewing API logs in self-hosted mode
When running Dapr with the Dapr CLI, both your app’s log output and the Dapr runtime log output are redirected to the same session, for easy debugging.
The example below shows some API logs:
$ dapr run --enable-api-logging -- node myapp.js

ℹ️  Starting Dapr with id order-processor on port 56730
✅  You are up and running! Both Dapr and your app logs will appear here.
.....
INFO[0000] HTTP API Called app_id=order-processor instance=mypc method="POST /v1.0/state/mystate" scope=dapr.runtime.http-info type=log useragent=Go-http-client/1.1 ver=edge
== APP == INFO:root:Saving Order: {'orderId': '483'}
INFO[0000] HTTP API Called app_id=order-processor instance=mypc method="GET /v1.0/state/mystate/key123" scope=dapr.runtime.http-info type=log useragent=Go-http-client/1.1 ver=edge
== APP == INFO:root:Getting Order: {'orderId': '483'}
INFO[0000] HTTP API Called app_id=order-processor instance=mypc method="DELETE /v1.0/state/mystate" scope=dapr.runtime.http-info type=log useragent=Go-http-client/1.1 ver=edge
== APP == INFO:root:Deleted Order: {'orderId': '483'}
INFO[0000] HTTP API Called app_id=order-processor instance=mypc method="PUT /v1.0/metadata/cliPID" scope=dapr.runtime.http-info type=log useragent=Go-http-client/1.1 ver=edge
Configuring API logging in Kubernetes
You can enable the API logs for a sidecar by adding the following annotation in your pod spec template:
annotations:
  dapr.io/enable-api-logging: "true"
Viewing API logs on Kubernetes
Dapr API logs are written to stdout and stderr and you can view API logs on Kubernetes.
See the kubernetes API logs by executing the below command.
kubectl logs <pod_name> daprd -n <name_space>
The example below show info level API logging in Kubernetes (with URL obfuscation enabled).
time="2022-03-16T18:32:02.487041454Z" level=info msg="HTTP API Called" method="POST /v1.0/invoke/{id}/method/{method:*}" app_id=invoke-caller instance=invokecaller-f4f949886-cbnmt scope=dapr.runtime.http-info type=log useragent=Go-http-client/1.1 ver=edge
time="2022-03-16T18:32:02.698387866Z" level=info msg="HTTP API Called" method="POST /v1.0/invoke/{id}/method/{method:*}" app_id=invoke-caller instance=invokecaller-f4f949886-cbnmt scope=dapr.runtime.http-info type=log useragent=Go-http-client/1.1 ver=edge
time="2022-03-16T18:32:02.917629403Z" level=info msg="HTTP API Called" method="POST /v1.0/invoke/{id}/method/{method:*}" app_id=invoke-caller instance=invokecaller-f4f949886-cbnmt scope=dapr.runtime.http-info type=log useragent=Go-http-client/1.1 ver=edge
time="2022-03-16T18:32:03.137830112Z" level=info msg="HTTP API Called" method="POST /v1.0/invoke/{id}/method/{method:*}" app_id=invoke-caller instance=invokecaller-f4f949886-cbnmt scope=dapr.runtime.http-info type=log useragent=Go-http-client/1.1 ver=edge
time="2022-03-16T18:32:03.359097916Z" level=info msg="HTTP API Called" method="POST /v1.0/invoke/{id}/method/{method:*}" app_id=invoke-caller instance=invokecaller-f4f949886-cbnmt scope=dapr.runtime.http-info type=log useragent=Go-http-client/1.1 ver=edge
API logging configuration
Using the Dapr Configuration spec, you can configure the default behavior of API logging in Dapr runtimes.
Enable API logging by default
Using the Dapr Configuration spec, you can set the default value for the --enable-api-logging flag (and the correspondent annotation when running on Kubernetes), with the logging.apiLogging.enabled option. This value applies to all Dapr runtimes that reference the Configuration document or resource in which it’s defined.
- If
logging.apiLogging.enabledis set tofalse, the default value, API logging is disabled for Dapr runtimes unless--enable-api-loggingis set totrue(or thedapr.io/enable-api-logging: trueannotation is added). - When
logging.apiLogging.enabledistrue, Dapr runtimes have API logging enabled by default, and it can be disabled by setting--enable-api-logging=falseor with thedapr.io/enable-api-logging: falseannotation.
For example:
logging:
  apiLogging:
    enabled: true
Obfuscate URLs in HTTP API logging
By default, logs for API calls in the HTTP endpoints include the full URL being invoked (for example, POST /v1.0/invoke/directory/method/user-123), which could contain Personal Identifiable Information (PII).
To reduce the risk of PII being accidentally included in API logs (when enabled), Dapr can instead log the abstract route being invoked (for example, POST /v1.0/invoke/{id}/method/{method:*}). This can help ensuring compliance with privacy regulations such as GDPR.
To enable obfuscation of URLs in Dapr’s HTTP API logs, set logging.apiLogging.obfuscateURLs to true. For example:
logging:
  apiLogging:
    obfuscateURLs: true
Logs emitted by the Dapr gRPC APIs are not impacted by this configuration option, as they only include the name of the method invoked and no arguments.
Omit health checks from API logging
When API logging is enabled, all calls to the Dapr API server are logged, including those to health check endpoints (e.g. /v1.0/healthz). Depending on your environment, this may generate multiple log lines per minute and could create unwanted noise.
You can configure Dapr to not log calls to health check endpoints when API logging is enabled using the Dapr Configuration spec, by setting logging.apiLogging.omitHealthChecks: true. The default value is false, which means that health checks calls are logged in the API logs.
For example:
logging:
  apiLogging:
    omitHealthChecks: true
4 - Profiling & Debugging
In any real world scenario, an app might start exhibiting undesirable behavior in terms of resource spikes. CPU/Memory spikes are not uncommon in most cases.
Dapr allows users to start an on-demand profiling session using pprof through its profiling server endpoint and start an instrumentation session to discover problems and issues such as concurrency, performance, cpu and memory usage.
Enable profiling
Dapr allows you to enable profiling in both Kubernetes and stand-alone modes.
Stand-alone
To enable profiling in Standalone mode, pass the --enable-profiling and the --profile-port flags to the Dapr CLI:
Note that profile-port is not required, and if not provided Dapr will pick an available port.
dapr run --enable-profiling --profile-port 7777 python myapp.py
Kubernetes
To enable profiling in Kubernetes, simply add the dapr.io/enable-profiling annotation to your Dapr annotated pod:
   annotations:
    dapr.io/enabled: "true"
    dapr.io/app-id: "rust-app"
    dapr.io/enable-profiling: "true"
Debug a profiling session
After profiling is enabled, we can start a profiling session to investigate what’s going on with the Dapr runtime.
Stand-alone
For Standalone mode, locate the Dapr instance that you want to profile:
dapr list
APP ID           DAPR PORT     APP PORT  COMMAND      AGE  CREATED              PID
node-subscriber  3500          3000      node app.js  12s  2019-09-09 15:11.24  896
Grab the DAPR PORT, and if profiling has been enabled as described above, you can now start using pprof to profile Dapr.
Look at the Kubernetes examples above for some useful commands to profile Dapr.
More info on pprof can be found here.
Kubernetes
First, find the pod containing the Dapr runtime. If you don’t already know the the pod name, type kubectl get pods:
NAME                                        READY     STATUS    RESTARTS   AGE
divideapp-6dddf7dc74-6sq4l                  2/2       Running   0          2d23h
If profiling has been enabled successfully, the runtime logs should show the following:
time="2019-09-09T20:56:21Z" level=info msg="starting profiling server on port 7777"
In this case, we want to start a session with the Dapr runtime inside of pod divideapp-6dddf7dc74-6sq4l.
We can do so by connecting to the pod via port forwarding:
kubectl port-forward divideapp-6dddf7dc74-6sq4 7777:7777
Forwarding from 127.0.0.1:7777 -> 7777
Forwarding from [::1]:7777 -> 7777
Handling connection for 7777
Now that the connection has been established, we can use pprof to profile the Dapr runtime.
The following example will create a cpu.pprof file containing samples from a profile session that lasts 120 seconds:
curl "http://localhost:7777/debug/pprof/profile?seconds=120" > cpu.pprof
Analyze the file with pprof:
pprof cpu.pprof
You can also save the results in a visualized way inside a PDF:
go tool pprof --pdf your-binary-file http://localhost:7777/debug/pprof/profile?seconds=120 > profile.pdf
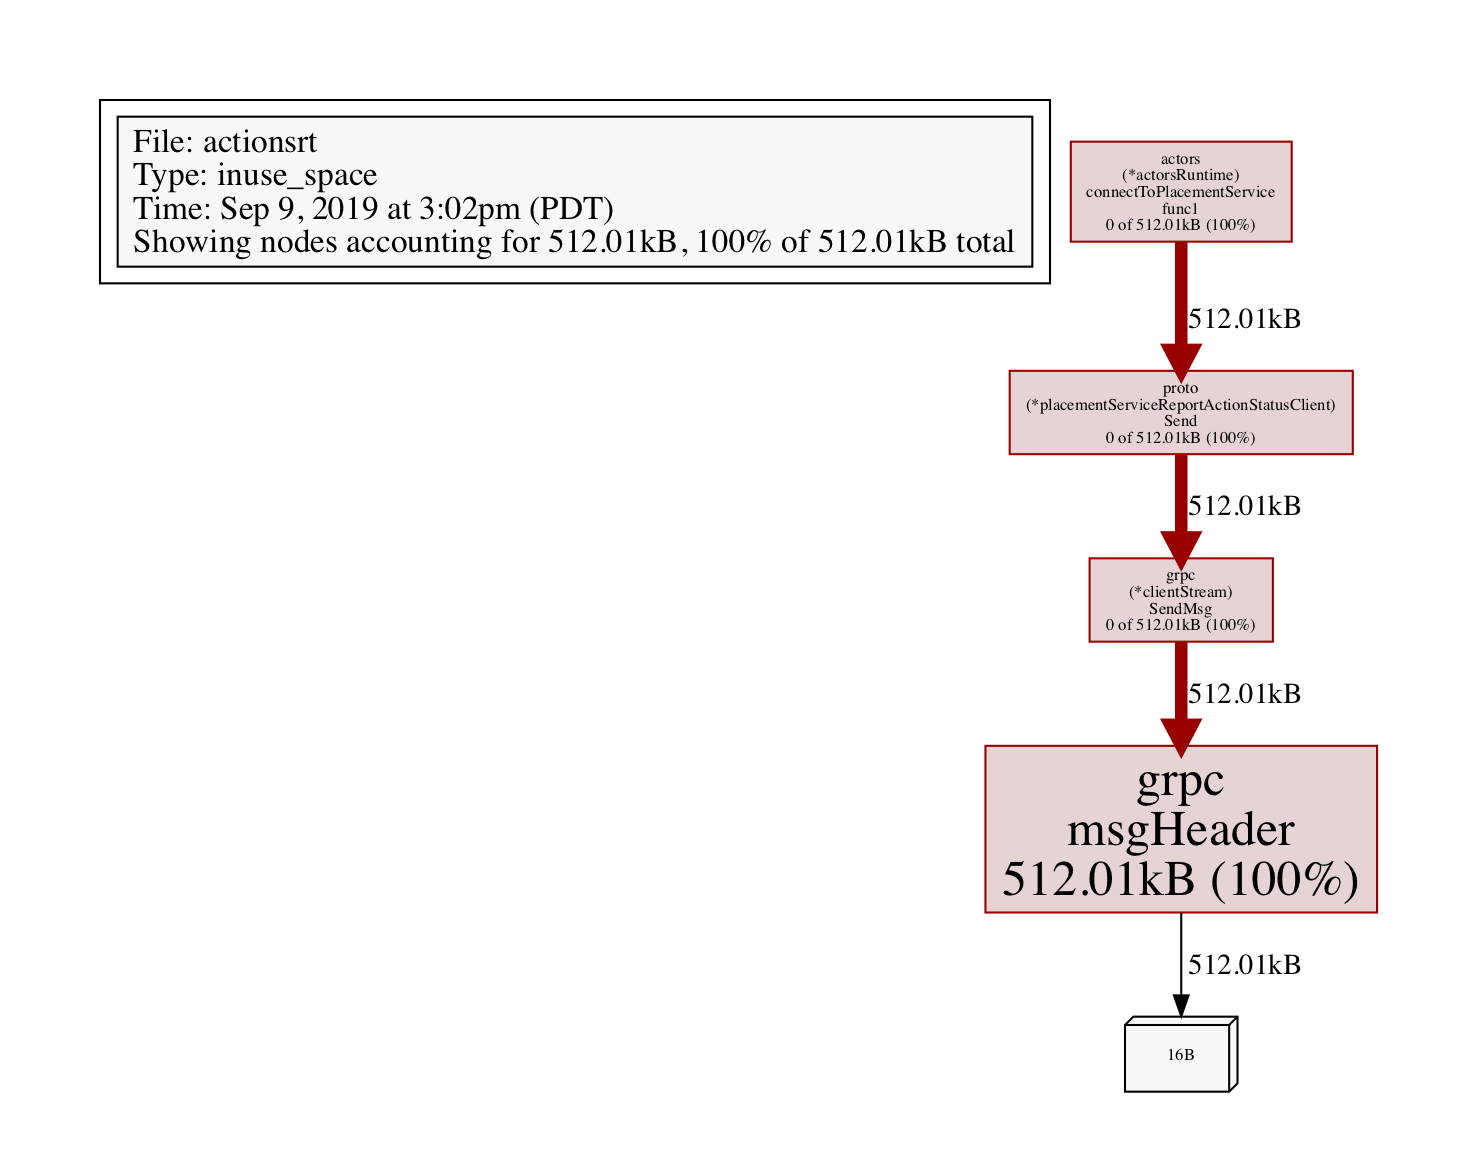
For memory related issues, you can profile the heap:
go tool pprof --pdf your-binary-file http://localhost:7777/debug/pprof/heap > heap.pdf
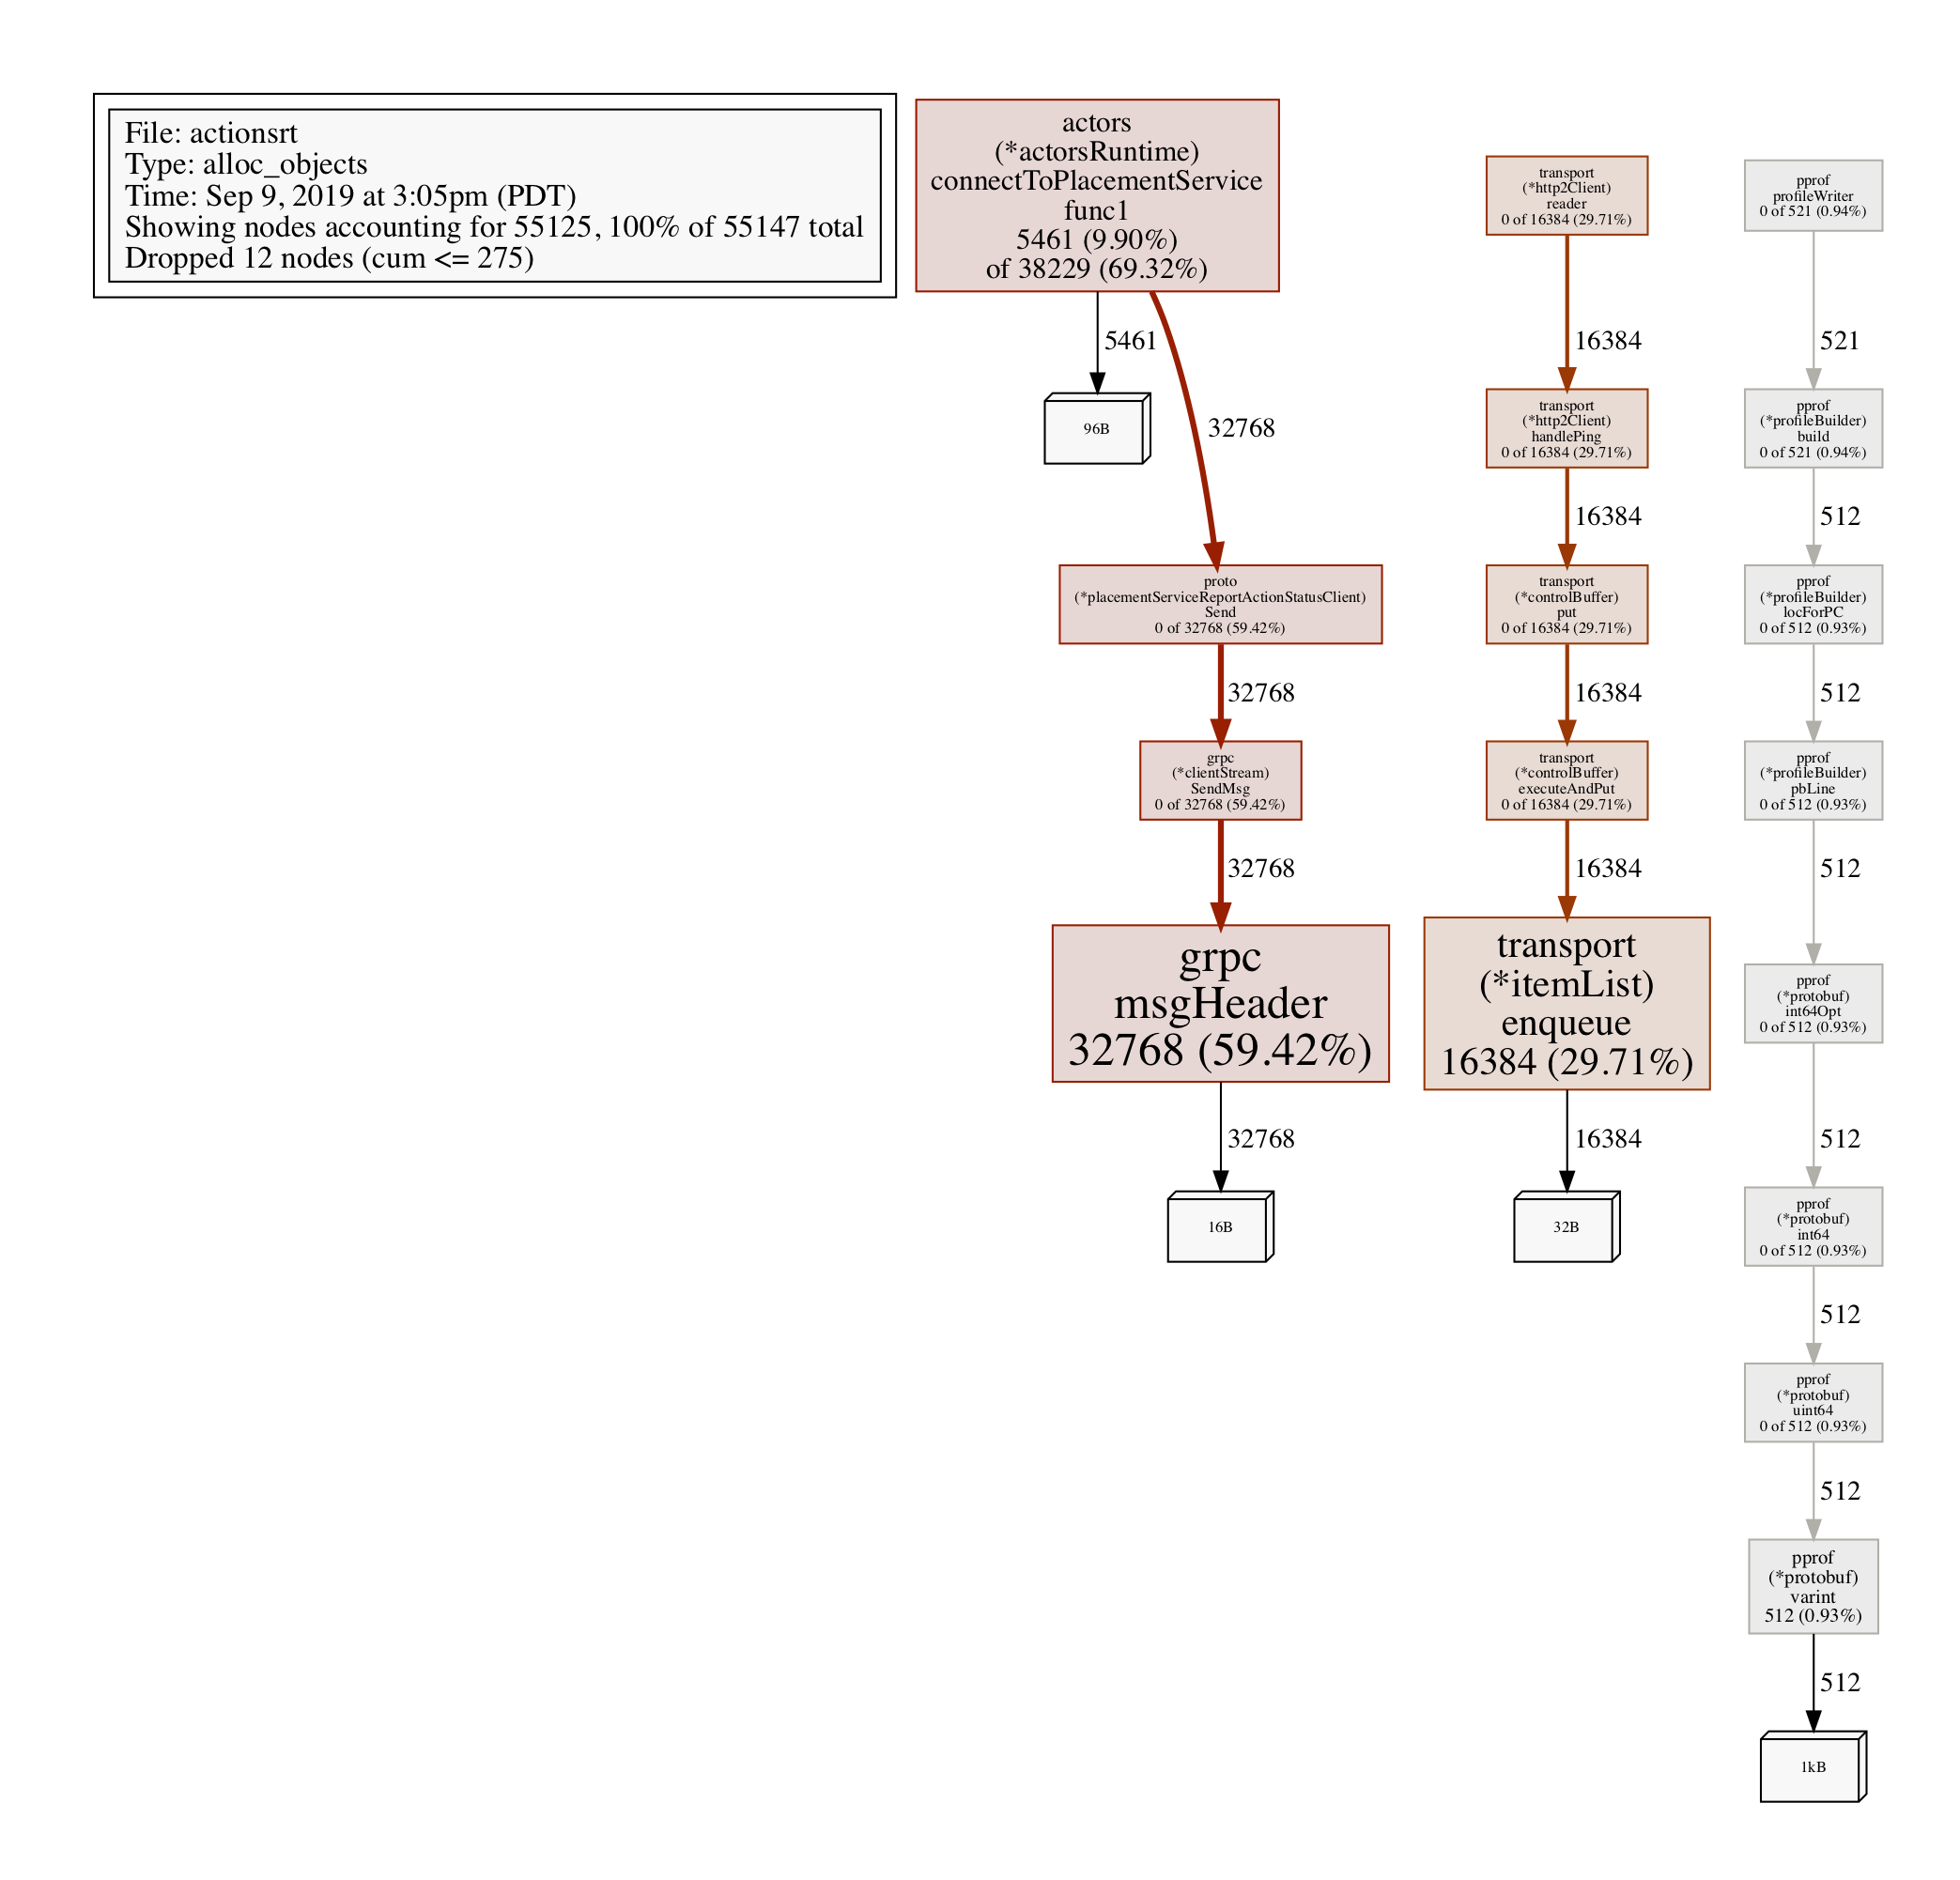
Profiling allocated objects:
go tool pprof http://localhost:7777/debug/pprof/heap
> exit

Saved profile in /Users/myusername/pprof/pprof.daprd.alloc_objects.alloc_space.inuse_objects.inuse_space.003.pb.gz
To analyze, grab the file path above (its a dynamic file path, so pay attention to note paste this one), and execute:
go tool pprof -alloc_objects --pdf /Users/myusername/pprof/pprof.daprd.alloc_objects.alloc_space.inuse_objects.inuse_space.003.pb.gz > alloc-objects.pdf