This is the multi-page printable view of this section. Click here to print.
Open Telemetry Collector
- 1: Using OpenTelemetry Collector to collect traces
- 2: Using OpenTelemetry Collector to collect traces to send to App Insights
- 3: Using OpenTelemetry Collector to collect traces to send to Jaeger
1 - Using OpenTelemetry Collector to collect traces
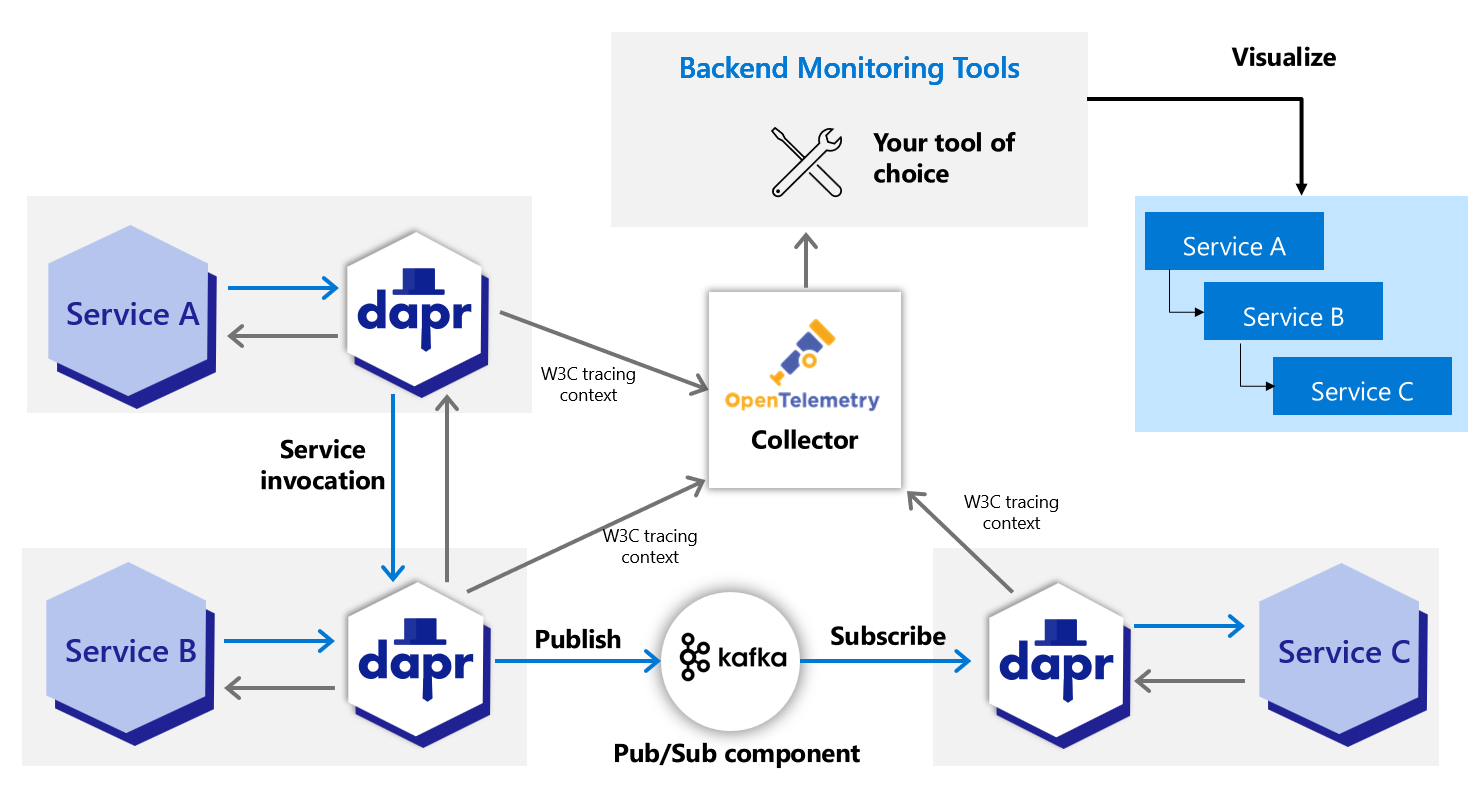
Dapr directly writes traces using the OpenTelemetry (OTLP) protocol as the recommended method. For observability tools that support the OTLP directly, it is recommended to use the OpenTelemetry Collector, as it allows your application to quickly offload data and includes features, such as retries, batching, and encryption. For more information, read the Open Telemetry Collector documentation.
Dapr can also write traces using the Zipkin protocol. Prior to supporting the OTLP protocol, the Zipkin protocol was used with the OpenTelemetry Collector to send traces to observability tools such as AWS X-Ray, Google Cloud Operations Suite, and Azure Monitor. Both protocol approaches are valid, however the OpenTelemetry protocol is the recommended choice.
Prerequisites
- Install Dapr on Kubernetes
- Verify your trace backends are already set up to receive traces
- Review your OTEL Collector exporter’s required parameters:
Set up OTEL Collector to push to your trace backend
-
Check out the
open-telemetry-collector-generic.yaml. -
Replace the
<your-exporter-here>section with the correct settings for your trace exporter.- Refer to the OTEL Collector links in the prerequisites section to determine the correct settings.
-
Apply the configuration with:
kubectl apply -f open-telemetry-collector-generic.yaml
Set up Dapr to send traces to OTEL Collector
Set up a Dapr configuration file to turn on tracing and deploy a tracing exporter component that uses the OpenTelemetry Collector.
-
Use this
collector-config.yamlfile to create your own configuration. -
Apply the configuration with:
kubectl apply -f collector-config.yaml
Deploy your app with tracing
Apply the appconfig configuration by adding a dapr.io/config annotation to the container that you want to participate in the distributed tracing, as shown in the following example:
apiVersion: apps/v1
kind: Deployment
metadata:
  ...
spec:
  ...
  template:
    metadata:
      ...
      annotations:
        dapr.io/enabled: "true"
        dapr.io/app-id: "MyApp"
        dapr.io/app-port: "8080"
        dapr.io/config: "appconfig"
Note
If you are using one of the Dapr tutorials, such as distributed calculator, theappconfig configuration is already configured, so no additional settings are needed.
You can register multiple tracing exporters at the same time, and the tracing logs are forwarded to all registered exporters.
That’s it! There’s no need to include any SDKs or instrument your application code. Dapr automatically handles the distributed tracing for you.
View traces
Deploy and run some applications. Wait for the trace to propagate to your tracing backend and view them there.
Related links
- Try out the observability quickstart
- Learn how to set tracing configuration options
2 - Using OpenTelemetry Collector to collect traces to send to App Insights
Dapr integrates with OpenTelemetry (OTEL) Collector using the OpenTelemetry protocol (OTLP). This guide walks through an example using Dapr to push traces to Azure Application Insights, using the OpenTelemetry Collector.
Prerequisites
- Install Dapr on Kubernetes
- Create an Application Insights resource and make note of your Application Insights connection string.
Set up OTEL Collector to push to your App Insights instance
To push traces to your Application Insights instance, install the OpenTelemetry Collector on your Kubernetes cluster.
-
Download and inspect the
open-telemetry-collector-appinsights.yamlfile. -
Replace the
<CONNECTION_STRING>placeholder with your App Insights connection string. -
Deploy the OpenTelemetry Collector into the same namespace where your Dapr-enabled applications are running:
kubectl apply -f open-telemetry-collector-appinsights.yaml
Set up Dapr to send traces to the OpenTelemetry Collector
Create a Dapr configuration file to enable tracing and send traces to the OpenTelemetry Collector via OTLP.
-
Download and inspect the
collector-config-otel.yaml. Update thenamespaceandotel.endpointAddressvalues to align with the namespace where your Dapr-enabled applications and OpenTelemetry Collector are deployed. -
Apply the configuration with:
kubectl apply -f collector-config-otel.yaml
Deploy your app with tracing
Apply the tracing configuration by adding a dapr.io/config annotation to the Dapr applications that you want to include in distributed tracing, as shown in the following example:
apiVersion: apps/v1
kind: Deployment
metadata:
  ...
spec:
  ...
  template:
    metadata:
      ...
      annotations:
        dapr.io/enabled: "true"
        dapr.io/app-id: "MyApp"
        dapr.io/app-port: "8080"
        dapr.io/config: "tracing"
Note
If you are using one of the Dapr tutorials, such as distributed calculator, you will need to update theappconfig configuration to tracing.
You can register multiple tracing exporters at the same time, and the tracing logs are forwarded to all registered exporters.
That’s it! There’s no need to include any SDKs or instrument your application code. Dapr automatically handles the distributed tracing for you.
View traces
Deploy and run some applications. After a few minutes, you should see tracing logs appearing in your App Insights resource. You can also use the Application Map to examine the topology of your services, as shown below:
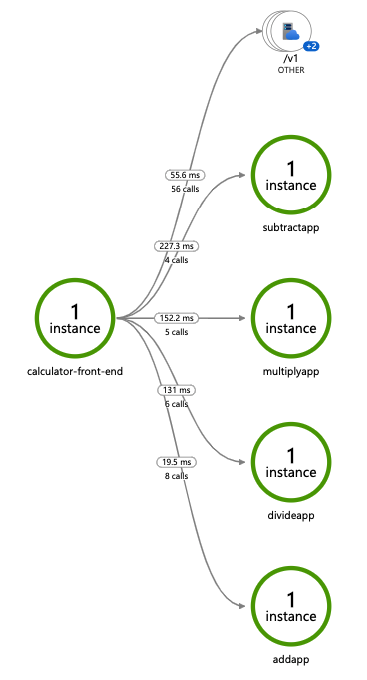
Note
Only operations going through Dapr API exposed by Dapr sidecar (for example, service invocation or event publishing) are displayed in Application Map topology.Related links
- Try out the observability quickstart
- Learn how to set tracing configuration options
3 - Using OpenTelemetry Collector to collect traces to send to Jaeger
While Dapr supports writing traces using OpenTelemetry (OTLP) and Zipkin protocols, Zipkin support for Jaeger has been deprecated in favor of OTLP. Although Jaeger supports OTLP directly, the recommended approach for production is to use the OpenTelemetry Collector to collect traces from Dapr and send them to Jaeger, allowing your application to quickly offload data and take advantage of features like retries, batching, and encryption. For more information, read the Open Telemetry Collector documentation.
Configure Jaeger in self-hosted mode
Local setup
The simplest way to start Jaeger is to run the pre-built, all-in-one Jaeger image published to DockerHub and expose the OTLP port:
docker run -d --name jaeger \
  -p 4317:4317  \
  -p 16686:16686 \
  jaegertracing/all-in-one:1.49
Next, create the following config.yaml file locally:
Note: Because you are using the Open Telemetry protocol to talk to Jaeger, you need to fill out the
otelsection of the tracing configuration and set theendpointAddressto the address of the Jaeger container.
apiVersion: dapr.io/v1alpha1
kind: Configuration
metadata:
  name: tracing
  namespace: default
spec:
  tracing:
    samplingRate: "1"
    stdout: true
    otel:
      endpointAddress: "localhost:4317"
      isSecure: false
      protocol: grpc
To launch the application referring to the new YAML configuration file, use
the --config option. For example:
dapr run --app-id myapp --app-port 3000 node app.js --config config.yaml
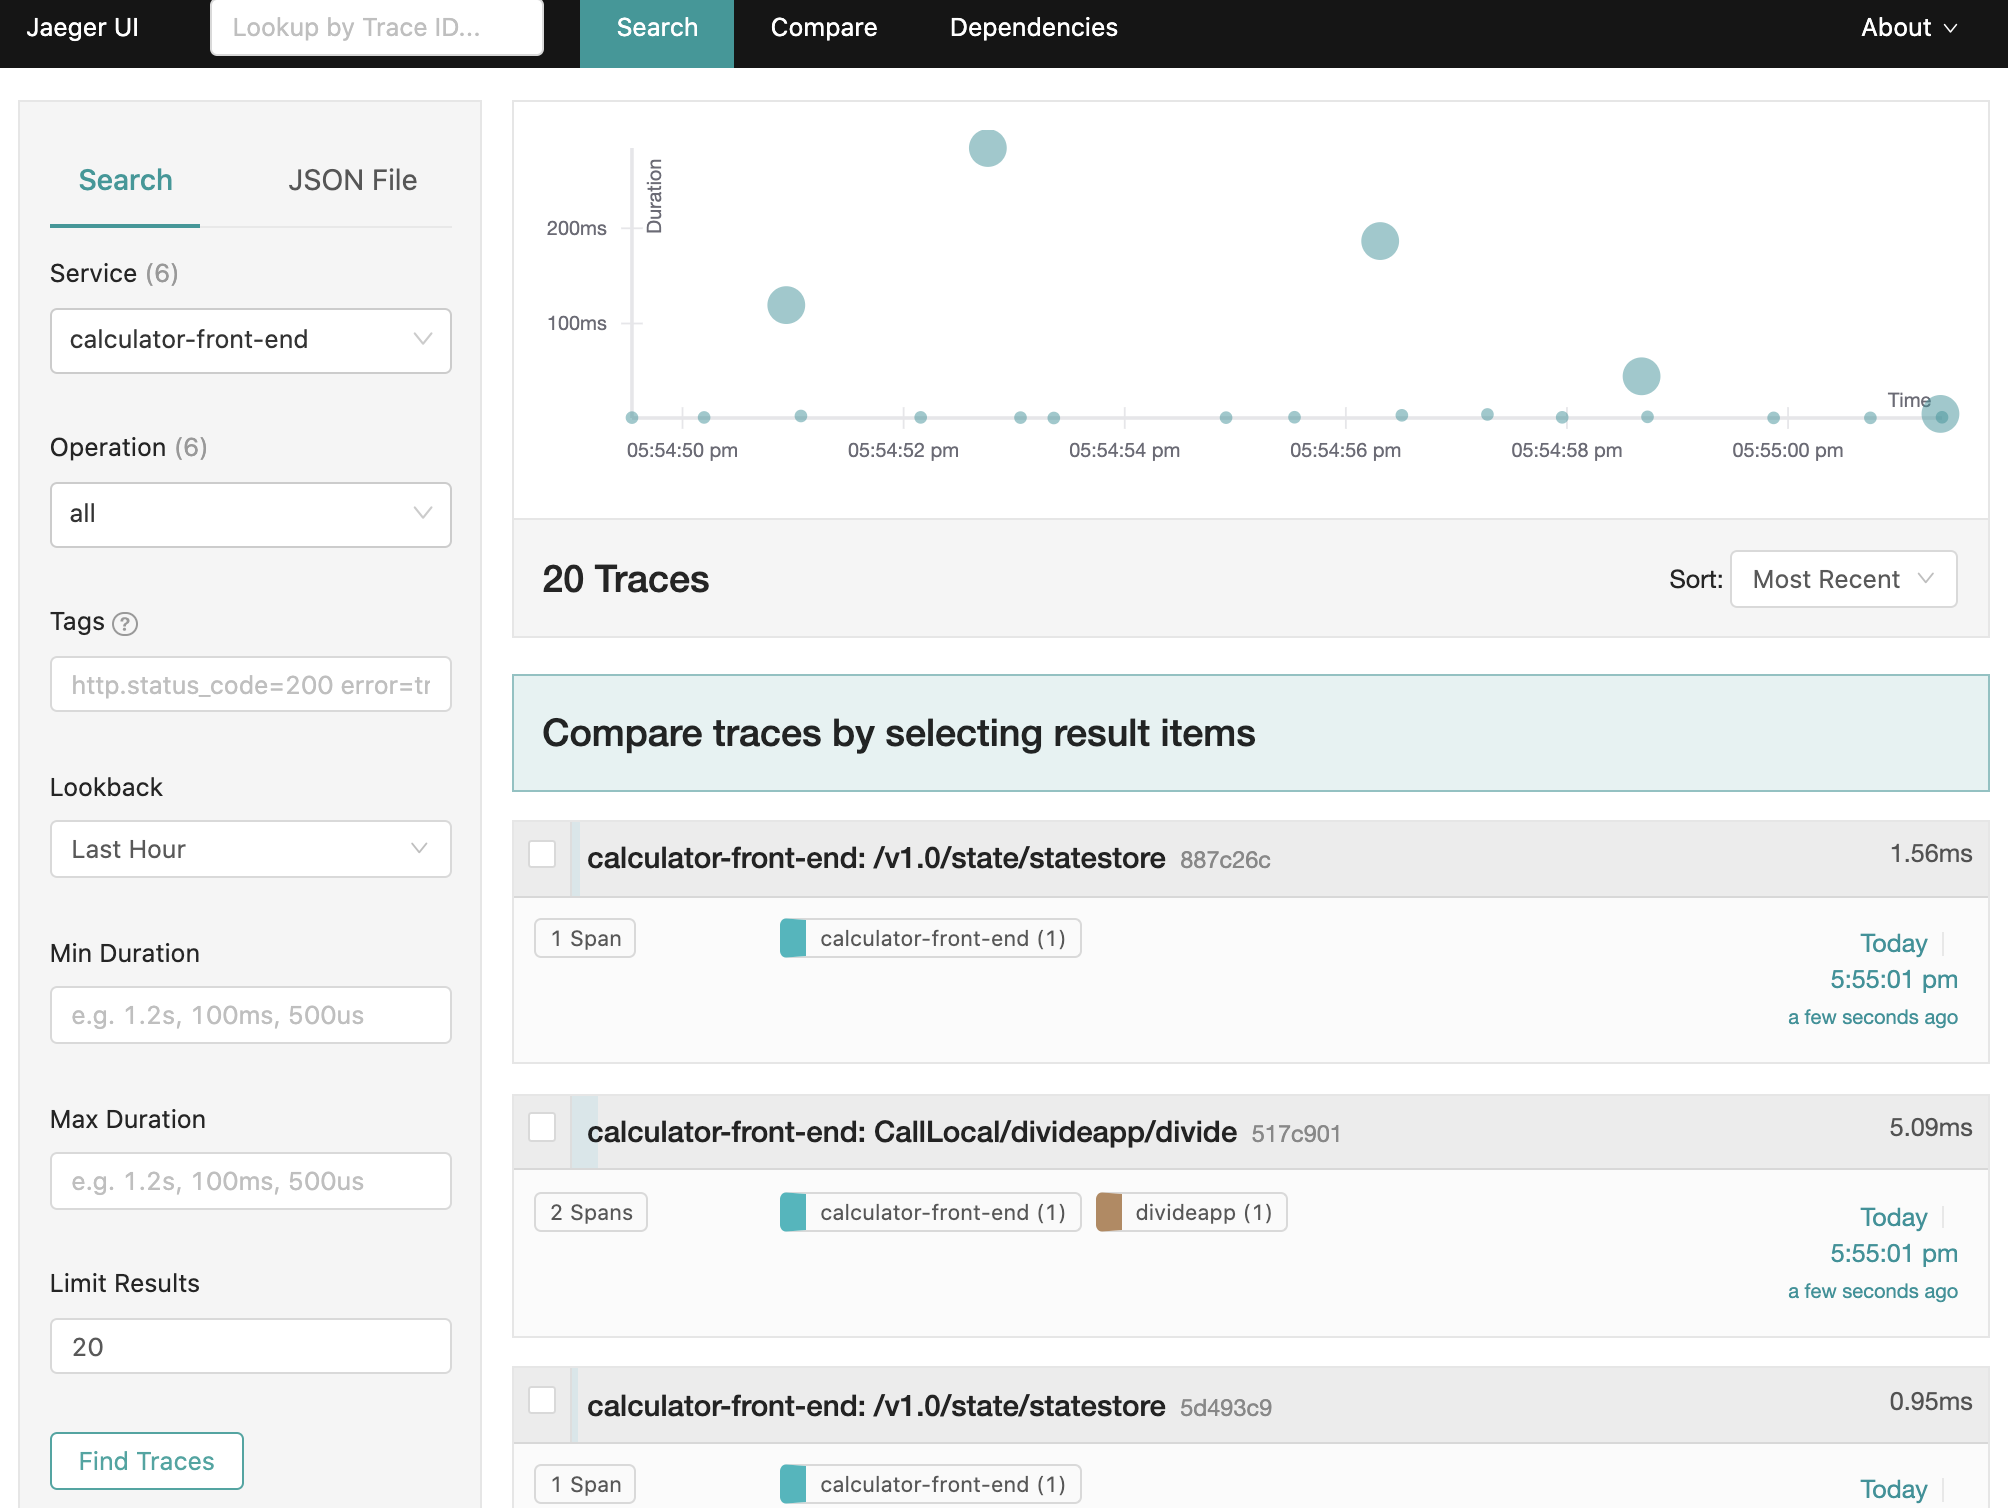
View traces
To view traces in your browser, go to http://localhost:16686 to see the Jaeger UI.
Configure Jaeger on Kubernetes with the OpenTelemetry Collector
The following steps show you how to configure Dapr to send distributed tracing data to the OpenTelemetry Collector which, in turn, sends the traces to Jaeger.
Prerequisites
- Install Dapr on Kubernetes
- Set up Jaeger using the Jaeger Kubernetes Operator
Set up OpenTelemetry Collector to push to Jaeger
To push traces to your Jaeger instance, install the OpenTelemetry Collector on your Kubernetes cluster.
-
Download and inspect the
open-telemetry-collector-jaeger.yamlfile. -
In the data section of the
otel-collector-confConfigMap, update theotlp/jaeger.endpointvalue to reflect the endpoint of your Jaeger collector Kubernetes service object. -
Deploy the OpenTelemetry Collector into the same namespace where your Dapr-enabled applications are running:
kubectl apply -f open-telemetry-collector-jaeger.yaml
Set up Dapr to send traces to OpenTelemetryCollector
Create a Dapr configuration file to enable tracing and export the sidecar traces to the OpenTelemetry Collector.
-
Use the
collector-config-otel.yamlfile to create your own Dapr configuration. -
Update the
namespaceandotel.endpointAddressvalues to align with the namespace where your Dapr-enabled applications and OpenTelemetry Collector are deployed. -
Apply the configuration with:
kubectl apply -f collector-config.yaml
Deploy your app with tracing enabled
Apply the tracing Dapr configuration by adding a dapr.io/config annotation to the application deployment that you want to enable distributed tracing for, as shown in the following example:
apiVersion: apps/v1
kind: Deployment
metadata:
  ...
spec:
  ...
  template:
    metadata:
      ...
      annotations:
        dapr.io/enabled: "true"
        dapr.io/app-id: "MyApp"
        dapr.io/app-port: "8080"
        dapr.io/config: "tracing"
You can register multiple tracing exporters at the same time, and the tracing logs are forwarded to all registered exporters.
That’s it! There’s no need to include the OpenTelemetry SDK or instrument your application code. Dapr automatically handles the distributed tracing for you.
View traces
To view Dapr sidecar traces, port-forward the Jaeger Service and open the UI:
kubectl port-forward svc/jaeger-query 16686 -n observability
In your browser, go to http://localhost:16686 and you will see the Jaeger UI.