This is the multi-page printable view of this section. Click here to print.
Tracing
- 1: Distributed tracing overview
- 2: W3C trace context overview
- 3: Configure Dapr to send distributed tracing data
- 4: Open Telemetry Collector
- 4.1: Using OpenTelemetry Collector to collect traces
- 4.2: Using Dynatrace OpenTelemetry Collector to collect traces to send to Dynatrace
- 4.3: Using OpenTelemetry Collector to collect traces to send to App Insights
- 4.4: Using OpenTelemetry Collector to collect traces to send to Jaeger
- 5: How-To: Set-up New Relic for distributed tracing
- 6: How-To: Set up Zipkin for distributed tracing
- 7: How-To: Set up Dash0 for distributed tracing
- 8: How-To: Set up Datadog for distributed tracing
1 - Distributed tracing overview
Dapr uses the Open Telemetry (OTEL) and Zipkin protocols for distributed traces. OTEL is the industry standard and is the recommended trace protocol to use.
Most observability tools support OTEL, including:
The following diagram demonstrates how Dapr (using OTEL and Zipkin protocols) integrates with multiple observability tools.
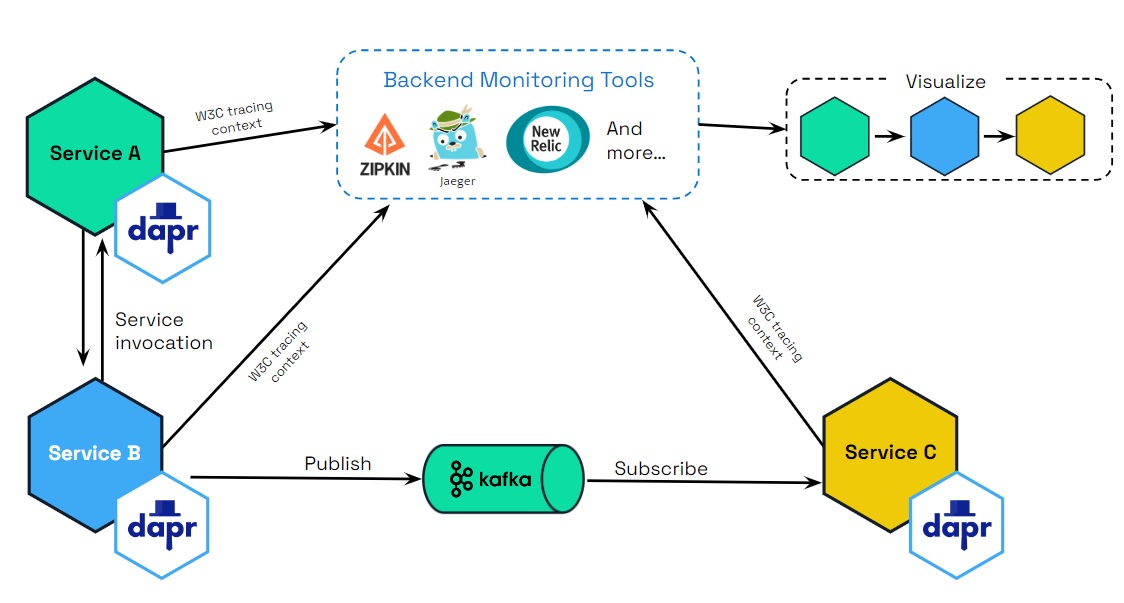
Scenarios
Tracing is used with service invocaton and pub/sub APIs. You can flow trace context between services that uses these APIs. There are two scenarios for how tracing is used:
- Dapr generates the trace context and you propagate the trace context to another service.
- You generate the trace context and Dapr propagates the trace context to a service.
Scenario 1: Dapr generates trace context headers
Propagating sequential service calls
Dapr takes care of creating the trace headers. However, when there are more than two services, you’re responsible for propagating the trace headers between them. Let’s go through the scenarios with examples:
Single service invocation call
For example, service A -> service B.
Dapr generates the trace headers in service A, which are then propagated from service A to service B. No further propagation is needed.
Multiple sequential service invocation calls
For example, service A -> service B -> propagate trace headers to -> service C and so on to further Dapr-enabled services.
Dapr generates the trace headers at the beginning of the request in service A, which are then propagated to service B. You are now responsible for taking the headers and propagating them to service C, since this is specific to your application.
In other words, if the app is calling to Dapr and wants to trace with an existing trace header (span), it must always propagate to Dapr (from service B to service C, in this example). Dapr always propagates trace spans to an application.
Note
No helper methods are exposed in Dapr SDKs to propagate and retrieve trace context. You need to use HTTP/gRPC clients to propagate and retrieve trace headers through HTTP headers and gRPC metadata.Request is from external endpoint
For example, from a gateway service to a Dapr-enabled service A.
An external gateway ingress calls Dapr, which generates the trace headers and calls service A. Service A then calls service B and further Dapr-enabled services.
You must propagate the headers from service A to service B. For example: Ingress -> service A -> propagate trace headers -> service B. This is similar to case 2.
Pub/sub messages
Dapr generates the trace headers in the published message topic. For rawPayload messages, it is possible to specify the traceparent header to propagate the tracing information. These trace headers are propagated to any services listening on that topic.
Propagating multiple different service calls
In the following scenarios, Dapr does some of the work for you, with you then creating or propagating trace headers.
Multiple service calls to different services from single service
When you are calling multiple services from a single service, you need to propagate the trace headers. For example:
service A -> service B
[ .. some code logic ..]
service A -> service C
[ .. some code logic ..]
service A -> service D
[ .. some code logic ..]
In this case:
- When
service Afirst callsservice B, Dapr generates the trace headers inservice A. - The trace headers in
service Aare propagated toservice B. - These trace headers are returned in the response from
service Bas part of response headers. - You then need to propagate the returned trace context to the next services, like
service Candservice D, as Dapr does not know you want to reuse the same header.
Scenario 2: You generate your own trace context headers from non-Daprized applications
Generating your own trace context headers is more unusual and typically not required when calling Dapr.
However, there are scenarios where you could specifically choose to add W3C trace headers into a service call. For example, you have an existing application that does not use Dapr. In this case, Dapr still propagates the trace context headers for you.
If you decide to generate trace headers yourself, there are three ways this can be done:
Standard OpenTelemetry SDK
You can use the industry standard OpenTelemetry SDKs to generate trace headers and pass these trace headers to a Dapr-enabled service. This is the preferred method.
Vendor SDK
You can use a vendor SDK that provides a way to generate W3C trace headers and pass them to a Dapr-enabled service.
W3C trace context
You can handcraft a trace context following W3C trace context specifications and pass them to a Dapr-enabled service.
Read the trace context overview for more background and examples on W3C trace context and headers.
Baggage Support
Dapr supports two distinct mechanisms for propagating W3C Baggage alongside trace context:
Context Baggage (OpenTelemetry)
- Follows OpenTelemetry conventions with decoded values
- Used when working with OpenTelemetry context propagation
- Values are stored and transmitted in their original, unencoded form
- Recommended for OpenTelemetry integrations and when working with application context
Header/Metadata Baggage
- You must URL encode special characters (for example,
%20for spaces,%2Ffor slashes) when setting header/metadata baggage - Values remain percent-encoded in transport as required by the W3C Baggage spec
- Values stay encoded when inspecting raw headers/metadata
- Only OpenTelemetry APIs will decode the values
- Example: Use
serverNode=DF%2028(notserverNode=DF 28) when setting header baggage
- You must URL encode special characters (for example,
For security purposes, context baggage and header baggage are strictly separated and never merged between domains. This ensures that baggage values maintain their intended format and security properties.
Using Baggage with Dapr
You can propagate baggage using either mechanism, depending on your use case.
- In your application code: Set the baggage in the context before making a Dapr API call
- When calling Dapr: Pass the context to any Dapr API call
- Inside Dapr: The Dapr runtime automatically picks up the baggage
- Propagation: Dapr automatically propagates the baggage to downstream services, maintaining the appropriate encoding for each mechanism
Here are examples of both mechanisms:
1. Using Context Baggage (OpenTelemetry)
When using OpenTelemetry SDK:
import 	otelbaggage "go.opentelemetry.io/otel/baggage"

// Set baggage in context (values remain unencoded)
baggage, err = otelbaggage.Parse("userId=cassie,serverNode=DF%2028")
...
ctx := otelbaggage.ContextWithBaggage(t.Context(), baggage)
)

// Pass this context to any Dapr API call
client.InvokeMethodWithContent(ctx, "serviceB", ...)
2. Using Header/Metadata Baggage
When using gRPC metadata:
import "google.golang.org/grpc/metadata"

// Set URL-encoded baggage in context
ctx = metadata.AppendToOutgoingContext(ctx,
    "baggage", "userId=cassie,serverNode=DF%2028",
)

// Pass this context to any Dapr API call
client.InvokeMethodWithContent(ctx, "serviceB", ...)
3. Receiving Baggage in Target Service
In your target service, you can access the propagated baggage:
// Using OpenTelemetry (values are automatically decoded)
import "go.opentelemetry.io/otel/baggage"

bag := baggage.FromContext(ctx)
userID := bag.Member("userId").Value()  // "cassie"
// Using raw gRPC metadata (values remain percent-encoded)
import "google.golang.org/grpc/metadata"

md, _ := metadata.FromIncomingContext(ctx)
if values := md.Get("baggage"); len(values) > 0 {
    // values[0] contains the percent-encoded string you set: "userId=cassie,serverNode=DF%2028"
    // Remember: You must URL encode special characters when setting baggage

    // To decode the values, use OpenTelemetry APIs:
    bag, err := baggage.Parse(values[0])
    ...
    userID := bag.Member("userId").Value()  // "cassie"
}
HTTP Example (URL-encoded):
curl -X POST http://localhost:3500/v1.0/invoke/serviceB/method/hello \
  -H "Content-Type: application/json" \
  -H "baggage: userID=cassie,serverNode=DF%2028" \
  -d '{"message": "Hello service B"}'
gRPC Example (URL-encoded):
ctx = grpcMetadata.AppendToOutgoingContext(ctx,
    "baggage", "userID=cassie,serverNode=DF%2028",
)
Common Use Cases
Baggage is useful for:
- Propagating user IDs or correlation IDs across services
- Passing tenant or environment information
- Maintaining consistent context across service boundaries
- Debugging and troubleshooting distributed transactions
Best Practices
Choose the Right Mechanism
- Use Context Baggage when working with OpenTelemetry
- Use Header Baggage when working directly with HTTP/gRPC
Security Considerations
- Be mindful that baggage is propagated across service boundaries
- Don’t include sensitive information in baggage
- Remember that context and header baggage remain separate
Related Links
2 - W3C trace context overview
Dapr uses the Open Telemetry protocol, which in turn uses the W3C trace context for distributed tracing for both service invocation and pub/sub messaging. Dapr generates and propagates the trace context information, which can be sent to observability tools for visualization and querying.
Background
Distributed tracing is a methodology implemented by tracing tools to follow, analyze, and debug a transaction across multiple software components.
Typically, a distributed trace traverses more than one service, which requires it to be uniquely identifiable. Trace context propagation passes along this unique identification.
In the past, trace context propagation was implemented individually by each different tracing vendor. In multi-vendor environments, this causes interoperability problems, such as:
- Traces collected by different tracing vendors can’t be correlated, as there is no shared unique identifier.
- Traces crossing boundaries between different tracing vendors can’t be propagated, as there is no forwarded, uniformly agreed set of identification.
- Vendor-specific metadata might be dropped by intermediaries.
- Cloud platform vendors, intermediaries, and service providers cannot guarantee to support trace context propagation, as there is no standard to follow.
Previously, most applications were monitored by a single tracing vendor and stayed within the boundaries of a single platform provider, so these problems didn’t have a significant impact.
Today, an increasing number of applications are distributed and leverage multiple middleware services and cloud platforms. This transformation of modern applications requires a distributed tracing context propagation standard.
The W3C trace context specification defines a universally agreed-upon format for the exchange of trace context propagation data (referred to as trace context). Trace context solves the above problems by providing:
- A unique identifier for individual traces and requests, allowing trace data of multiple providers to be linked together.
- An agreed-upon mechanism to forward vendor-specific trace data and avoid broken traces when multiple tracing tools participate in a single transaction.
- An industry standard that intermediaries, platforms, and hardware providers can support.
This unified approach for propagating trace data improves visibility into the behavior of distributed applications, facilitating problem and performance analysis.
W3C trace context and headers format
W3C trace context
Dapr uses the standard W3C trace context headers.
- For HTTP requests, Dapr uses
traceparentheader. - For gRPC requests, Dapr uses
grpc-trace-binheader.
When a request arrives without a trace ID, Dapr creates a new one. Otherwise, it passes the trace ID along the call chain.
W3C trace headers
These are the specific trace context headers that are generated and propagated by Dapr for HTTP and gRPC.
Copy these headers when propagating a trace context header from an HTTP response to an HTTP request:
Traceparent header
The traceparent header represents the incoming request in a tracing system in a common format, understood by all vendors:
traceparent: 00-0af7651916cd43dd8448eb211c80319c-b7ad6b7169203331-01
Learn more about the traceparent fields details.
Tracestate header
The tracestate header includes the parent in a potentially vendor-specific format:
tracestate: congo=t61rcWkgMzE
Learn more about the tracestate fields details.
Baggage Support
Dapr supports W3C Baggage for propagating key-value pairs alongside trace context through two distinct mechanisms:
Context Baggage (OpenTelemetry)
- Follows OpenTelemetry conventions with decoded values
- Used when propagating baggage through application context
- Values are stored in their original, unencoded form
- Example of how it would be printed with OpenTelemetry APIs:
baggage: userId=cassie,serverNode=DF 28,isVIP=true
HTTP Header Baggage
- You must URL encode special characters (for example,
%20for spaces,%2Ffor slashes) when setting header baggage - Values remain percent-encoded in HTTP headers as required by the W3C Baggage spec
- Values stay encoded when inspecting raw headers in Dapr
- Only OpenTelemetry APIs like
otelbaggage.Parse()will decode the values - Example (note the URL-encoded space
%20):curl -X POST http://localhost:3500/v1.0/invoke/serviceB/method/hello \ -H "Content-Type: application/json" \ -H "baggage: userId=cassie,serverNode=DF%2028,isVIP=true" \ -d '{"message": "Hello service B"}'
- You must URL encode special characters (for example,
For security purposes, context baggage and header baggage are strictly separated and never merged between domains. This ensures that baggage values maintain their intended format and security properties in each domain.
Multiple baggage headers are supported and will be combined according to the W3C specification. Dapr automatically propagates baggage across service calls while maintaining the appropriate encoding for each domain.
In the gRPC API calls, trace context is passed through grpc-trace-bin header.
Baggage Support
Dapr supports W3C Baggage for propagating key-value pairs alongside trace context through two distinct mechanisms:
Context Baggage (OpenTelemetry)
- Follows OpenTelemetry conventions with decoded values
- Used when propagating baggage through gRPC context
- Values are stored in their original, unencoded form
- Example of how it would be printed with OpenTelemetry APIs:
baggage: userId=cassie,serverNode=DF 28,isVIP=true
gRPC Metadata Baggage
- You must URL encode special characters (for example,
%20for spaces,%2Ffor slashes) when setting metadata baggage - Values remain percent-encoded in gRPC metadata
- Example (note the URL-encoded space
%20):baggage: userId=cassie,serverNode=DF%2028,isVIP=true
- You must URL encode special characters (for example,
For security purposes, context baggage and metadata baggage are strictly separated and never merged between domains. This ensures that baggage values maintain their intended format and security properties in each domain.
Multiple baggage metadata entries are supported and will be combined according to the W3C specification. Dapr automatically propagates baggage across service calls while maintaining the appropriate encoding for each domain.
Related Links
3 - Configure Dapr to send distributed tracing data
Note
It is recommended to run Dapr with tracing enabled for any production scenario. You can configure Dapr to send tracing and telemetry data to many observability tools based on your environment, whether it is running in the cloud or on-premises.Configuration
The tracing section under the Configuration spec contains the following properties:
spec:
  tracing:
    samplingRate: "1"
    otel:
      endpointAddress: "myendpoint.cluster.local:4317"
    zipkin:
      endpointAddress: "https://..."
The following table lists the properties for tracing:
| Property | Type | Description |
|---|---|---|
samplingRate | string | Set sampling rate for tracing to be enabled or disabled. |
stdout | bool | True write more verbose information to the traces |
otel.endpointAddress | string | Set the Open Telemetry (OTEL) target hostname and optionally port. If this is used, you do not need to specify the ‘zipkin’ section. |
otel.isSecure | bool | Is the connection to the endpoint address encrypted. |
otel.protocol | string | Set to http or grpc protocol. |
zipkin.endpointAddress | string | Set the Zipkin server URL. If this is used, you do not need to specify the otel section. |
To enable tracing, use a configuration file (in self hosted mode) or a Kubernetes configuration object (in Kubernetes mode). For example, the following configuration object changes the sample rate to 1 (every span is sampled), and sends trace using OTEL protocol to the OTEL server at localhost:4317
apiVersion: dapr.io/v1alpha1
kind: Configuration
metadata:
  name: tracing
spec:
  tracing:
    samplingRate: "1"
    otel:
      endpointAddress: "localhost:4317"
      isSecure: false
      protocol: grpc
Sampling rate
Dapr uses probabilistic sampling. The sample rate defines the probability a tracing span will be sampled and can have a value between 0 and 1 (inclusive). The default sample rate is 0.0001 (i.e. 1 in 10,000 spans is sampled).
Changing samplingRate to 0 disables tracing altogether.
Environment variables
The OpenTelemetry (otel) endpoint can also be configured via an environment variables. The presence of the OTEL_EXPORTER_OTLP_ENDPOINT environment variable turns on tracing for the sidecar.
| Environment Variable | Description |
|---|---|
OTEL_EXPORTER_OTLP_ENDPOINT | Sets the Open Telemetry (OTEL) server hostname and optionally port, turns on tracing |
OTEL_EXPORTER_OTLP_INSECURE | Sets the connection to the endpoint as unencrypted (true/false) |
OTEL_EXPORTER_OTLP_PROTOCOL | Transport protocol (grpc, http/protobuf, http/json) |
Next steps
Learn how to set up tracing with one of the following tools:
4 - Open Telemetry Collector
4.1 - Using OpenTelemetry Collector to collect traces
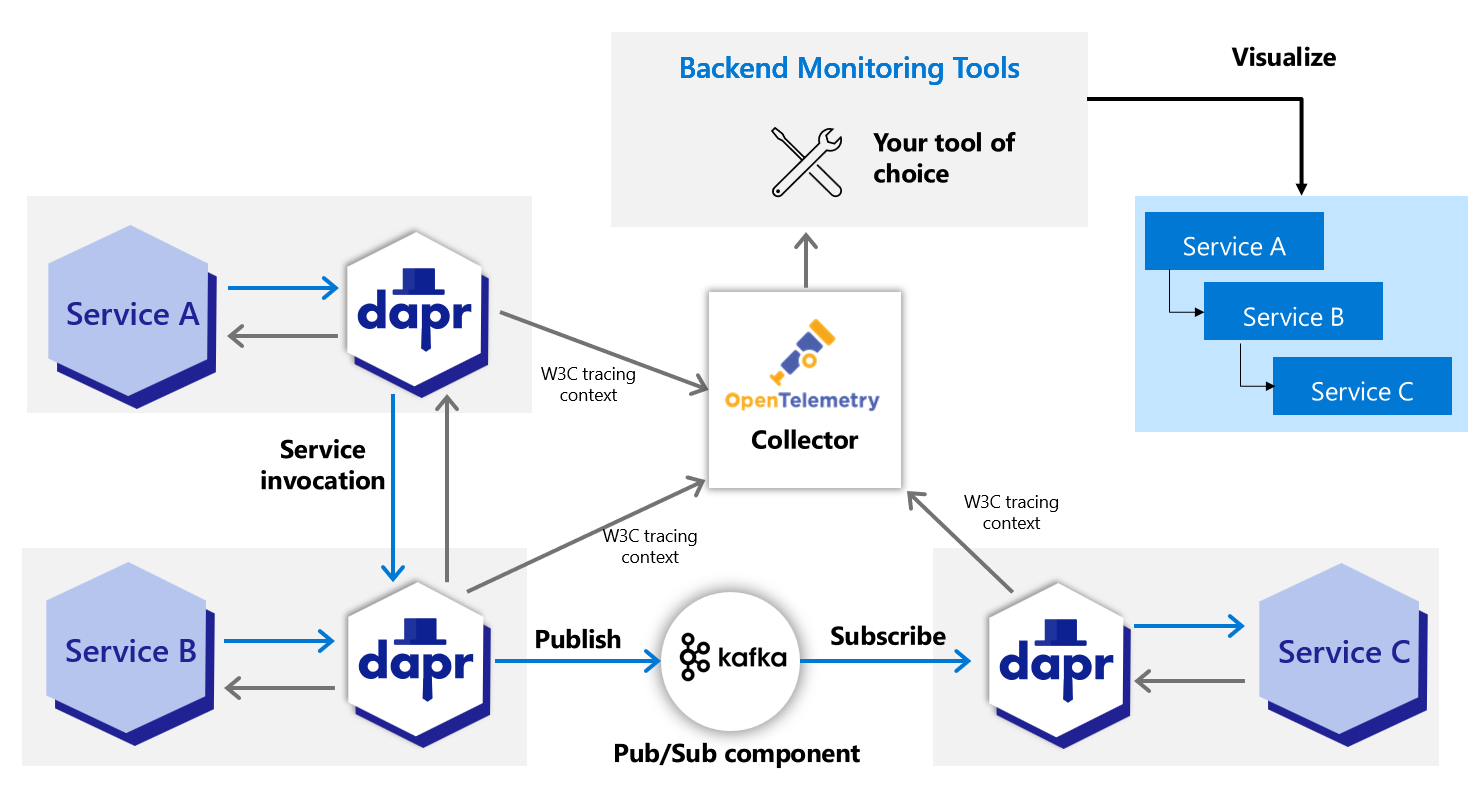
Dapr directly writes traces using the OpenTelemetry (OTLP) protocol as the recommended method. For observability tools that support the OTLP directly, it is recommended to use the OpenTelemetry Collector, as it allows your application to quickly offload data and includes features, such as retries, batching, and encryption. For more information, read the Open Telemetry Collector documentation.
Dapr can also write traces using the Zipkin protocol. Prior to supporting the OTLP protocol, the Zipkin protocol was used with the OpenTelemetry Collector to send traces to observability tools such as AWS X-Ray, Google Cloud Operations Suite, and Azure Monitor. Both protocol approaches are valid, however the OpenTelemetry protocol is the recommended choice.
Prerequisites
- Install Dapr on Kubernetes
- Verify your trace backends are already set up to receive traces
- Review your OTEL Collector exporter’s required parameters:
Set up OTEL Collector to push to your trace backend
Check out the
open-telemetry-collector-generic.yaml.Replace the
<your-exporter-here>section with the correct settings for your trace exporter.- Refer to the OTEL Collector links in the prerequisites section to determine the correct settings.
Apply the configuration with:
kubectl apply -f open-telemetry-collector-generic.yaml
Set up Dapr to send traces to OTEL Collector
Set up a Dapr configuration file to turn on tracing and deploy a tracing exporter component that uses the OpenTelemetry Collector.
Use this
collector-config.yamlfile to create your own configuration.Apply the configuration with:
kubectl apply -f collector-config.yaml
Deploy your app with tracing
Apply the appconfig configuration by adding a dapr.io/config annotation to the container that you want to participate in the distributed tracing, as shown in the following example:
apiVersion: apps/v1
kind: Deployment
metadata:
  ...
spec:
  ...
  template:
    metadata:
      ...
      annotations:
        dapr.io/enabled: "true"
        dapr.io/app-id: "MyApp"
        dapr.io/app-port: "8080"
        dapr.io/config: "appconfig"
Note
If you are using one of the Dapr tutorials, such as distributed calculator, theappconfig configuration is already configured, so no additional settings are needed.You can register multiple tracing exporters at the same time, and the tracing logs are forwarded to all registered exporters.
That’s it! There’s no need to include any SDKs or instrument your application code. Dapr automatically handles the distributed tracing for you.
View traces
Deploy and run some applications. Wait for the trace to propagate to your tracing backend and view them there.
Related links
- Try out the observability quickstart
- Learn how to set tracing configuration options
4.2 - Using Dynatrace OpenTelemetry Collector to collect traces to send to Dynatrace
Dapr integrates with the Dynatrace Collector using the OpenTelemetry protocol (OTLP). This guide walks through an example using Dapr to push traces to Dynatrace, using the Dynatrace version of the OpenTelemetry Collector.
Note
This guide refers to the Dynatrace OpenTelemetry Collector, which uses the same Helm chart as the open-source collector but overridden with the Dynatrace-maintained image for better support and Dynatrace-specific features.Prerequisites
- Install Dapr on Kubernetes
- Access to a Dynatrace tenant and an API token with
openTelemetryTrace.ingest,metrics.ingest, andlogs.ingestscopes - Helm
Set up Dynatrace OpenTelemetry Collector to push to your Dynatrace instance
To push traces to your Dynatrace instance, install the Dynatrace OpenTelemetry Collector on your Kubernetes cluster.
Create a Kubernetes secret with your Dynatrace credentials:
kubectl create secret generic dynatrace-otelcol-dt-api-credentials \
  --from-literal=DT_ENDPOINT=https://YOUR_TENANT.live.dynatrace.com/api/v2/otlp \
  --from-literal=DT_API_TOKEN=dt0s01.YOUR_TOKEN_HERE
Replace
YOUR_TENANTwith your Dynatrace tenant ID andYOUR_TOKEN_HEREwith your Dynatrace API token.Use the Dynatrace OpenTelemetry Collector distribution for better defaults and support than the open source version. Download and inspect the
collector-helm-values.yamlfile. This is based on the k8s enrichment demo and includes Kubernetes metadata enrichment for proper pod/namespace/cluster context.Deploy the Dynatrace Collector with Helm.
helm repo add open-telemetry https://open-telemetry.github.io/opentelemetry-helm-charts
helm repo update
helm upgrade -i dynatrace-collector open-telemetry/opentelemetry-collector -f collector-helm-values.yaml
Set up Dapr to send traces to the Dynatrace Collector
Create a Dapr configuration file to enable tracing and send traces to the OpenTelemetry Collector via OTLP.
Update the following file to ensure the
endpointAddresspoints to your Dynatrace OpenTelemetry Collector service in your Kubernetes cluster. If deployed in thedefaultnamespace, it’s typicallydynatrace-collector.default.svc.cluster.local.Important: Ensure the
endpointAddressdoes NOT include thehttp://prefix to avoid URL encoding issues:apiVersion: dapr.io/v1alpha1 kind: Configuration metadata: name: tracing spec: tracing: samplingRate: "1" otel: endpointAddress: "dynatrace-collector.default.svc.cluster.local:4318" # Update with your collector's service addressApply the configuration with:
kubectl apply -f collector-config-otel.yaml
Deploy your app with tracing
Apply the tracing configuration by adding a dapr.io/config annotation to the Dapr applications that you want to include in distributed tracing, as shown in the following example:
apiVersion: apps/v1
kind: Deployment
metadata:
  ...
spec:
  ...
  template:
    metadata:
      ...
      annotations:
        dapr.io/enabled: "true"
        dapr.io/app-id: "MyApp"
        dapr.io/app-port: "8080"
        dapr.io/config: "tracing"
Note
If you are using one of the Dapr tutorials, such as distributed calculator, you will need to update theappconfig configuration to tracing.You can register multiple tracing exporters at the same time, and the tracing logs are forwarded to all registered exporters.
That’s it! There’s no need to include any SDKs or instrument your application code. Dapr automatically handles the distributed tracing for you.
View traces
Deploy and run some applications. After a few minutes, you should see traces appearing in your Dynatrace tenant:
- Navigate to Search > Distributed tracing in your Dynatrace UI.
- Filter by service names to see your Dapr applications and their associated tracing spans.
Note
Only operations going through Dapr API exposed by Dapr sidecar (for example, service invocation or event publishing) are displayed in Dynatrace distributed traces.Disable OneAgent daprd monitoring
If you are running Dynatrace OneAgent in your cluster, you should exclude the daprd sidecar container from OneAgent monitoring to prevent interferences in this configuration. Excluding it prevents any automatic injection attempts that could break functionality or result in confusing traces.
Add this annotation to your application deployments or globally in your dynakube configuration file:
metadata:
  annotations:
    dapr.io/enabled: "true"
    dapr.io/app-id: "MyApp"
    dapr.io/app-port: "8080"
    dapr.io/config: "tracing"
    container.inject.dynatrace.com/daprd: "false" # Exclude dapr sidecar from being auto-monitored by OneAgent
Related links
- Try out the observability quickstart
- Learn how to set tracing configuration options
- Dynatrace OpenTelemetry documentation
- Enrich OTLP telemetry data with Kubernetes metadata
4.3 - Using OpenTelemetry Collector to collect traces to send to App Insights
Dapr integrates with OpenTelemetry (OTEL) Collector using the OpenTelemetry protocol (OTLP). This guide walks through an example using Dapr to push traces to Azure Application Insights, using the OpenTelemetry Collector.
Prerequisites
- Install Dapr on Kubernetes
- Create an Application Insights resource and make note of your Application Insights connection string.
Set up OTEL Collector to push to your App Insights instance
To push traces to your Application Insights instance, install the OpenTelemetry Collector on your Kubernetes cluster.
Download and inspect the
open-telemetry-collector-appinsights.yamlfile.Replace the
<CONNECTION_STRING>placeholder with your App Insights connection string.Deploy the OpenTelemetry Collector into the same namespace where your Dapr-enabled applications are running:
kubectl apply -f open-telemetry-collector-appinsights.yaml
Set up Dapr to send traces to the OpenTelemetry Collector
Create a Dapr configuration file to enable tracing and send traces to the OpenTelemetry Collector via OTLP.
Download and inspect the
collector-config-otel.yaml. Update thenamespaceandotel.endpointAddressvalues to align with the namespace where your Dapr-enabled applications and OpenTelemetry Collector are deployed.Apply the configuration with:
kubectl apply -f collector-config-otel.yaml
Deploy your app with tracing
Apply the tracing configuration by adding a dapr.io/config annotation to the Dapr applications that you want to include in distributed tracing, as shown in the following example:
apiVersion: apps/v1
kind: Deployment
metadata:
  ...
spec:
  ...
  template:
    metadata:
      ...
      annotations:
        dapr.io/enabled: "true"
        dapr.io/app-id: "MyApp"
        dapr.io/app-port: "8080"
        dapr.io/config: "tracing"
Note
If you are using one of the Dapr tutorials, such as distributed calculator, you will need to update theappconfig configuration to tracing.You can register multiple tracing exporters at the same time, and the tracing logs are forwarded to all registered exporters.
That’s it! There’s no need to include any SDKs or instrument your application code. Dapr automatically handles the distributed tracing for you.
View traces
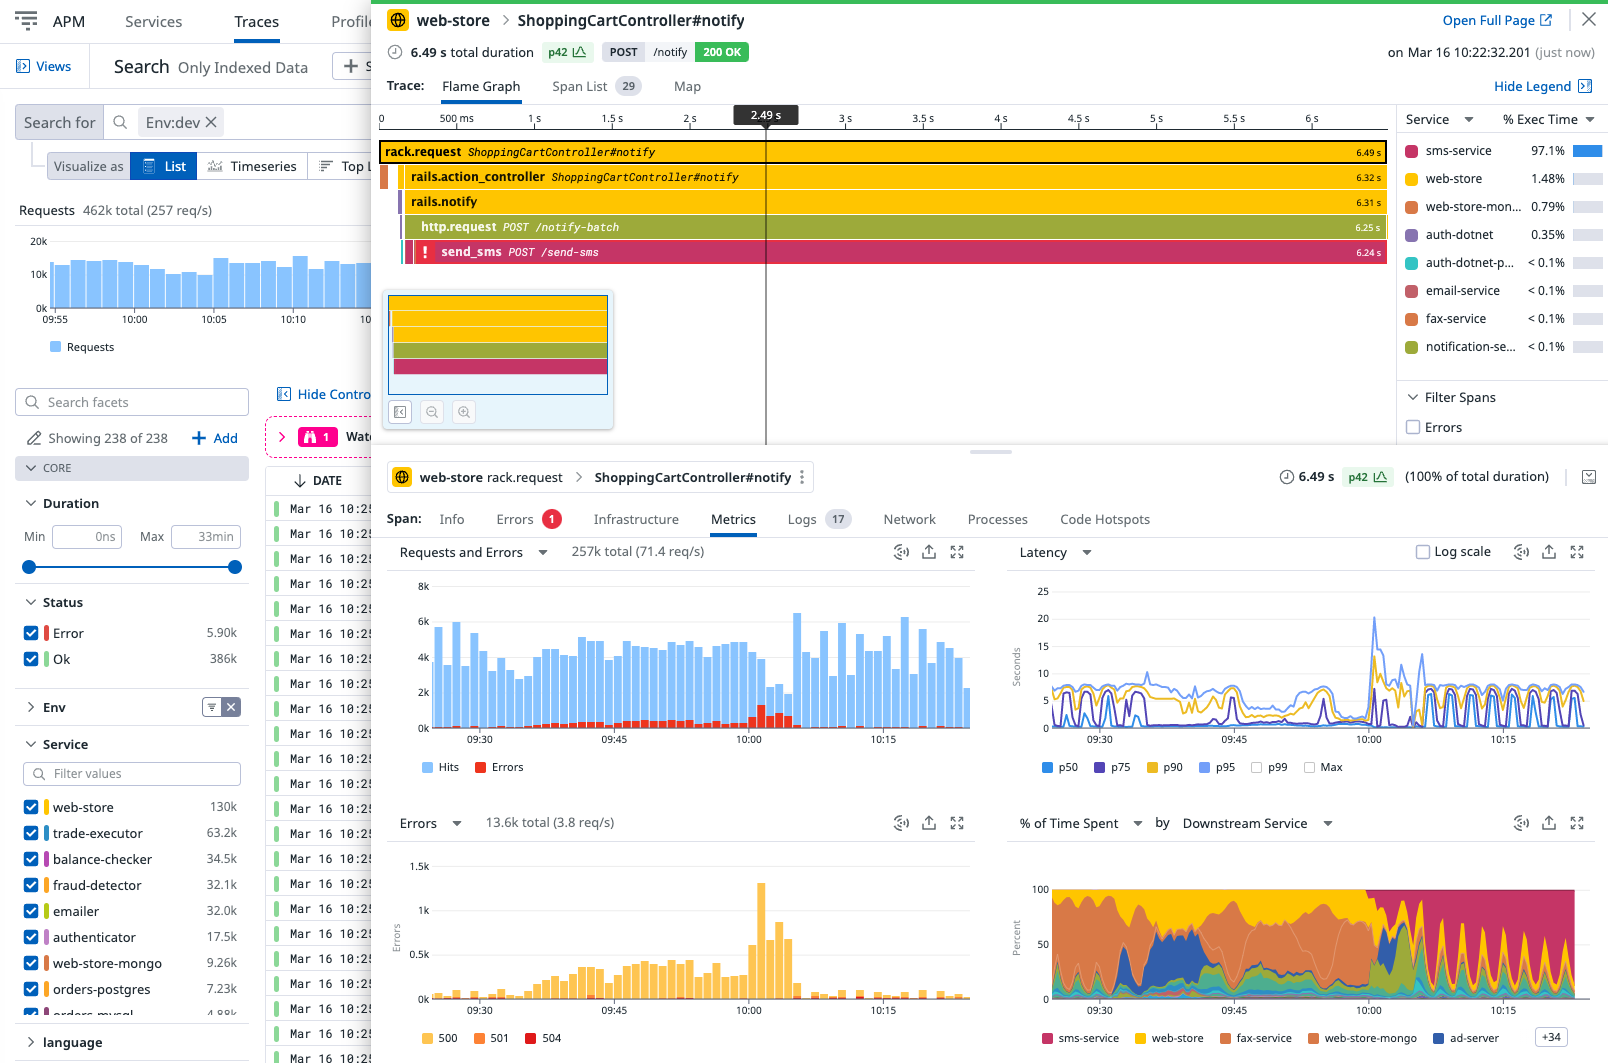
Deploy and run some applications. After a few minutes, you should see tracing logs appearing in your App Insights resource. You can also use the Application Map to examine the topology of your services, as shown below:
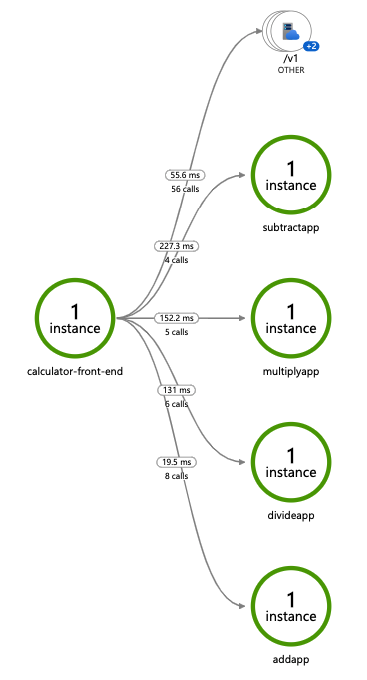
Note
Only operations going through Dapr API exposed by Dapr sidecar (for example, service invocation or event publishing) are displayed in Application Map topology.Related links
- Try out the observability quickstart
- Learn how to set tracing configuration options
4.4 - Using OpenTelemetry Collector to collect traces to send to Jaeger
While Dapr supports writing traces using OpenTelemetry (OTLP) and Zipkin protocols, Zipkin support for Jaeger has been deprecated in favor of OTLP. Although Jaeger supports OTLP directly, the recommended approach for production is to use the OpenTelemetry Collector to collect traces from Dapr and send them to Jaeger, allowing your application to quickly offload data and take advantage of features like retries, batching, and encryption. For more information, read the Open Telemetry Collector documentation.
Configure Jaeger in self-hosted mode
Local setup
The simplest way to start Jaeger is to run the pre-built, all-in-one Jaeger image published to DockerHub and expose the OTLP port:
docker run -d --name jaeger \
  -p 4317:4317  \
  -p 16686:16686 \
  jaegertracing/all-in-one:1.49
Next, create the following config.yaml file locally:
Note: Because you are using the Open Telemetry protocol to talk to Jaeger, you need to fill out the
otelsection of the tracing configuration and set theendpointAddressto the address of the Jaeger container.
apiVersion: dapr.io/v1alpha1
kind: Configuration
metadata:
  name: tracing
  namespace: default
spec:
  tracing:
    samplingRate: "1"
    stdout: true
    otel:
      endpointAddress: "localhost:4317"
      isSecure: false
      protocol: grpc
To launch the application referring to the new YAML configuration file, use
the --config option. For example:
dapr run --app-id myapp --app-port 3000 node app.js --config config.yaml
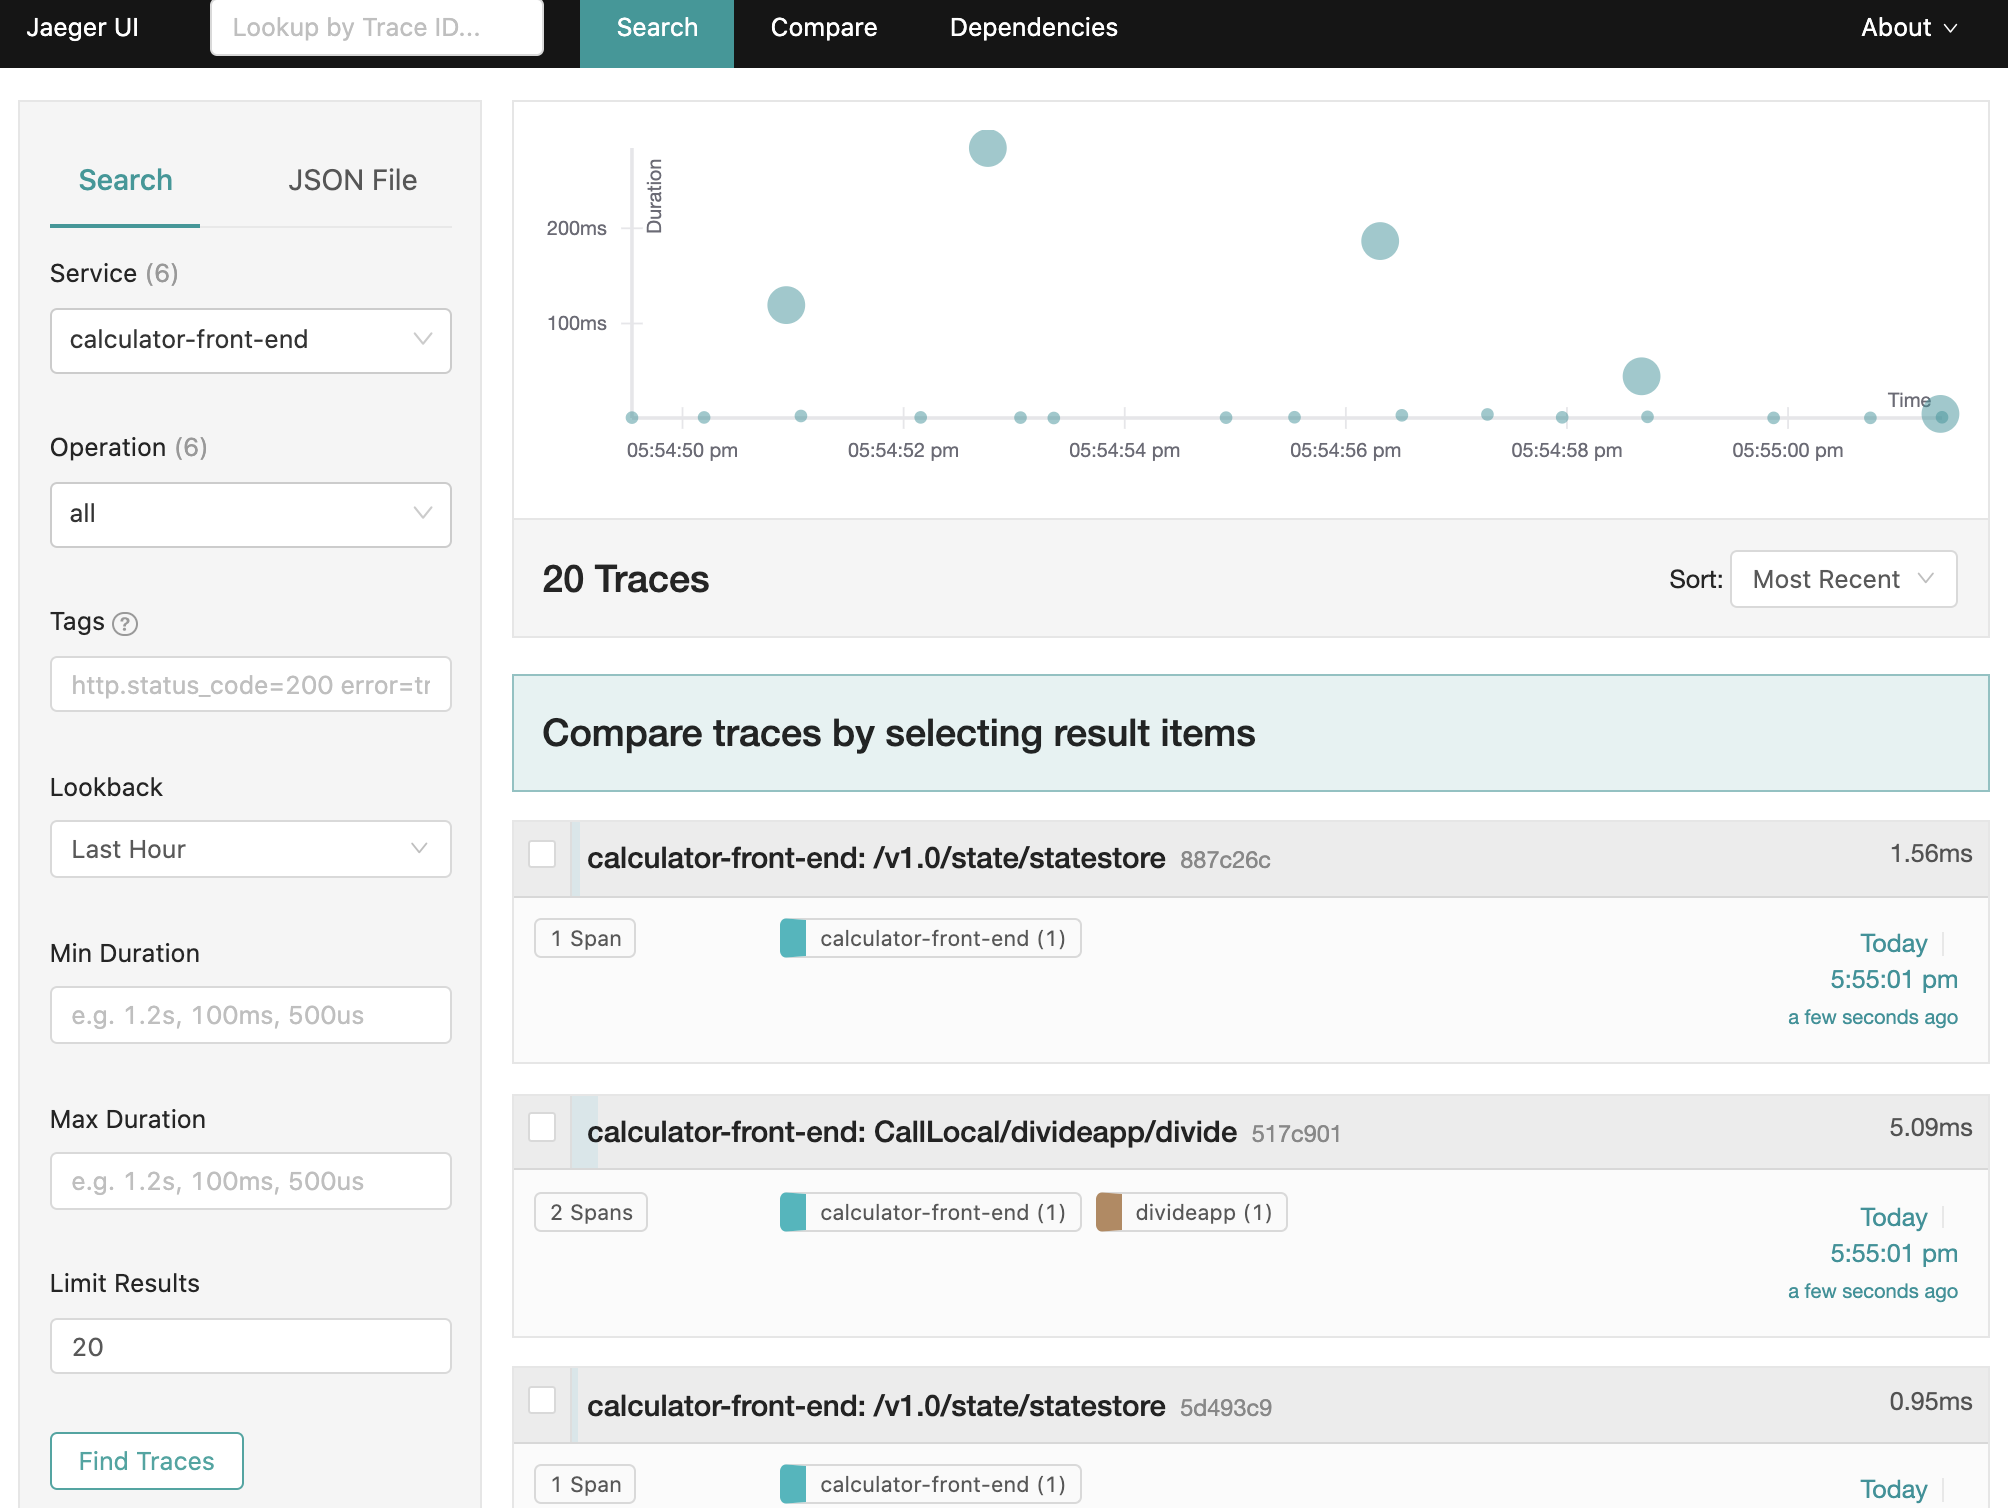
View traces
To view traces in your browser, go to http://localhost:16686 to see the Jaeger UI.
Configure Jaeger on Kubernetes with the OpenTelemetry Collector
The following steps show you how to configure Dapr to send distributed tracing data to the OpenTelemetry Collector which, in turn, sends the traces to Jaeger.
Prerequisites
- Install Dapr on Kubernetes
- Set up Jaeger using the Jaeger Kubernetes Operator
Set up OpenTelemetry Collector to push to Jaeger
To push traces to your Jaeger instance, install the OpenTelemetry Collector on your Kubernetes cluster.
Download and inspect the
open-telemetry-collector-jaeger.yamlfile.In the data section of the
otel-collector-confConfigMap, update theotlp/jaeger.endpointvalue to reflect the endpoint of your Jaeger collector Kubernetes service object.Deploy the OpenTelemetry Collector into the same namespace where your Dapr-enabled applications are running:
kubectl apply -f open-telemetry-collector-jaeger.yaml
Set up Dapr to send traces to OpenTelemetryCollector
Create a Dapr configuration file to enable tracing and export the sidecar traces to the OpenTelemetry Collector.
Use the
collector-config-otel.yamlfile to create your own Dapr configuration.Update the
namespaceandotel.endpointAddressvalues to align with the namespace where your Dapr-enabled applications and OpenTelemetry Collector are deployed.Apply the configuration with:
kubectl apply -f collector-config.yaml
Deploy your app with tracing enabled
Apply the tracing Dapr configuration by adding a dapr.io/config annotation to the application deployment that you want to enable distributed tracing for, as shown in the following example:
apiVersion: apps/v1
kind: Deployment
metadata:
  ...
spec:
  ...
  template:
    metadata:
      ...
      annotations:
        dapr.io/enabled: "true"
        dapr.io/app-id: "MyApp"
        dapr.io/app-port: "8080"
        dapr.io/config: "tracing"
You can register multiple tracing exporters at the same time, and the tracing logs are forwarded to all registered exporters.
That’s it! There’s no need to include the OpenTelemetry SDK or instrument your application code. Dapr automatically handles the distributed tracing for you.
View traces
To view Dapr sidecar traces, port-forward the Jaeger Service and open the UI:
kubectl port-forward svc/jaeger-query 16686 -n observability
In your browser, go to http://localhost:16686 and you will see the Jaeger UI.
References
5 - How-To: Set-up New Relic for distributed tracing
Prerequisites
- Perpetually free New Relic account, 100 GB/month of free data ingest, 1 free full access user, unlimited free basic users
Configure Dapr tracing
Dapr natively captures metrics and traces that can be send directly to New Relic. The easiest way to export these is by configuring Dapr to send the traces to New Relic’s Trace API using the Zipkin trace format.
In order for the integration to send data to New Relic Telemetry Data Platform, you need a New Relic Insights Insert API key.
apiVersion: dapr.io/v1alpha1
kind: Configuration
metadata:
  name: appconfig
  namespace: default
spec:
  tracing:
    samplingRate: "1"
    zipkin:
      endpointAddress: "https://trace-api.newrelic.com/trace/v1?Api-Key=<NR-INSIGHTS-INSERT-API-KEY>&Data-Format=zipkin&Data-Format-Version=2"
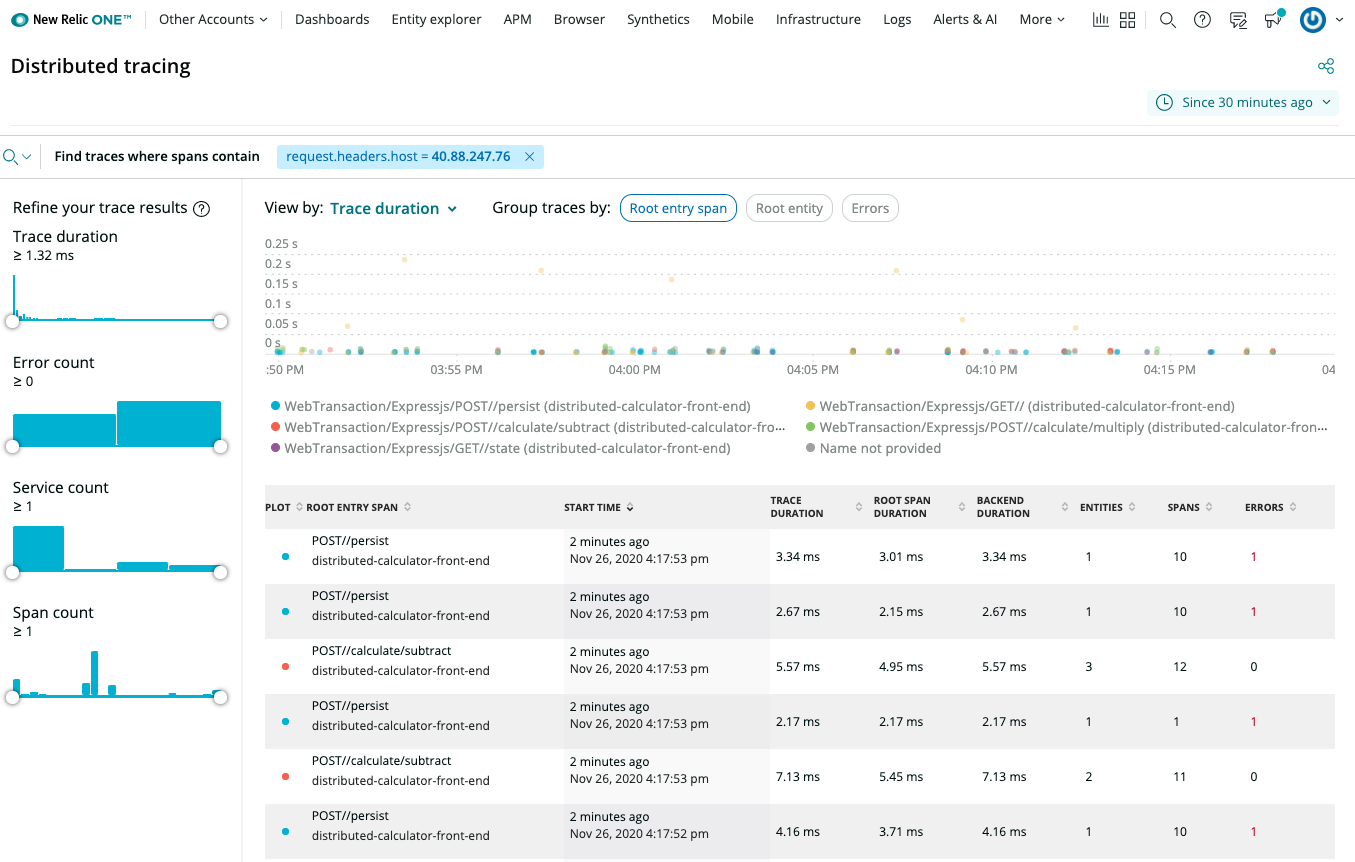
Viewing Traces
New Relic Distributed Tracing overview
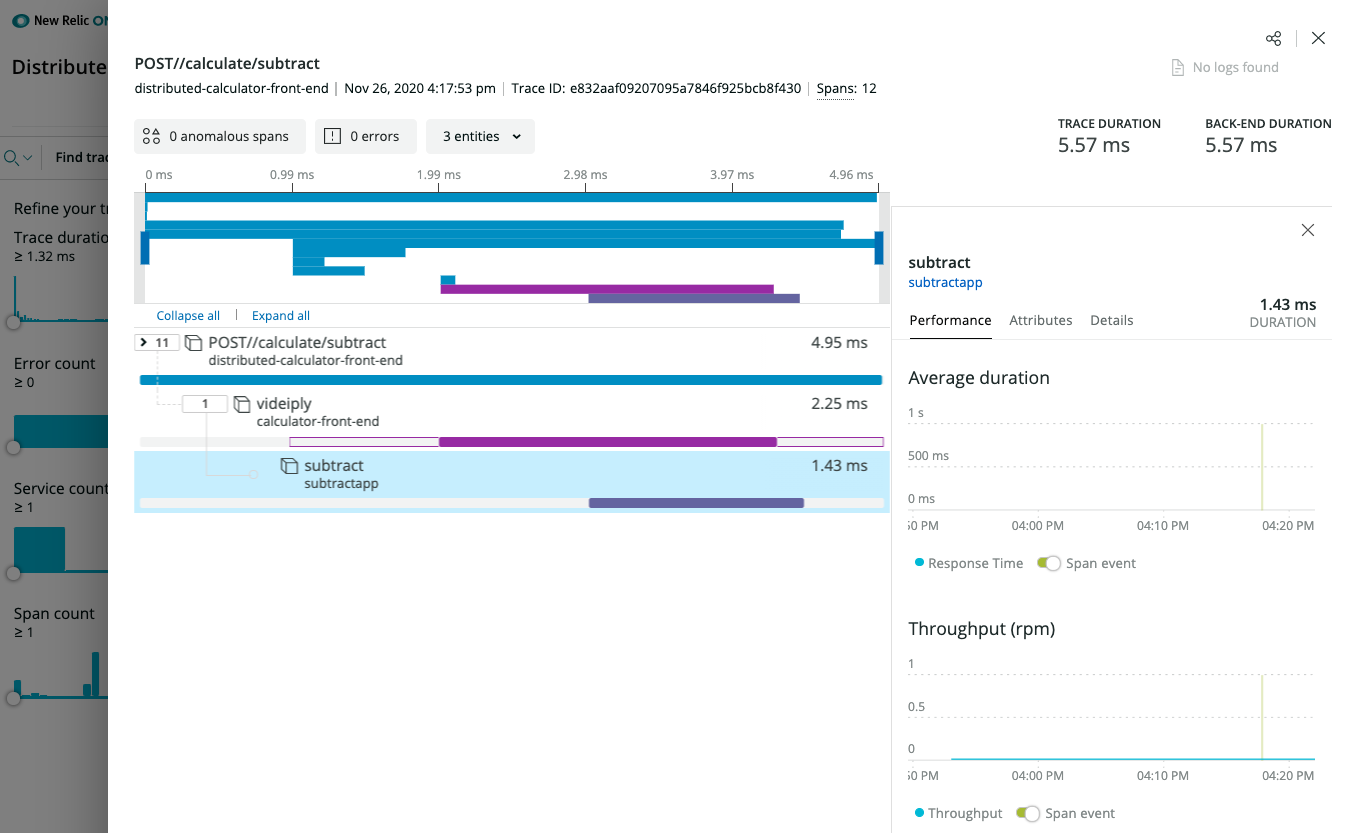
New Relic Distributed Tracing details
(optional) New Relic Instrumentation
In order for the integrations to send data to New Relic Telemetry Data Platform, you either need a New Relic license key or New Relic Insights Insert API key.
OpenTelemetry instrumentation
Leverage the different language specific OpenTelemetry implementations, for example New Relic Telemetry SDK and OpenTelemetry support for .NET. In this case, use the OpenTelemetry Trace Exporter. See example here.
New Relic Language agent
Similarly to the OpenTelemetry instrumentation, you can also leverage a New Relic language agent. As an example, the New Relic agent instrumentation for .NET Core is part of the Dockerfile. See example here.
(optional) Enable New Relic Kubernetes integration
In case Dapr and your applications run in the context of a Kubernetes environment, you can enable additional metrics and logs.
The easiest way to install the New Relic Kubernetes integration is to use the automated installer to generate a manifest. It bundles not just the integration DaemonSets, but also other New Relic Kubernetes configurations, like Kubernetes events, Prometheus OpenMetrics, and New Relic log monitoring.
New Relic Kubernetes Cluster Explorer
The New Relic Kubernetes Cluster Explorer provides a unique visualization of the entire data and deployments of the data collected by the Kubernetes integration.
It is a good starting point to observe all your data and dig deeper into any performance issues or incidents happening inside of the application or microservices.
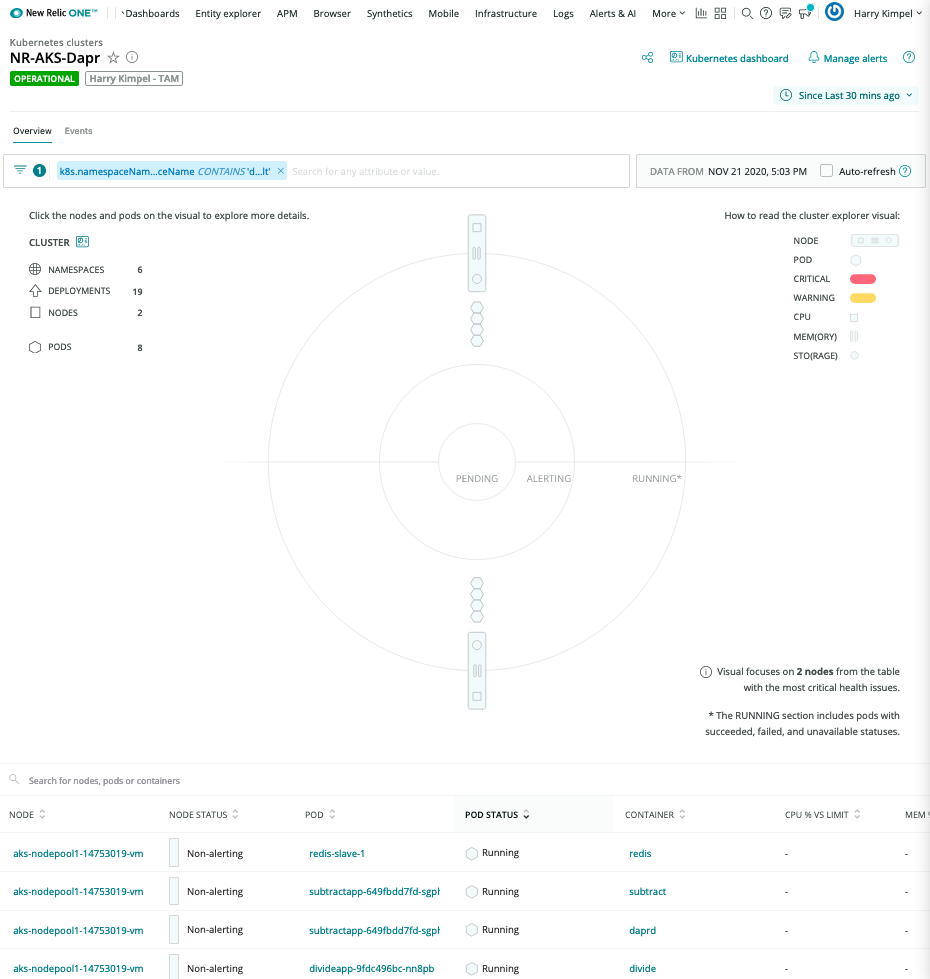
Automated correlation is part of the visualization capabilities of New Relic.
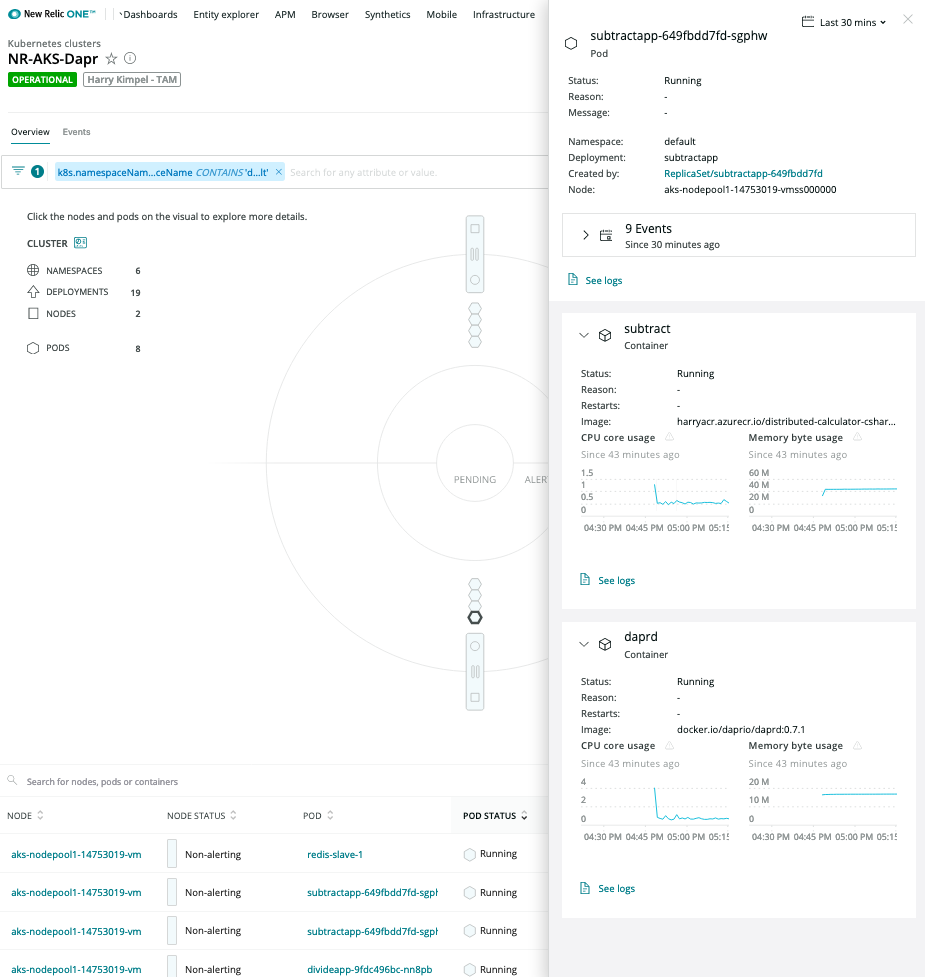
Pod-level details
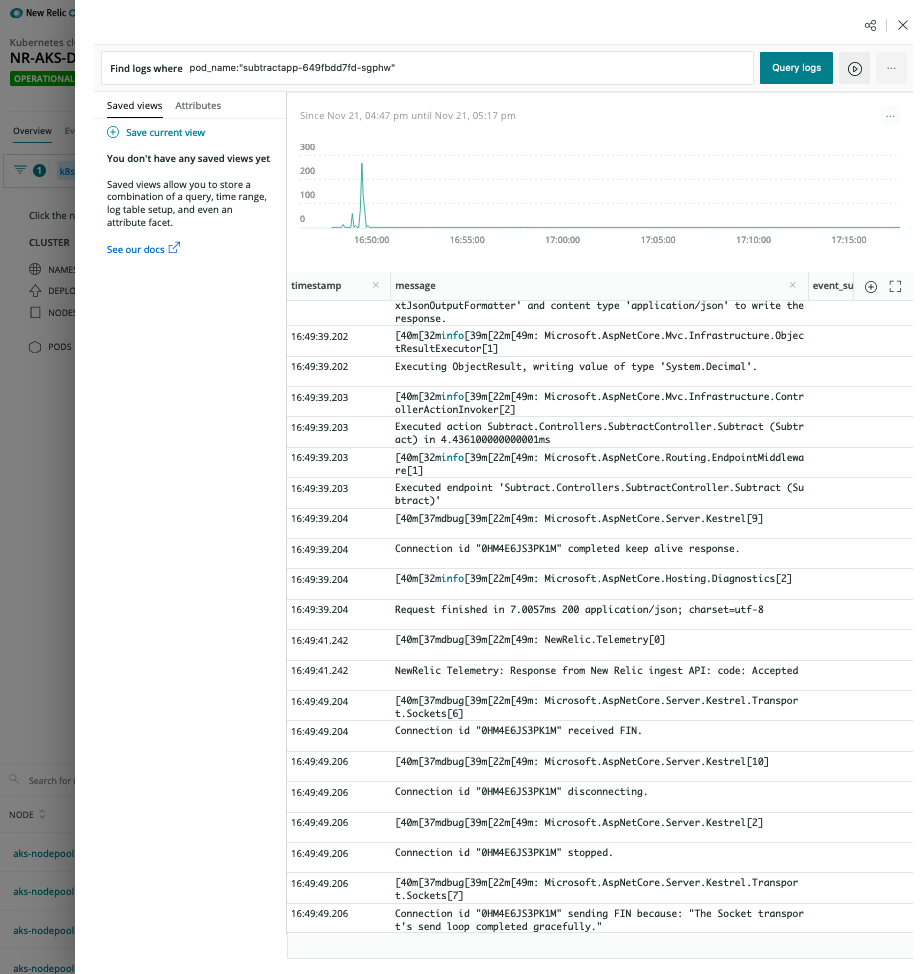
Logs in Context
New Relic Dashboards
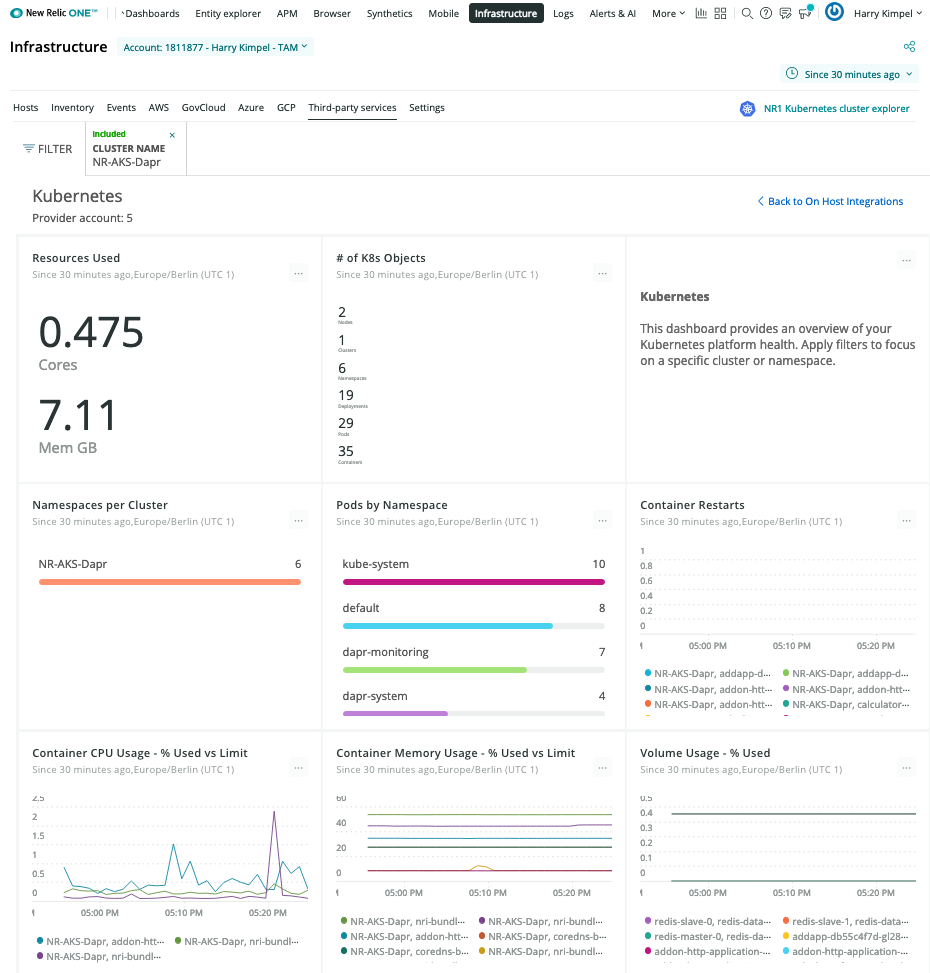
Kubernetes Overview
Dapr System Services
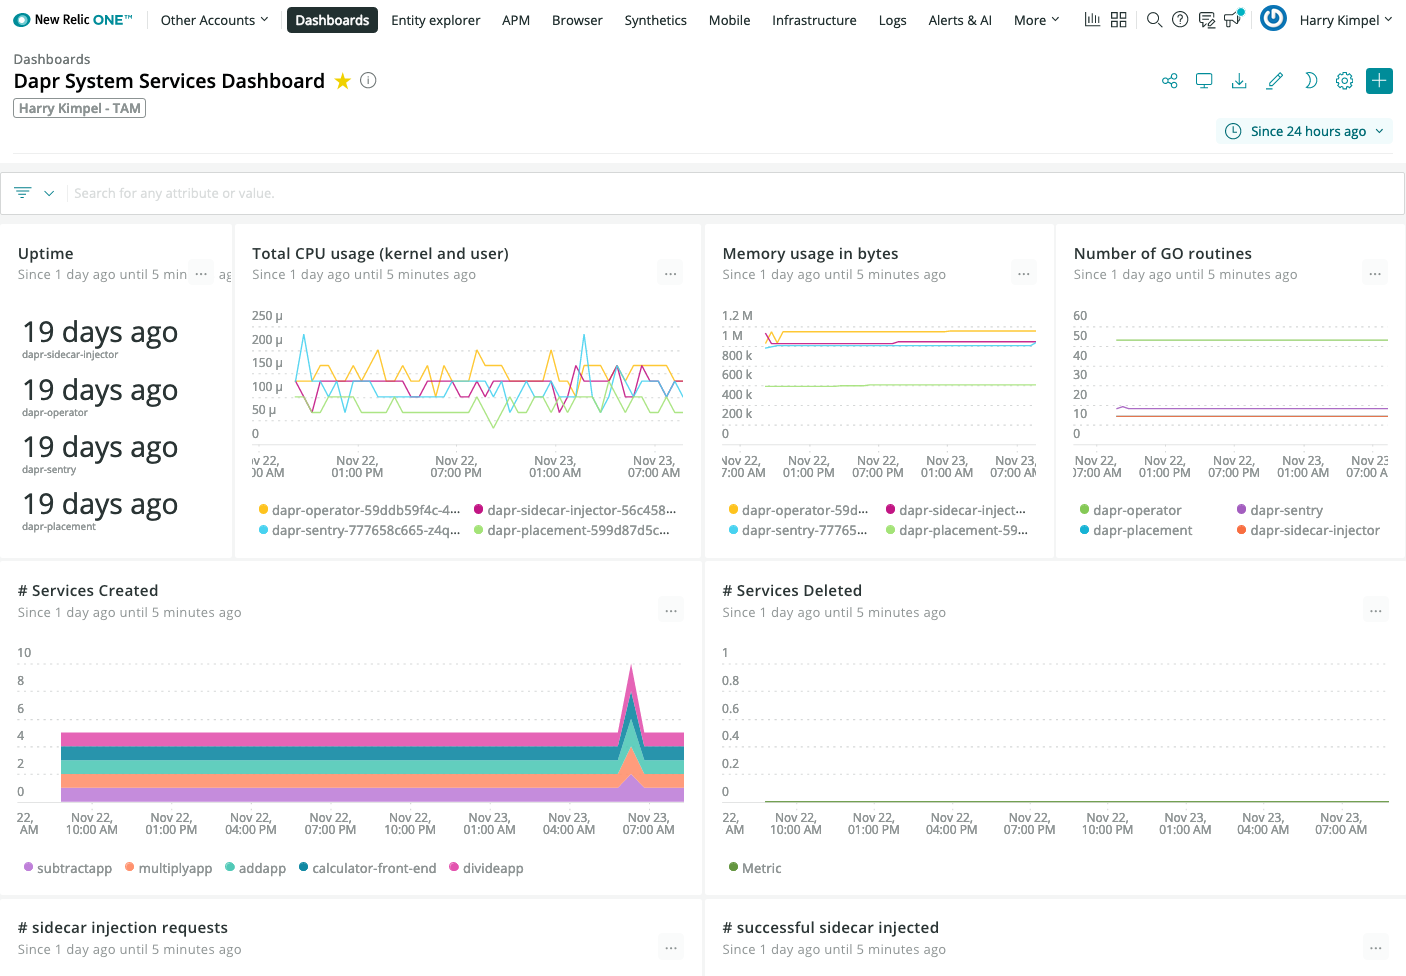
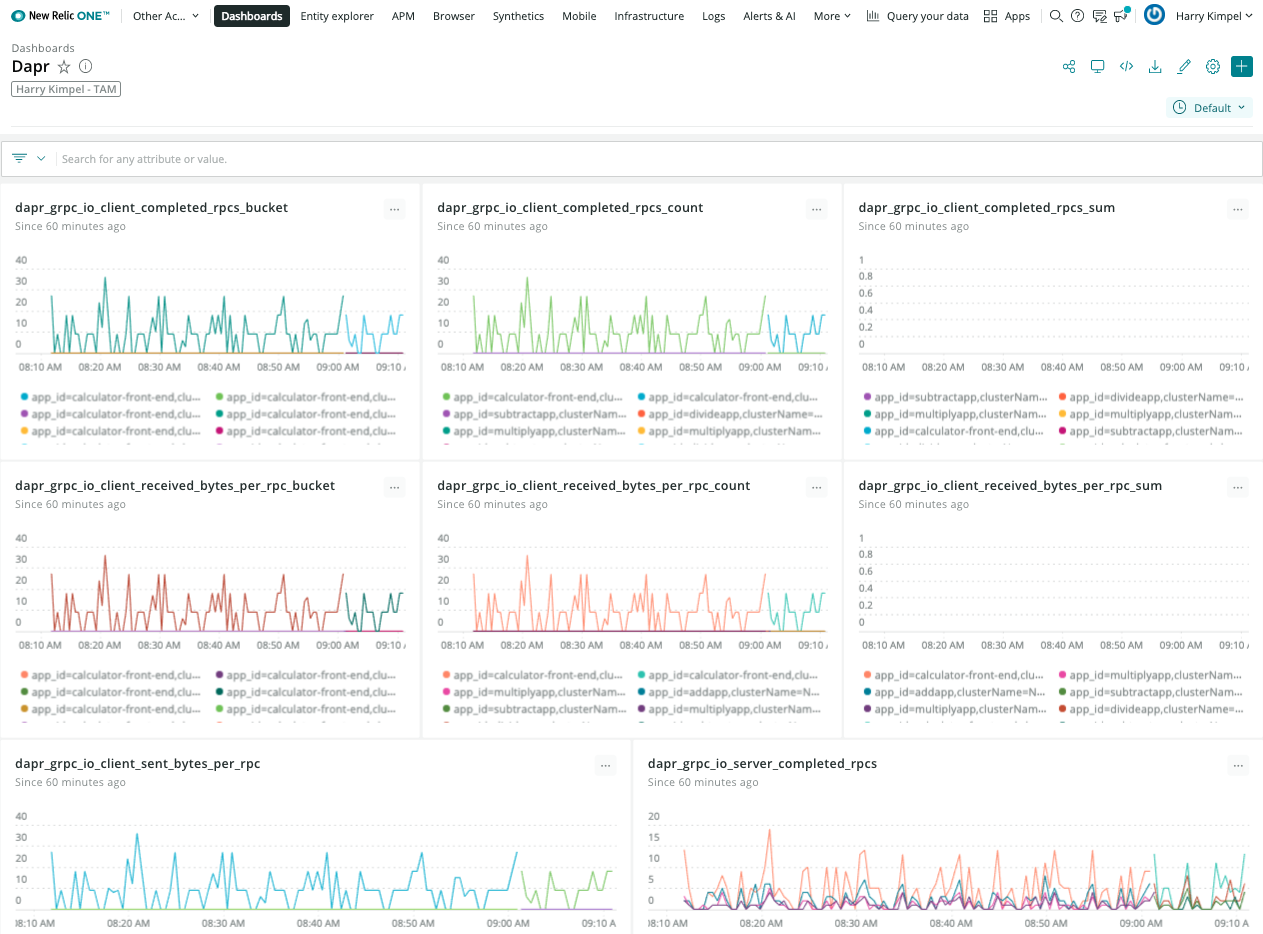
Dapr Metrics
New Relic Grafana integration
New Relic teamed up with Grafana Labs so you can use the Telemetry Data Platform as a data source for Prometheus metrics and see them in your existing dashboards, seamlessly tapping into the reliability, scale, and security provided by New Relic.
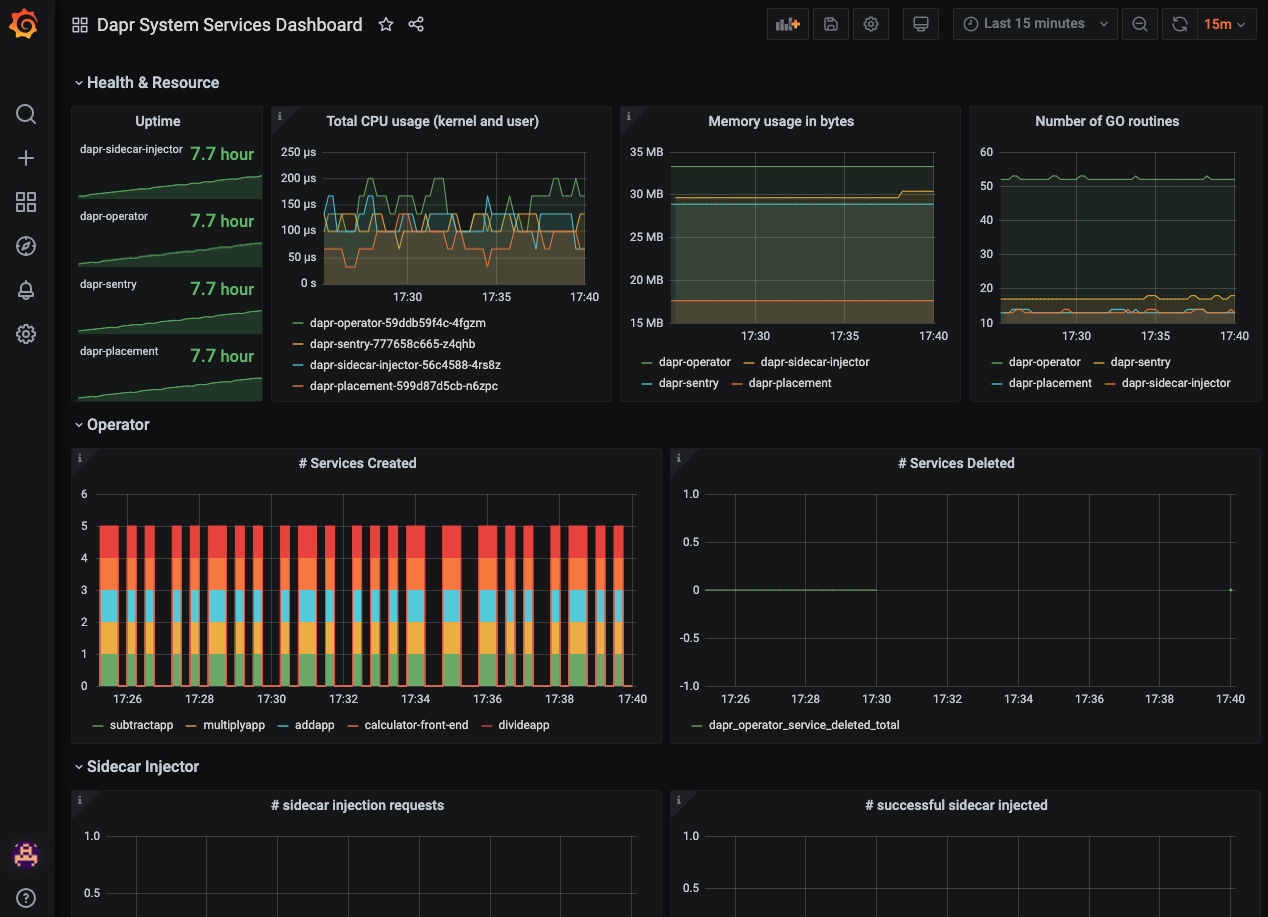
Grafana dashboard templates to monitor Dapr system services and sidecars can easily be used without any changes. New Relic provides a native endpoint for Prometheus metrics into Grafana. A datasource can easily be set-up:
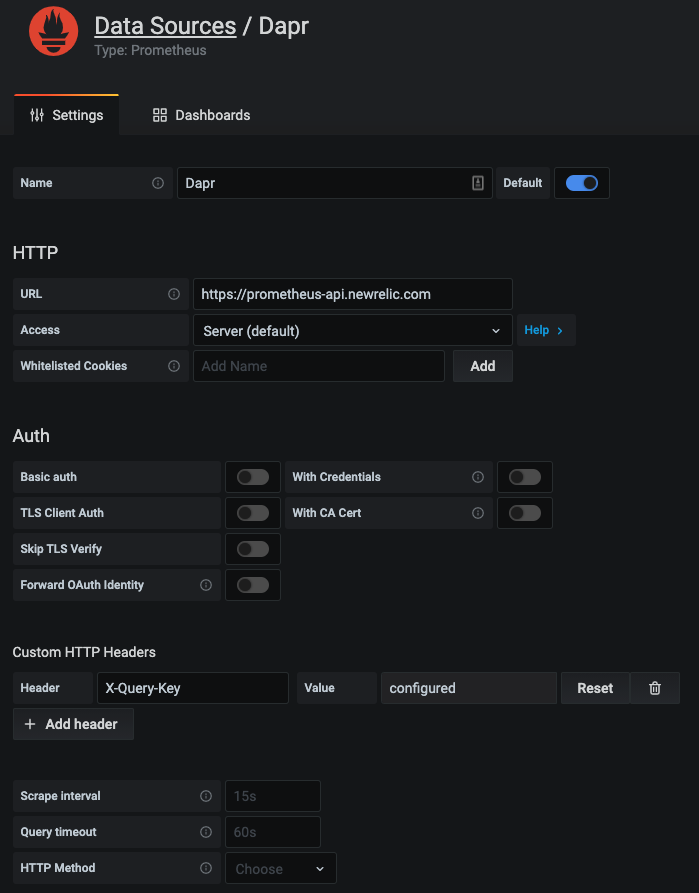
And the exact same dashboard templates from Dapr can be imported to visualize Dapr system services and sidecars.
New Relic Alerts
All the data that is collected from Dapr, Kubernetes or any services that run on top of can be used to set-up alerts and notifications into the preferred channel of your choice. See Alerts and Applied Intelligence.
Related Links/References
6 - How-To: Set up Zipkin for distributed tracing
Configure self hosted mode
For self hosted mode, on running dapr init:
- The following YAML file is created by default in
$HOME/.dapr/config.yaml(on Linux/Mac) or%USERPROFILE%\.dapr\config.yaml(on Windows) and it is referenced by default ondapr runcalls unless otherwise overridden `:
- config.yaml
apiVersion: dapr.io/v1alpha1
kind: Configuration
metadata:
  name: daprConfig
  namespace: default
spec:
  tracing:
    samplingRate: "1"
    zipkin:
      endpointAddress: "http://localhost:9411/api/v2/spans"
- The openzipkin/zipkin docker container is launched on running
dapr initor it can be launched with the following code.
Launch Zipkin using Docker:
docker run -d -p 9411:9411 openzipkin/zipkin
- The applications launched with
dapr runby default reference the config file in$HOME/.dapr/config.yamlor%USERPROFILE%\.dapr\config.yamland can be overridden with the Dapr CLI using the--configparam:
dapr run --app-id mynode --app-port 3000 node app.js
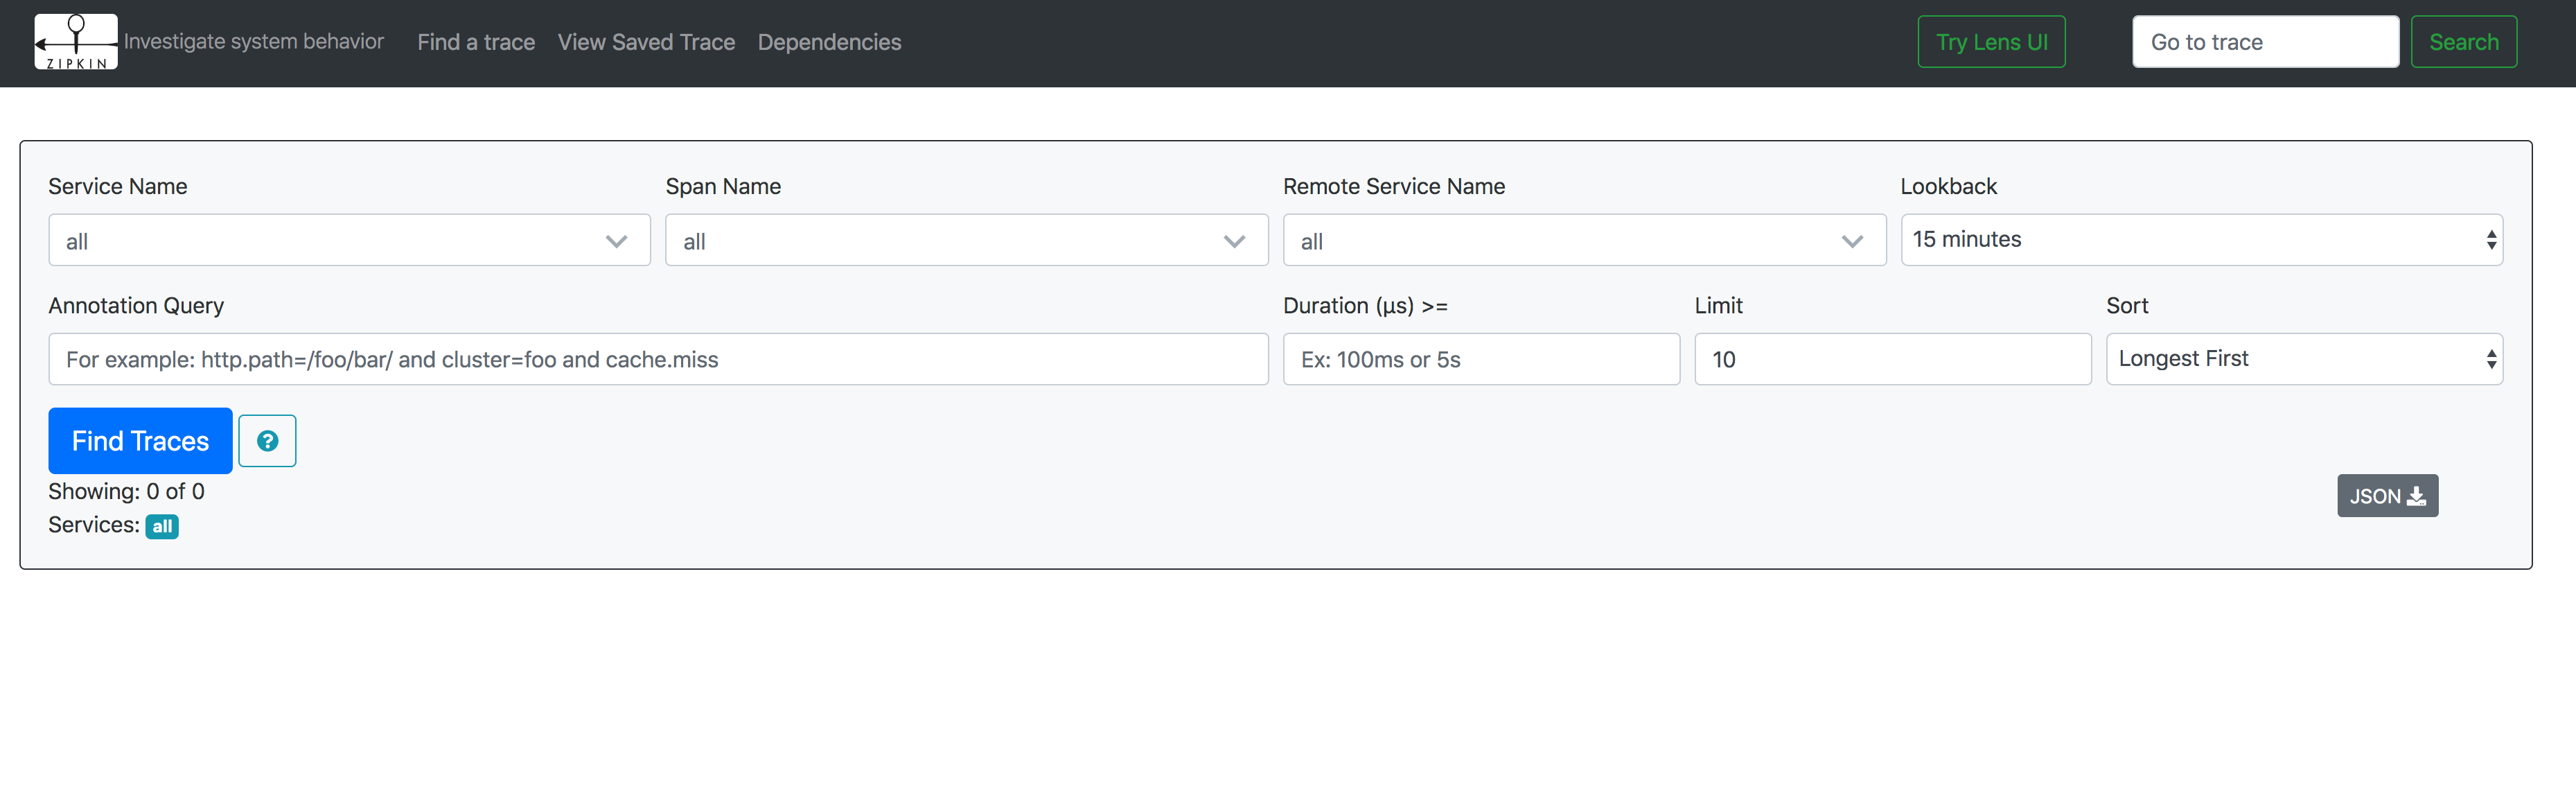
Viewing Traces
To view traces, in your browser go to http://localhost:9411 and you will see the Zipkin UI.
Configure Kubernetes
The following steps shows you how to configure Dapr to send distributed tracing data to Zipkin running as a container in your Kubernetes cluster, and how to view them.
Setup
First, deploy Zipkin:
kubectl create deployment zipkin --image openzipkin/zipkin
Create a Kubernetes service for the Zipkin pod:
kubectl expose deployment zipkin --type ClusterIP --port 9411
Next, create the following YAML file locally:
- tracing.yaml configuration
apiVersion: dapr.io/v1alpha1
kind: Configuration
metadata:
  name: tracing
  namespace: default
spec:
  tracing:
    samplingRate: "1"
    zipkin:
      endpointAddress: "http://zipkin.default.svc.cluster.local:9411/api/v2/spans"
Now, deploy the the Dapr configuration file:
kubectl apply -f tracing.yaml
In order to enable this configuration for your Dapr sidecar, add the following annotation to your pod spec template:
annotations:
  dapr.io/config: "tracing"
That’s it! Your sidecar is now configured to send traces to Zipkin.
Viewing Tracing Data
To view traces, connect to the Zipkin service and open the UI:
kubectl port-forward svc/zipkin 9411:9411
In your browser, go to http://localhost:9411 and you will see the Zipkin UI.
References
7 - How-To: Set up Dash0 for distributed tracing
Dapr captures metrics, traces, and logs that can be sent directly to Dash0 through the OpenTelemetry Collector. Dash0 is an OpenTelemetry-native observability platform that provides comprehensive monitoring capabilities for distributed applications.
Configure Dapr tracing with the OpenTelemetry Collector and Dash0
By using the OpenTelemetry Collector with the OTLP exporter to send data to Dash0, you can configure Dapr to create traces for each application in your Kubernetes cluster and collect them in Dash0 for analysis and monitoring.
Prerequisites
- A running Kubernetes cluster with
kubectlinstalled - Helm v3+
- Dapr installed in the cluster
- A Dash0 account (Get started with a 14-day free trial)
- Your Dash0 Auth Token and OTLP/gRPC endpoint (find both under Settings → Auth Tokens and Settings → Endpoints)
Configure the OpenTelemetry Collector
- Create a namespace for the Collector
kubectl create namespace opentelemetry
- Create a Secret with your Dash0 Auth Token and Endpoint
kubectl create secret generic dash0-secrets \
  --from-literal=dash0-authorization-token="<your_auth_token>" \
  --from-literal=dash0-endpoint="<your_otlp_grpc_endpoint>" \
  --namespace opentelemetry
- Add the OpenTelemetry Helm repo (once)
helm repo add open-telemetry https://open-telemetry.github.io/opentelemetry-helm-charts
helm repo update
- Create
values.yamlfor the Collector
This config:
- Reads token + endpoint from the Secret via env vars
- Enables OTLP receivers (gRPC + HTTP)
- Sends traces, metrics, and logs to Dash0 via OTLP/gRPC with Bearer auth
mode: deployment
fullnameOverride: otel-collector
replicaCount: 1

image:
  repository: otel/opentelemetry-collector-k8s

extraEnvs:
  - name: DASH0_AUTHORIZATION_TOKEN
    valueFrom:
      secretKeyRef:
        name: dash0-secrets
        key: dash0-authorization-token
  - name: DASH0_ENDPOINT
    valueFrom:
      secretKeyRef:
        name: dash0-secrets
        key: dash0-endpoint

config:
  receivers:
    otlp:
      protocols:
        grpc: {}
        http: {}

  processors:
    batch: {}

  exporters:
    otlp/dash0:
      auth:
        authenticator: bearertokenauth/dash0
      endpoint: ${env:DASH0_ENDPOINT}

  extensions:
    bearertokenauth/dash0:
      scheme: Bearer
      token: ${env:DASH0_AUTHORIZATION_TOKEN}
    health_check: {}

  service:
    extensions:
      - bearertokenauth/dash0
      - health_check
    pipelines:
      traces:
        receivers: [otlp]
        processors: [batch]
        exporters: [otlp/dash0]
      metrics:
        receivers: [otlp]
        processors: [batch]
        exporters: [otlp/dash0]
      logs:
        receivers: [otlp]
        processors: [batch]
        exporters: [otlp/dash0]
- Install/upgrade the Collector with Helm
helm upgrade --install otel-collector open-telemetry/opentelemetry-collector \
  --namespace opentelemetry \
  -f values.yaml
Configure Dapr to send telemetry to the Collector
- Create a configuration
Create dapr-config.yaml:
apiVersion: dapr.io/v1alpha1
kind: Configuration
metadata:
  name: tracing
  namespace: default
spec:
  tracing:
    samplingRate: "1"
    otel:
      endpointAddress: "otel-collector.opentelemetry.svc.cluster.local:4317"
      isSecure: false
      protocol: grpc
Apply it:
kubectl apply -f dapr-config.yaml
- Annotate your application(s)
In each Deployment/Pod you want traced by Dapr, add:
metadata:
  annotations:
    dapr.io/config: "tracing"
Verify the setup
- Check that the OpenTelemetry Collector is running:
kubectl get pods -n opentelemetry
- Check the collector logs to ensure it’s receiving and forwarding telemetry:
kubectl logs -n opentelemetry deployment/otel-collector
- Deploy a sample application with Dapr tracing enabled and generate some traffic to verify traces are being sent to Dash0. You can use the Dapr Kubernetes quickstart tutorial for testing.
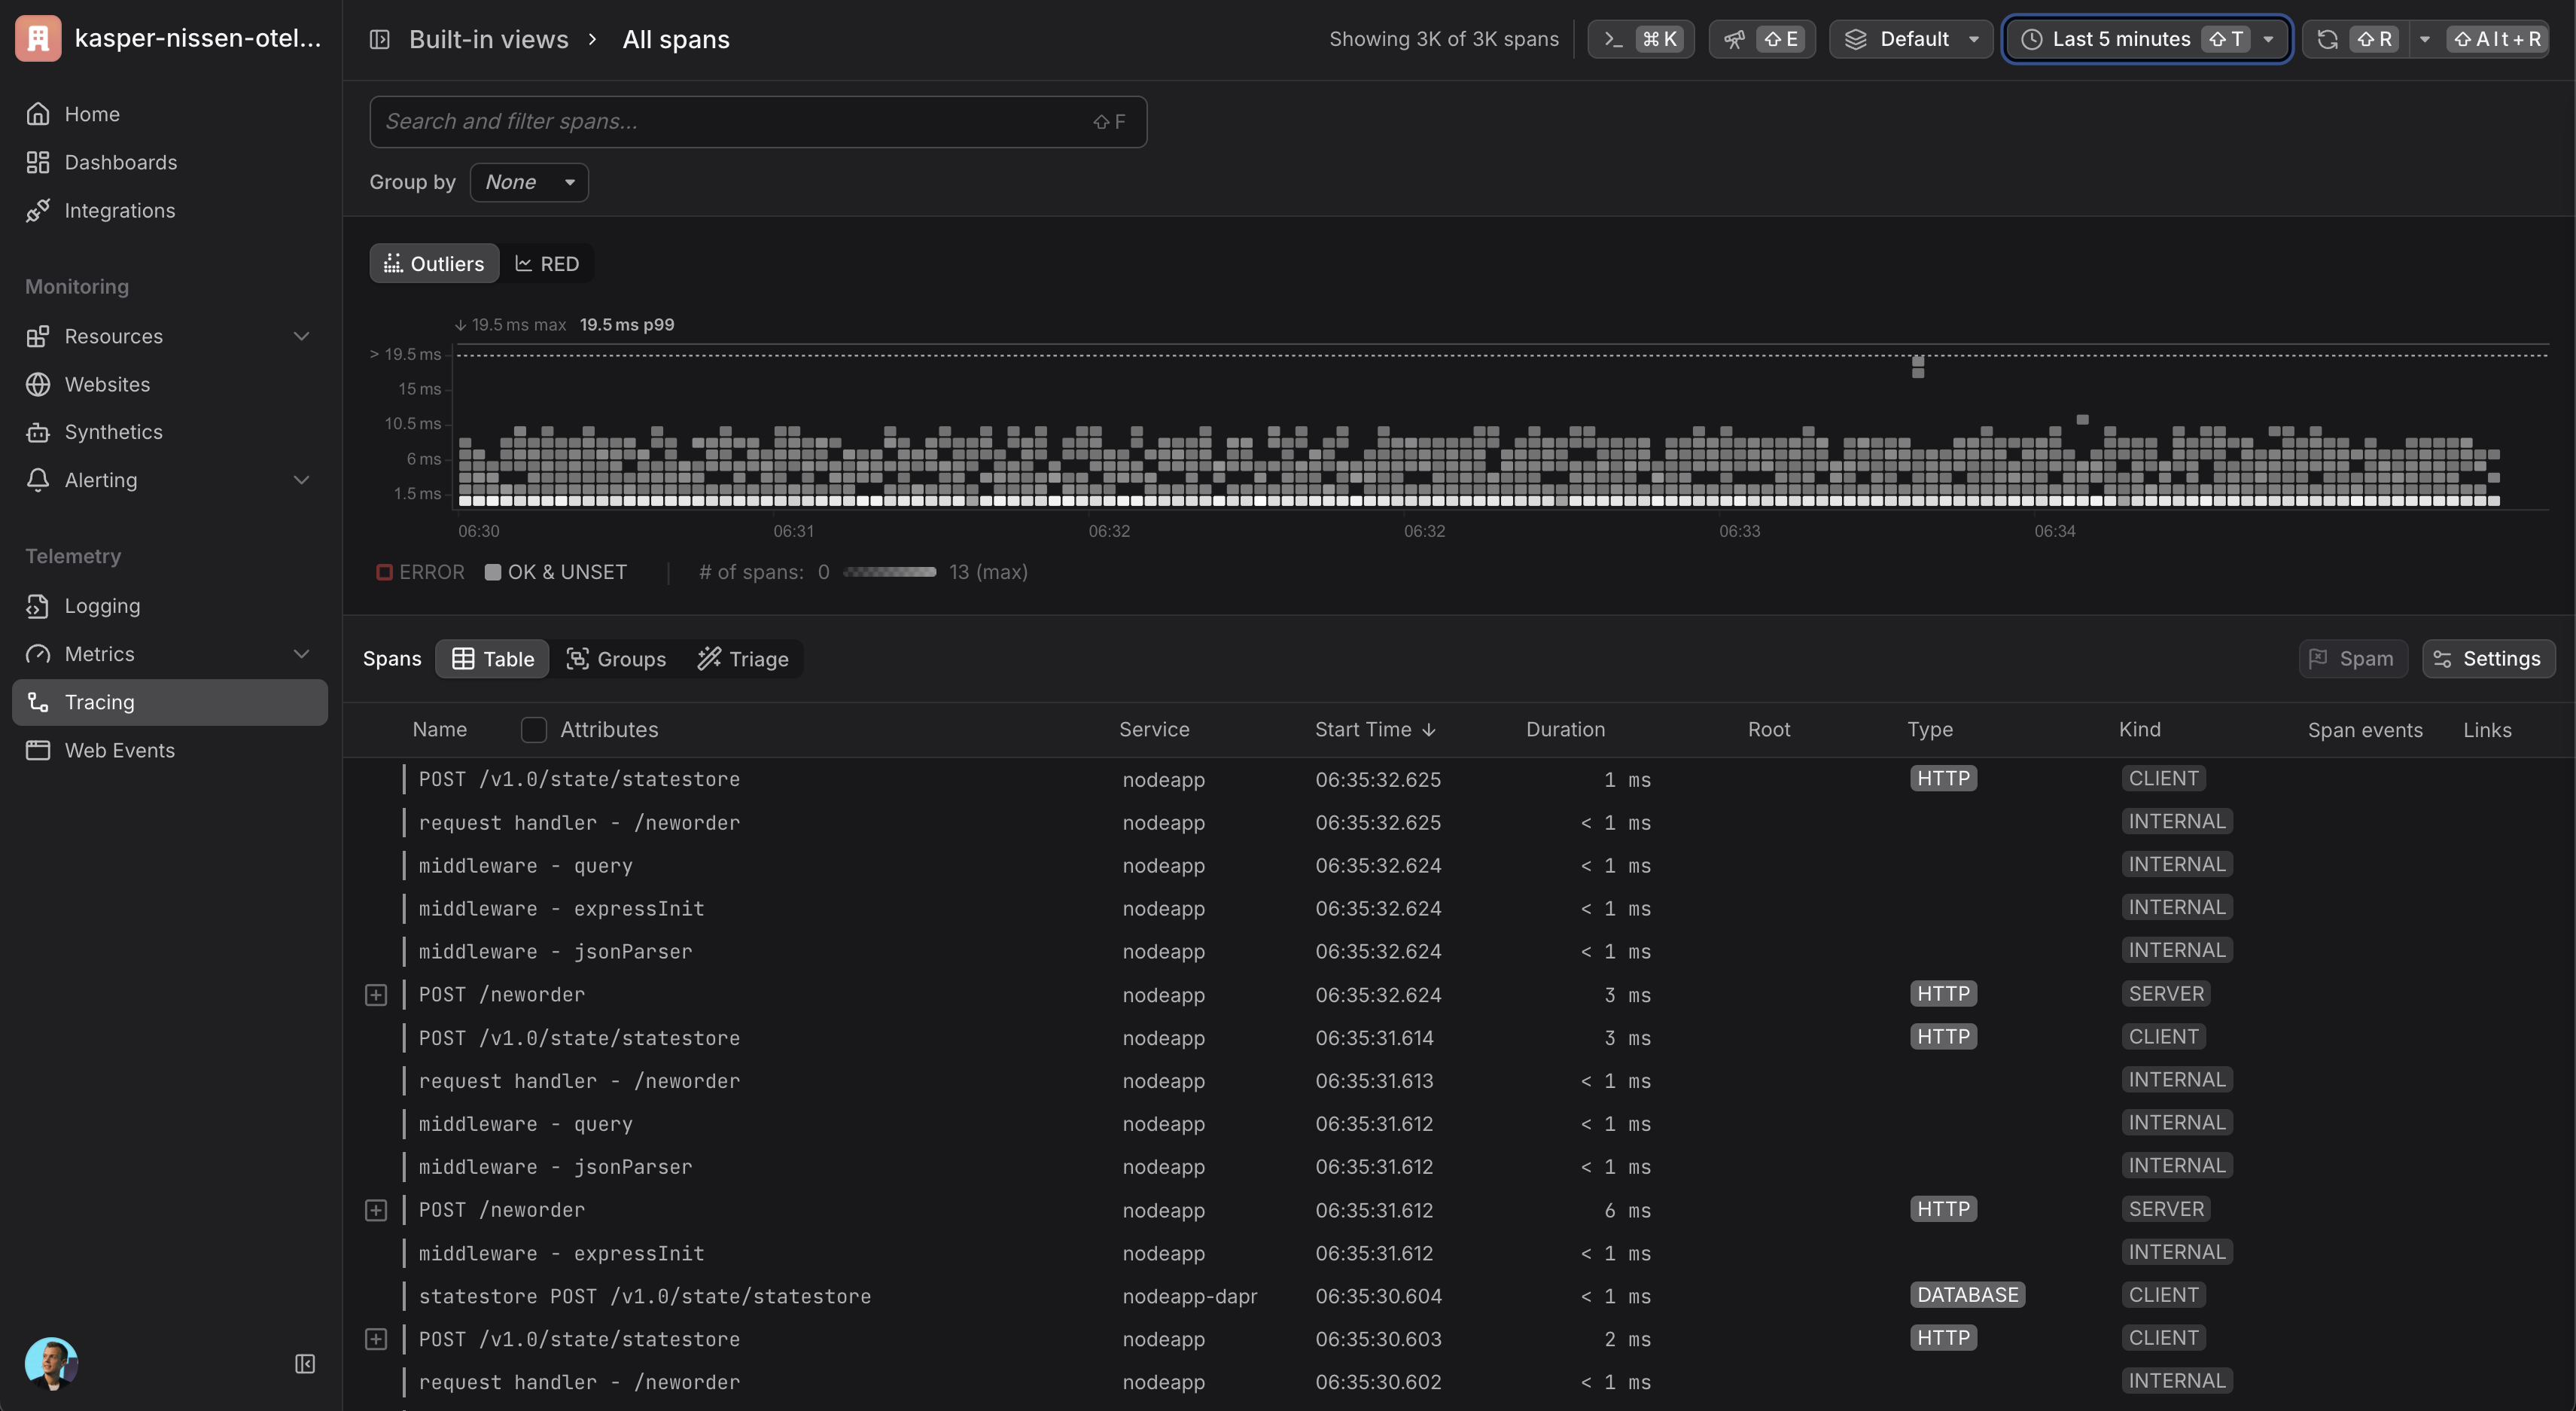
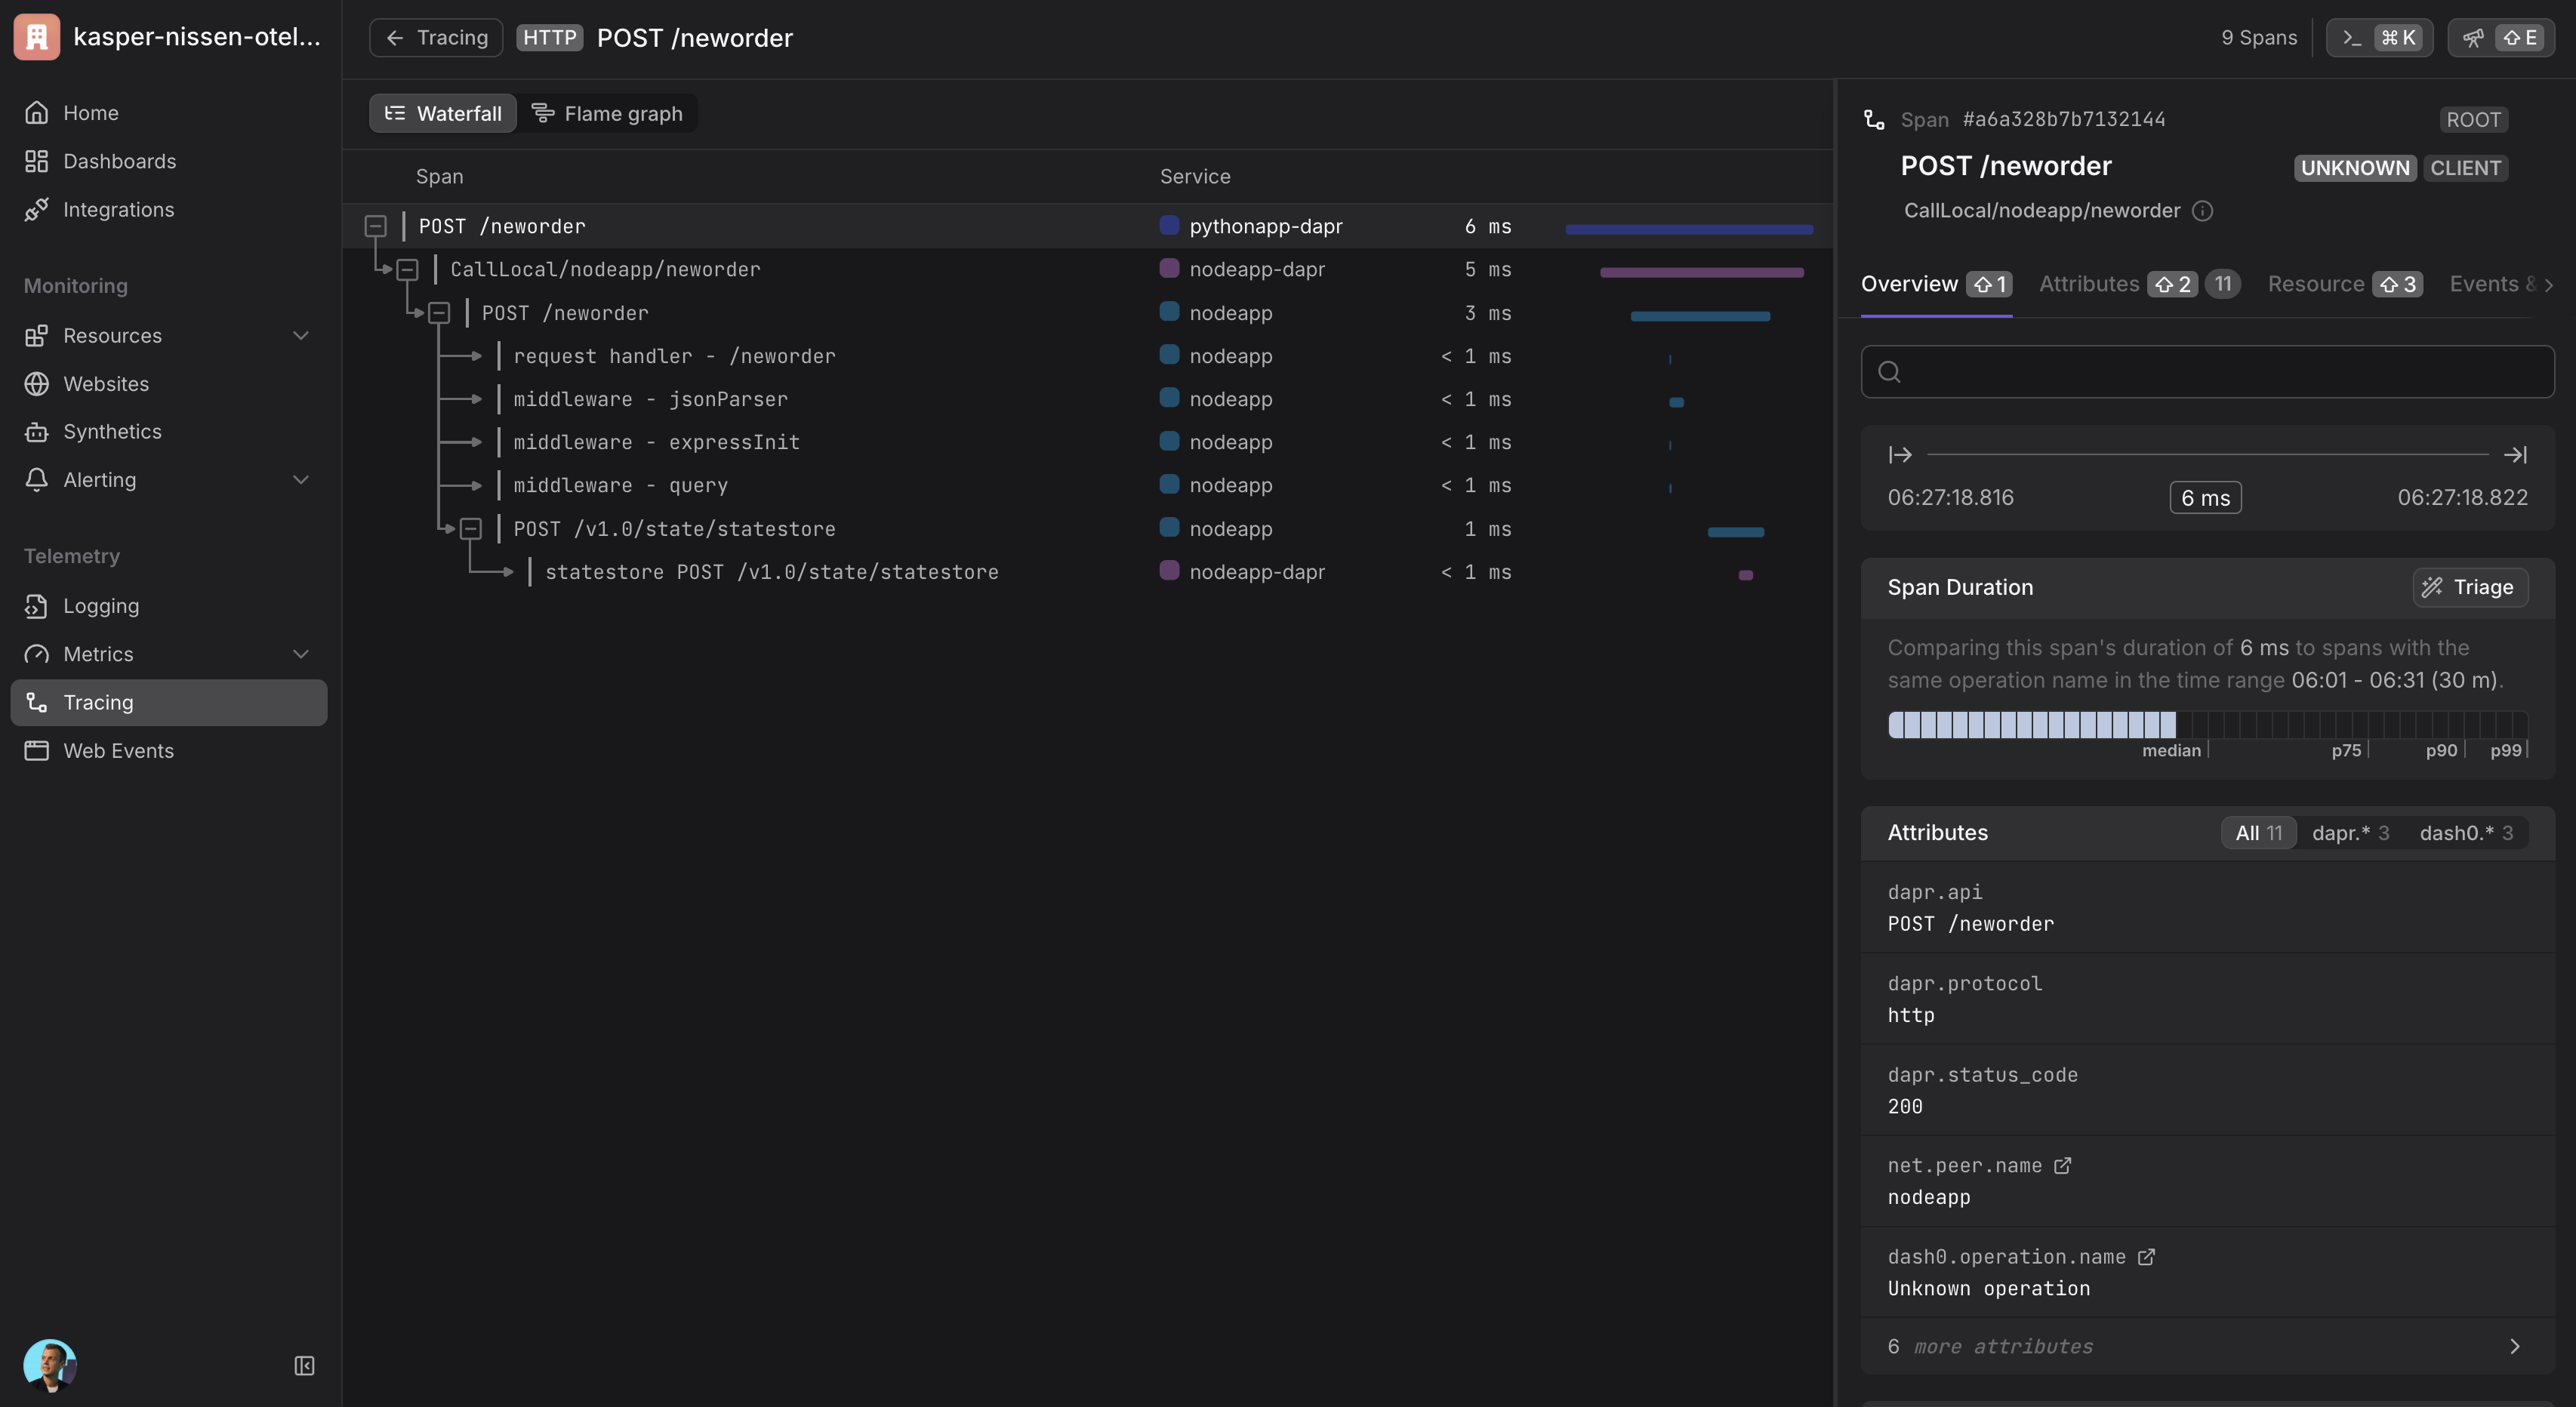
Viewing traces
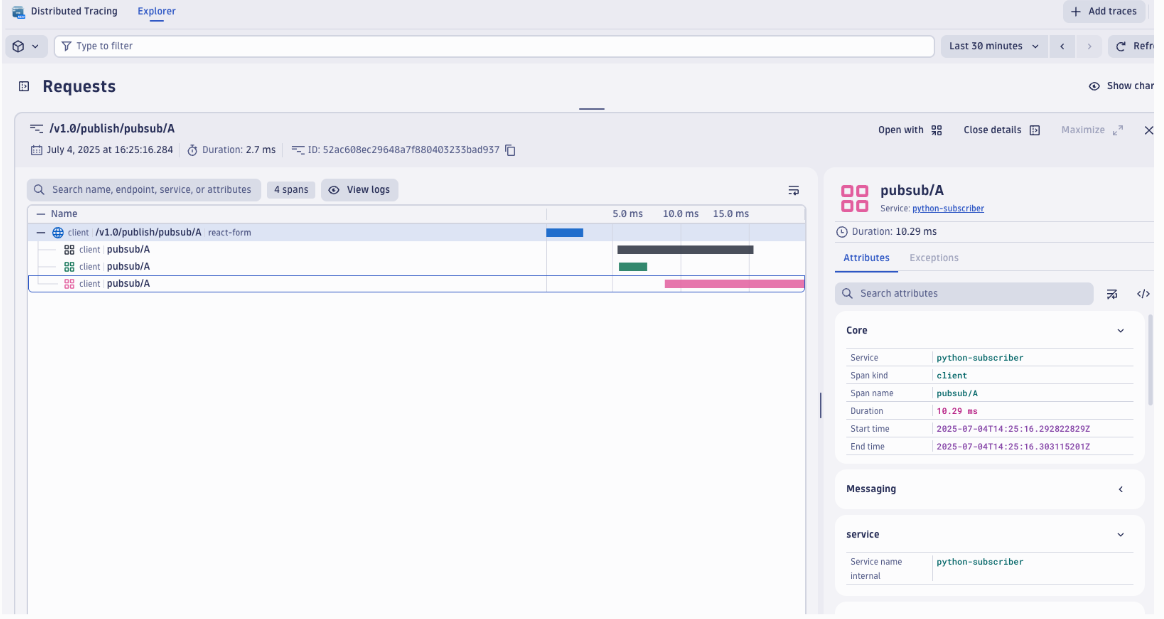
Once your setup is complete and telemetry data is flowing, you can view traces in Dash0:
- Navigate to your Dash0 account
- Go to the Traces section
- You should see distributed traces from your Dapr applications
- Use filters to narrow down traces by service name, operation, or time range
Cleanup
helm -n opentelemetry uninstall otel-collector
kubectl -n opentelemetry delete secret dash0-secrets
kubectl delete ns opentelemetry
Related Links
8 - How-To: Set up Datadog for distributed tracing
Dapr captures metrics and traces that can be sent directly to Datadog through the OpenTelemetry Collector Datadog exporter.
Configure Dapr tracing with the OpenTelemetry Collector and Datadog
Using the OpenTelemetry Collector Datadog exporter, you can configure Dapr to create traces for each application in your Kubernetes cluster and collect them in Datadog.
Before you begin, set up the OpenTelemetry Collector.
Add your Datadog API key to the
./deploy/opentelemetry-collector-generic-datadog.yamlfile in thedatadogexporter configuration section:data: otel-collector-config: ... exporters: ... datadog: api: key: <YOUR_API_KEY>Apply the
opentelemetry-collectorconfiguration by running the following command.kubectl apply -f ./deploy/open-telemetry-collector-generic-datadog.yamlSet up a Dapr configuration file that will turn on tracing and deploy a tracing exporter component that uses the OpenTelemetry Collector.
kubectl apply -f ./deploy/collector-config.yamlApply the
appconfigconfiguration by adding adapr.io/configannotation to the container that you want to participate in the distributed tracing.annotations: dapr.io/config: "appconfig"Create and configure the application. Once running, telemetry data is sent to Datadog and visible in Datadog APM.