This is the multi-page printable view of this section. Click here to print.
Metrics
- 1: Configure metrics
- 2: How-To: Observe metrics with Prometheus
- 3: How-To: Observe metrics with Grafana
- 4: How-To: Set-up New Relic to collect and analyze metrics
- 5: How-To: Set up Azure Monitor to search logs and collect metrics
1 - Configure metrics
By default, each Dapr system process emits Go runtime/process metrics and has their own Dapr metrics.
Prometheus endpoint
The Dapr sidecar exposes a Prometheus-compatible metrics endpoint that you can scrape to gain a greater understanding of how Dapr is behaving.
Configuring metrics using the CLI
The metrics application endpoint is enabled by default. You can disable it by passing the command line argument --enable-metrics=false.
The default metrics port is 9090. You can override this by passing the command line argument --metrics-port to daprd.
Configuring metrics in Kubernetes
You can also enable/disable the metrics for a specific application by setting the dapr.io/enable-metrics: "false" annotation on your application deployment. With the metrics exporter disabled, daprd does not open the metrics listening port.
The following Kubernetes deployment example shows how metrics are explicitly enabled with the port specified as “9090”.
apiVersion: apps/v1
kind: Deployment
metadata:
  name: nodeapp
  labels:
    app: node
spec:
  replicas: 1
  selector:
    matchLabels:
      app: node
  template:
    metadata:
      labels:
        app: node
      annotations:
        dapr.io/enabled: "true"
        dapr.io/app-id: "nodeapp"
        dapr.io/app-port: "3000"
        dapr.io/enable-metrics: "true"
        dapr.io/metrics-port: "9090"
    spec:
      containers:
      - name: node
        image: dapriosamples/hello-k8s-node:latest
        ports:
        - containerPort: 3000
        imagePullPolicy: Always
Configuring metrics using application configuration
You can also enable metrics via application configuration. To disable the metrics collection in the Dapr sidecars by default, set spec.metrics.enabled to false.
apiVersion: dapr.io/v1alpha1
kind: Configuration
metadata:
  name: tracing
  namespace: default
spec:
  metrics:
    enabled: false
Configuring metrics for error codes
You can enable additional metrics for Dapr API error codes by setting spec.metrics.recordErrorCodes to true. Dapr APIs which communicate back to their caller may return standardized error codes. A new metric called error_code_total is recorded, which allows monitoring of error codes triggered by application, code, and category. See the errorcodes package for specific codes and categories.
Example configuration:
apiVersion: dapr.io/v1alpha1
kind: Configuration
metadata:
  name: tracing
  namespace: default
spec:
  metrics:
    enabled: true
    recordErrorCodes: true
Example metric:
{
  "app_id": "publisher-app",
  "category": "state",
  "dapr_io_enabled": "true",
  "error_code": "ERR_STATE_STORE_NOT_CONFIGURED",
  "instance": "10.244.1.64:9090",
  "job": "kubernetes-service-endpoints",
  "namespace": "my-app",
  "node": "my-node",
  "service": "publisher-app-dapr"
}
Optimizing HTTP metrics reporting with path matching
When invoking Dapr using HTTP, metrics are created for each requested method by default. This can result in a high number of metrics, known as high cardinality, which can impact memory usage and CPU.
Path matching allows you to manage and control the cardinality of HTTP metrics in Dapr. This is an aggregation of metrics, so rather than having a metric for each event, you can reduce the number of metrics events and report an overall number. Learn more about how to set the cardinality in configuration.
This configuration is opt-in and is enabled via the Dapr configuration spec.metrics.http.pathMatching. When defined, it enables path matching, which standardizes specified paths for both metrics paths. This reduces the number of unique metrics paths, making metrics more manageable and reducing resource consumption in a controlled way.
When spec.metrics.http.pathMatching is combined with the increasedCardinality flag set to false, non-matched paths are transformed into a catch-all bucket to control and limit cardinality, preventing unbounded path growth. Conversely, when increasedCardinality is true (the default), non-matched paths are passed through as they normally would be, allowing for potentially higher cardinality but preserving the original path data.
Examples of Path Matching in HTTP Metrics
The following examples demonstrate how to use the Path Matching API in Dapr for managing HTTP metrics. On each example, the metrics are collected from 5 HTTP requests to the /orders endpoint with different order IDs. By adjusting cardinality and utilizing path matching, you can fine-tune metric granularity to balance detail and resource efficiency.
These examples illustrate the cardinality of the metrics, highlighting that high cardinality configurations result in many entries, which correspond to higher memory usage for handling metrics. For simplicity, the following example focuses on a single metric: dapr_http_server_request_count.
Low cardinality with path matching (Recommendation)
Configuration:
http:
  increasedCardinality: false
  pathMatching:
    - /orders/{orderID}
Metrics generated:
# matched paths
dapr_http_server_request_count{app_id="order-service",method="GET",path="/orders/{orderID}",status="200"} 5
# unmatched paths
dapr_http_server_request_count{app_id="order-service",method="GET",path="",status="200"} 1
With low cardinality and path matching configured, you get the best of both worlds by grouping the metrics for the important endpoints without compromising the cardinality. This approach helps avoid high memory usage and potential security issues.
Low cardinality without path matching
Configuration:
http:
  increasedCardinality: false
Metrics generated:
dapr_http_server_request_count{app_id="order-service",method="GET", path="",status="200"} 5
In low cardinality mode, the path, which is the main source of unbounded cardinality, is dropped. This results in metrics that primarily indicate the number of requests made to the service for a given HTTP method, but without any information about the paths invoked.
High cardinality with path matching
Configuration:
http:
  increasedCardinality: true
  pathMatching:
    - /orders/{orderID}
Metrics generated:
dapr_http_server_request_count{app_id="order-service",method="GET",path="/orders/{orderID}",status="200"} 5
This example results from the same HTTP requests as the example above, but with path matching configured for the path /orders/{orderID}. By using path matching, you achieve reduced cardinality by grouping the metrics based on the matched path.
High Cardinality without path matching
Configuration:
http:
  increasedCardinality: true
Metrics generated:
dapr_http_server_request_count{app_id="order-service",method="GET",path="/orders/1",status="200"} 1
dapr_http_server_request_count{app_id="order-service",method="GET",path="/orders/2",status="200"} 1
dapr_http_server_request_count{app_id="order-service",method="GET",path="/orders/3",status="200"} 1
dapr_http_server_request_count{app_id="order-service",method="GET",path="/orders/4",status="200"} 1
dapr_http_server_request_count{app_id="order-service",method="GET",path="/orders/5",status="200"} 1
For each request, a new metric is created with the request path. This process continues for every request made to a new order ID, resulting in unbounded cardinality since the IDs are ever-growing.
HTTP metrics exclude verbs
The excludeVerbs option allows you to exclude specific HTTP verbs from being reported in the metrics. This can be useful in high-performance applications where memory savings are critical.
Examples of excluding HTTP verbs in metrics
The following examples demonstrate how to exclude HTTP verbs in Dapr for managing HTTP metrics.
Default - Include HTTP verbs
Configuration:
http:
  excludeVerbs: false
Metrics generated:
dapr_http_server_request_count{app_id="order-service",method="GET",path="/orders",status="200"} 1
dapr_http_server_request_count{app_id="order-service",method="POST",path="/orders",status="200"} 1
In this example, the HTTP method is included in the metrics, resulting in a separate metric for each request to the /orders endpoint.
Exclude HTTP verbs
Configuration:
http:
  excludeVerbs: true
Metrics generated:
dapr_http_server_request_count{app_id="order-service",method="",path="/orders",status="200"} 2
In this example, the HTTP method is excluded from the metrics, resulting in a single metric for all requests to the /orders endpoint.
Configuring custom latency histogram buckets
Dapr uses cumulative histogram metrics to group latency values into buckets, where each bucket contains:
- A count of the number of requests with that latency
- All the requests with lower latency
Using the default latency bucket configurations
By default, Dapr groups request latency metrics into the following buckets:
1, 2, 3, 4, 5, 6, 8, 10, 13, 16, 20, 25, 30, 40, 50, 65, 80, 100, 130, 160, 200, 250, 300, 400, 500, 650, 800, 1000, 2000, 5000, 10000, 20000, 50000, 100000
Grouping latency values in a cumulative fashion allows buckets to be used or dropped as needed for increased or decreased granularity of data. For example, if a request takes 3ms, it’s counted in the 3ms bucket, the 4ms bucket, the 5ms bucket, and so on. Similarly, if a request takes 10ms, it’s counted in the 10ms bucket, the 13ms bucket, the 16ms bucket, and so on. After these two requests have completed, the 3ms bucket has a count of 1 and the 10ms bucket has a count of 2, since both the 3ms and 10ms requests are included here.
This shows up as follows:
| 1 | 2 | 3 | 4 | 5 | 6 | 8 | 10 | 13 | 16 | 20 | 25 | 30 | 40 | 50 | 65 | 80 | 100 | 130 | 160 | ….. | 100000 |
|---|---|---|---|---|---|---|---|---|---|---|---|---|---|---|---|---|---|---|---|---|---|
| 0 | 0 | 1 | 1 | 1 | 1 | 1 | 2 | 2 | 2 | 2 | 2 | 2 | 2 | 2 | 2 | 2 | 2 | 2 | 2 | ….. | 2 |
The default number of buckets works well for most use cases, but can be adjusted as needed. Each request creates 34 different metrics, leaving this value to grow considerably for a large number of applications. More accurate latency percentiles can be achieved by increasing the number of buckets. However, a higher number of buckets increases the amount of memory used to store the metrics, potentially negatively impacting your monitoring system.
It is recommended to keep the number of latency buckets set to the default value, unless you are seeing unwanted memory pressure in your monitoring system. Configuring the number of buckets allows you to choose applications where:
- You want to see more detail with a higher number of buckets
- Broader values are sufficient by reducing the buckets
Take note of the default latency values your applications are producing before configuring the number buckets.
Customizing latency buckets to your scenario
Tailor the latency buckets to your needs, by modifying the spec.metrics.latencyDistributionBuckets field in the Dapr configuration spec for your application(s).
For example, if you aren’t interested in extremely low latency values (1-10ms), you can group them in a single 10ms bucket. Similarly, you can group the high values in a single bucket (1000-5000ms), while keeping more detail in the middle range of values that you are most interested in.
The following Configuration spec example replaces the default 34 buckets with 11 buckets, giving a higher level of granularity in the middle range of values:
apiVersion: dapr.io/v1alpha1
kind: Configuration
metadata:
  name: custom-metrics
spec:
    metrics:
        enabled: true
        latencyDistributionBuckets: [10, 25, 40, 50, 70, 100, 150, 200, 500, 1000, 5000]
Transform metrics with regular expressions
You can set regular expressions for every metric exposed by the Dapr sidecar to “transform” their values. See a list of all Dapr metrics.
The name of the rule must match the name of the metric that is transformed. The following example shows how to apply a regular expression for the label method in the metric dapr_runtime_service_invocation_req_sent_total:
apiVersion: dapr.io/v1alpha1
kind: Configuration
metadata:
  name: daprConfig
spec:
  metrics:
    enabled: true
    http:
      increasedCardinality: true
    rules:
      - name: dapr_runtime_service_invocation_req_sent_total
        labels:
        - name: method
          regex:
            "orders/": "orders/.+"
When this configuration is applied, a recorded metric with the method label of orders/a746dhsk293972nz is replaced with orders/.
Using regular expressions to reduce metrics cardinality is considered legacy. We encourage all users to set spec.metrics.http.increasedCardinality to false instead, which is simpler to configure and offers better performance.
References
2 - How-To: Observe metrics with Prometheus
Setup Prometheus Locally
To run Prometheus on your local machine, you can either install and run it as a process or run it as a Docker container.
Install
Note
You don’t need to install Prometheus if you plan to run it as a Docker container. Please refer to the Container instructions.To install Prometheus, follow the steps outlined here for your OS.
Configure
Now you’ve installed Prometheus, you need to create a configuration.
Below is an example Prometheus configuration, save this to a file i.e. /tmp/prometheus.yml or C:\Temp\prometheus.yml
global:
  scrape_interval:     15s # By default, scrape targets every 15 seconds.

# A scrape configuration containing exactly one endpoint to scrape:
# Here it's Prometheus itself.
scrape_configs:
  - job_name: 'dapr'

    # Override the global default and scrape targets from this job every 5 seconds.
    scrape_interval: 5s

    static_configs:
      - targets: ['localhost:9090'] # Replace with Dapr metrics port if not default
Run as Process
Run Prometheus with your configuration to start it collecting metrics from the specified targets.
./prometheus --config.file=/tmp/prometheus.yml --web.listen-address=:8080
We change the port so it doesn’t conflict with Dapr’s own metrics endpoint.
If you are not currently running a Dapr application, the target will show as offline. In order to start collecting metrics you must start Dapr with the metrics port matching the one provided as the target in the configuration.
Once Prometheus is running, you’ll be able to visit its dashboard by visiting http://localhost:8080.
Run as Container
To run Prometheus as a Docker container on your local machine, first ensure you have Docker installed and running.
Then you can run Prometheus as a Docker container using:
docker run \
    --net=host \
    -v /tmp/prometheus.yml:/etc/prometheus/prometheus.yml \
    prom/prometheus --config.file=/etc/prometheus/prometheus.yml --web.listen-address=:8080
--net=host ensures that the Prometheus instance will be able to connect to any Dapr instances running on the host machine. If you plan to run your Dapr apps in containers as well, you’ll need to run them on a shared Docker network and update the configuration with the correct target address.
Once Prometheus is running, you’ll be able to visit its dashboard by visiting http://localhost:8080.
Setup Prometheus on Kubernetes
Prerequisites
Install Prometheus
- First create namespace that can be used to deploy the Grafana and Prometheus monitoring tools
kubectl create namespace dapr-monitoring
- Install Prometheus
helm repo add prometheus-community https://prometheus-community.github.io/helm-charts
helm repo update
helm install dapr-prom prometheus-community/prometheus -n dapr-monitoring
If you are Minikube user or want to disable persistent volume for development purposes, you can disable it by using the following command.
helm install dapr-prom prometheus-community/prometheus -n dapr-monitoring
 --set alertmanager.persistence.enabled=false --set pushgateway.persistentVolume.enabled=false --set server.persistentVolume.enabled=false
For automatic discovery of Dapr targets (Service Discovery), use:
helm install dapr-prom prometheus-community/prometheus -f values.yaml -n dapr-monitoring --create-namespace
values.yaml File
alertmanager:
  persistence:
    enabled: false
pushgateway:
  persistentVolume:
    enabled: false
server:
  persistentVolume:
    enabled: false

# Adds additional scrape configurations to prometheus.yml
# Uses service discovery to find Dapr and Dapr sidecar targets
extraScrapeConfigs: |-
  - job_name: dapr-sidecars
    kubernetes_sd_configs:
      - role: pod
    relabel_configs:
      - action: keep
        regex: "true"
        source_labels:
          - __meta_kubernetes_pod_annotation_dapr_io_enabled
      - action: keep
        regex: "true"
        source_labels:
          - __meta_kubernetes_pod_annotation_dapr_io_enable_metrics
      - action: replace
        replacement: ${1}
        source_labels:
          - __meta_kubernetes_namespace
        target_label: namespace
      - action: replace
        replacement: ${1}
        source_labels:
          - __meta_kubernetes_pod_name
        target_label: pod
      - action: replace
        regex: (.*);daprd
        replacement: ${1}-dapr
        source_labels:
          - __meta_kubernetes_pod_annotation_dapr_io_app_id
          - __meta_kubernetes_pod_container_name
        target_label: service
      - action: replace
        replacement: ${1}:9090
        source_labels:
          - __meta_kubernetes_pod_ip
        target_label: __address__

  - job_name: dapr
    kubernetes_sd_configs:
      - role: pod
    relabel_configs:
      - action: keep
        regex: dapr
        source_labels:
          - __meta_kubernetes_pod_label_app_kubernetes_io_name
      - action: keep
        regex: dapr
        source_labels:
          - __meta_kubernetes_pod_label_app_kubernetes_io_part_of
      - action: replace
        replacement: ${1}
        source_labels:
          - __meta_kubernetes_pod_label_app
        target_label: app
      - action: replace
        replacement: ${1}
        source_labels:
          - __meta_kubernetes_namespace
        target_label: namespace
      - action: replace
        replacement: ${1}
        source_labels:
          - __meta_kubernetes_pod_name
        target_label: pod
      - action: replace
        replacement: ${1}:9090
        source_labels:
          - __meta_kubernetes_pod_ip
        target_label: __address__
- Validation
Ensure Prometheus is running in your cluster.
kubectl get pods -n dapr-monitoring
Expected output:
NAME                                                READY   STATUS    RESTARTS   AGE
dapr-prom-kube-state-metrics-9849d6cc6-t94p8        1/1     Running   0          4m58s
dapr-prom-prometheus-alertmanager-749cc46f6-9b5t8   2/2     Running   0          4m58s
dapr-prom-prometheus-node-exporter-5jh8p            1/1     Running   0          4m58s
dapr-prom-prometheus-node-exporter-88gbg            1/1     Running   0          4m58s
dapr-prom-prometheus-node-exporter-bjp9f            1/1     Running   0          4m58s
dapr-prom-prometheus-pushgateway-688665d597-h4xx2   1/1     Running   0          4m58s
dapr-prom-prometheus-server-694fd8d7c-q5d59         2/2     Running   0          4m58s
Access the Prometheus Dashboard
To view the Prometheus dashboard and check service discovery:
kubectl port-forward svc/dapr-prom-prometheus-server 9090:80 -n dapr-monitoring
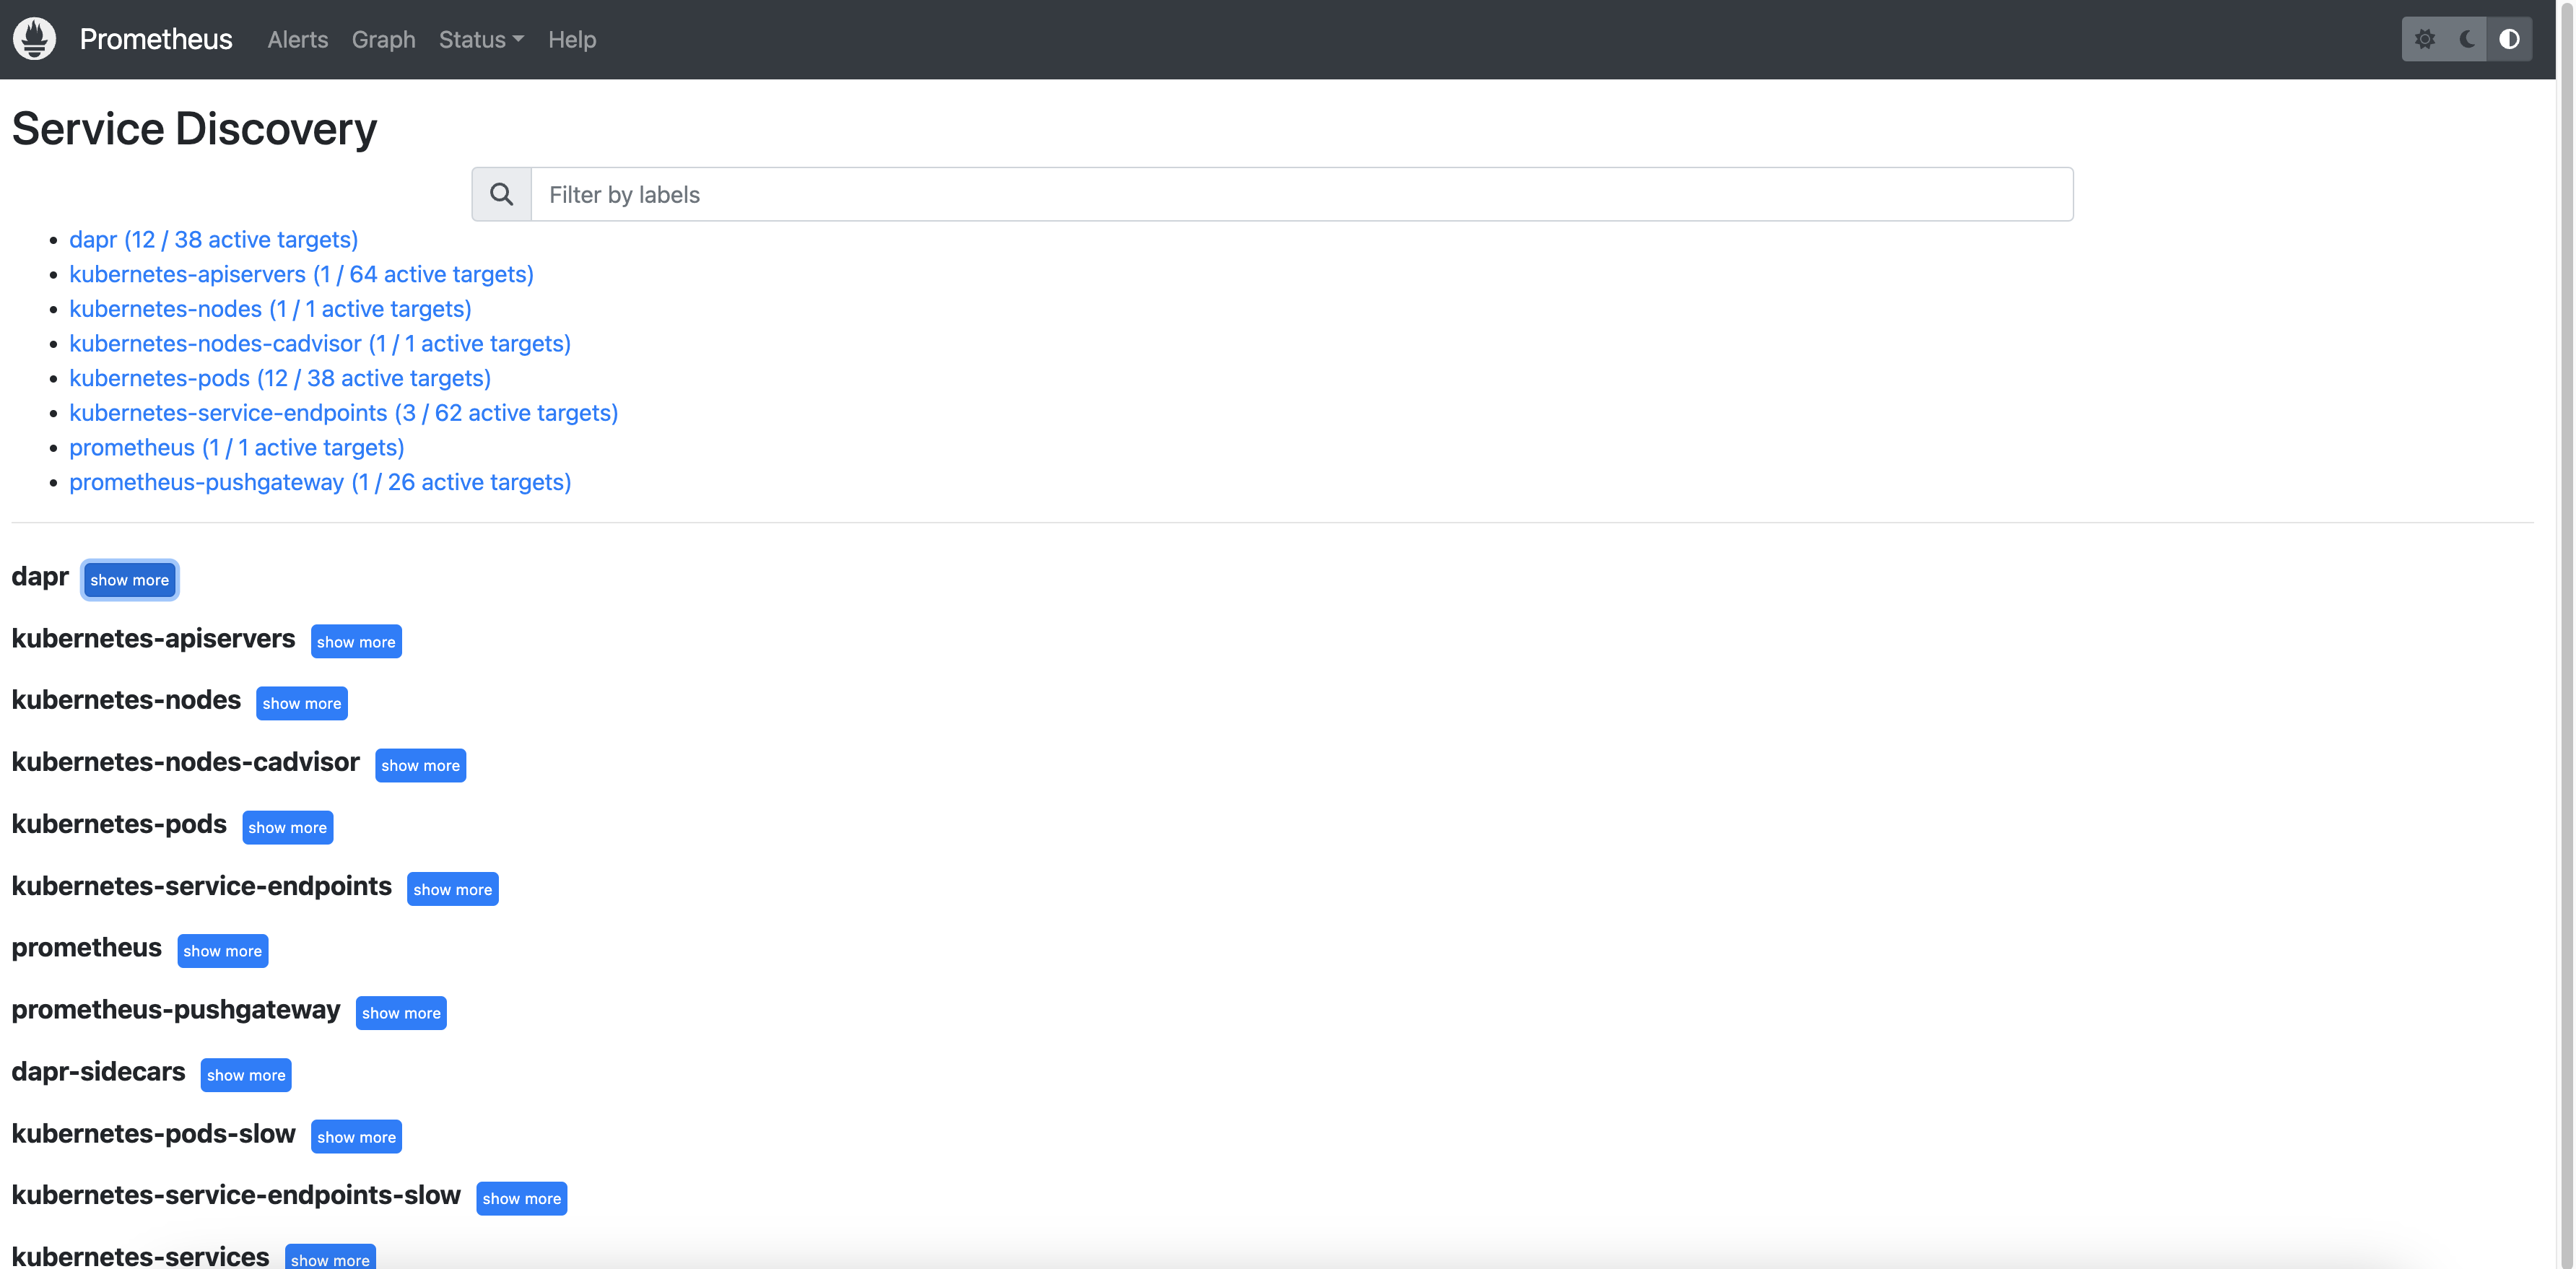
Open a browser and visit http://localhost:9090. Navigate to Status > Service Discovery to verify that the Dapr targets are discovered correctly.
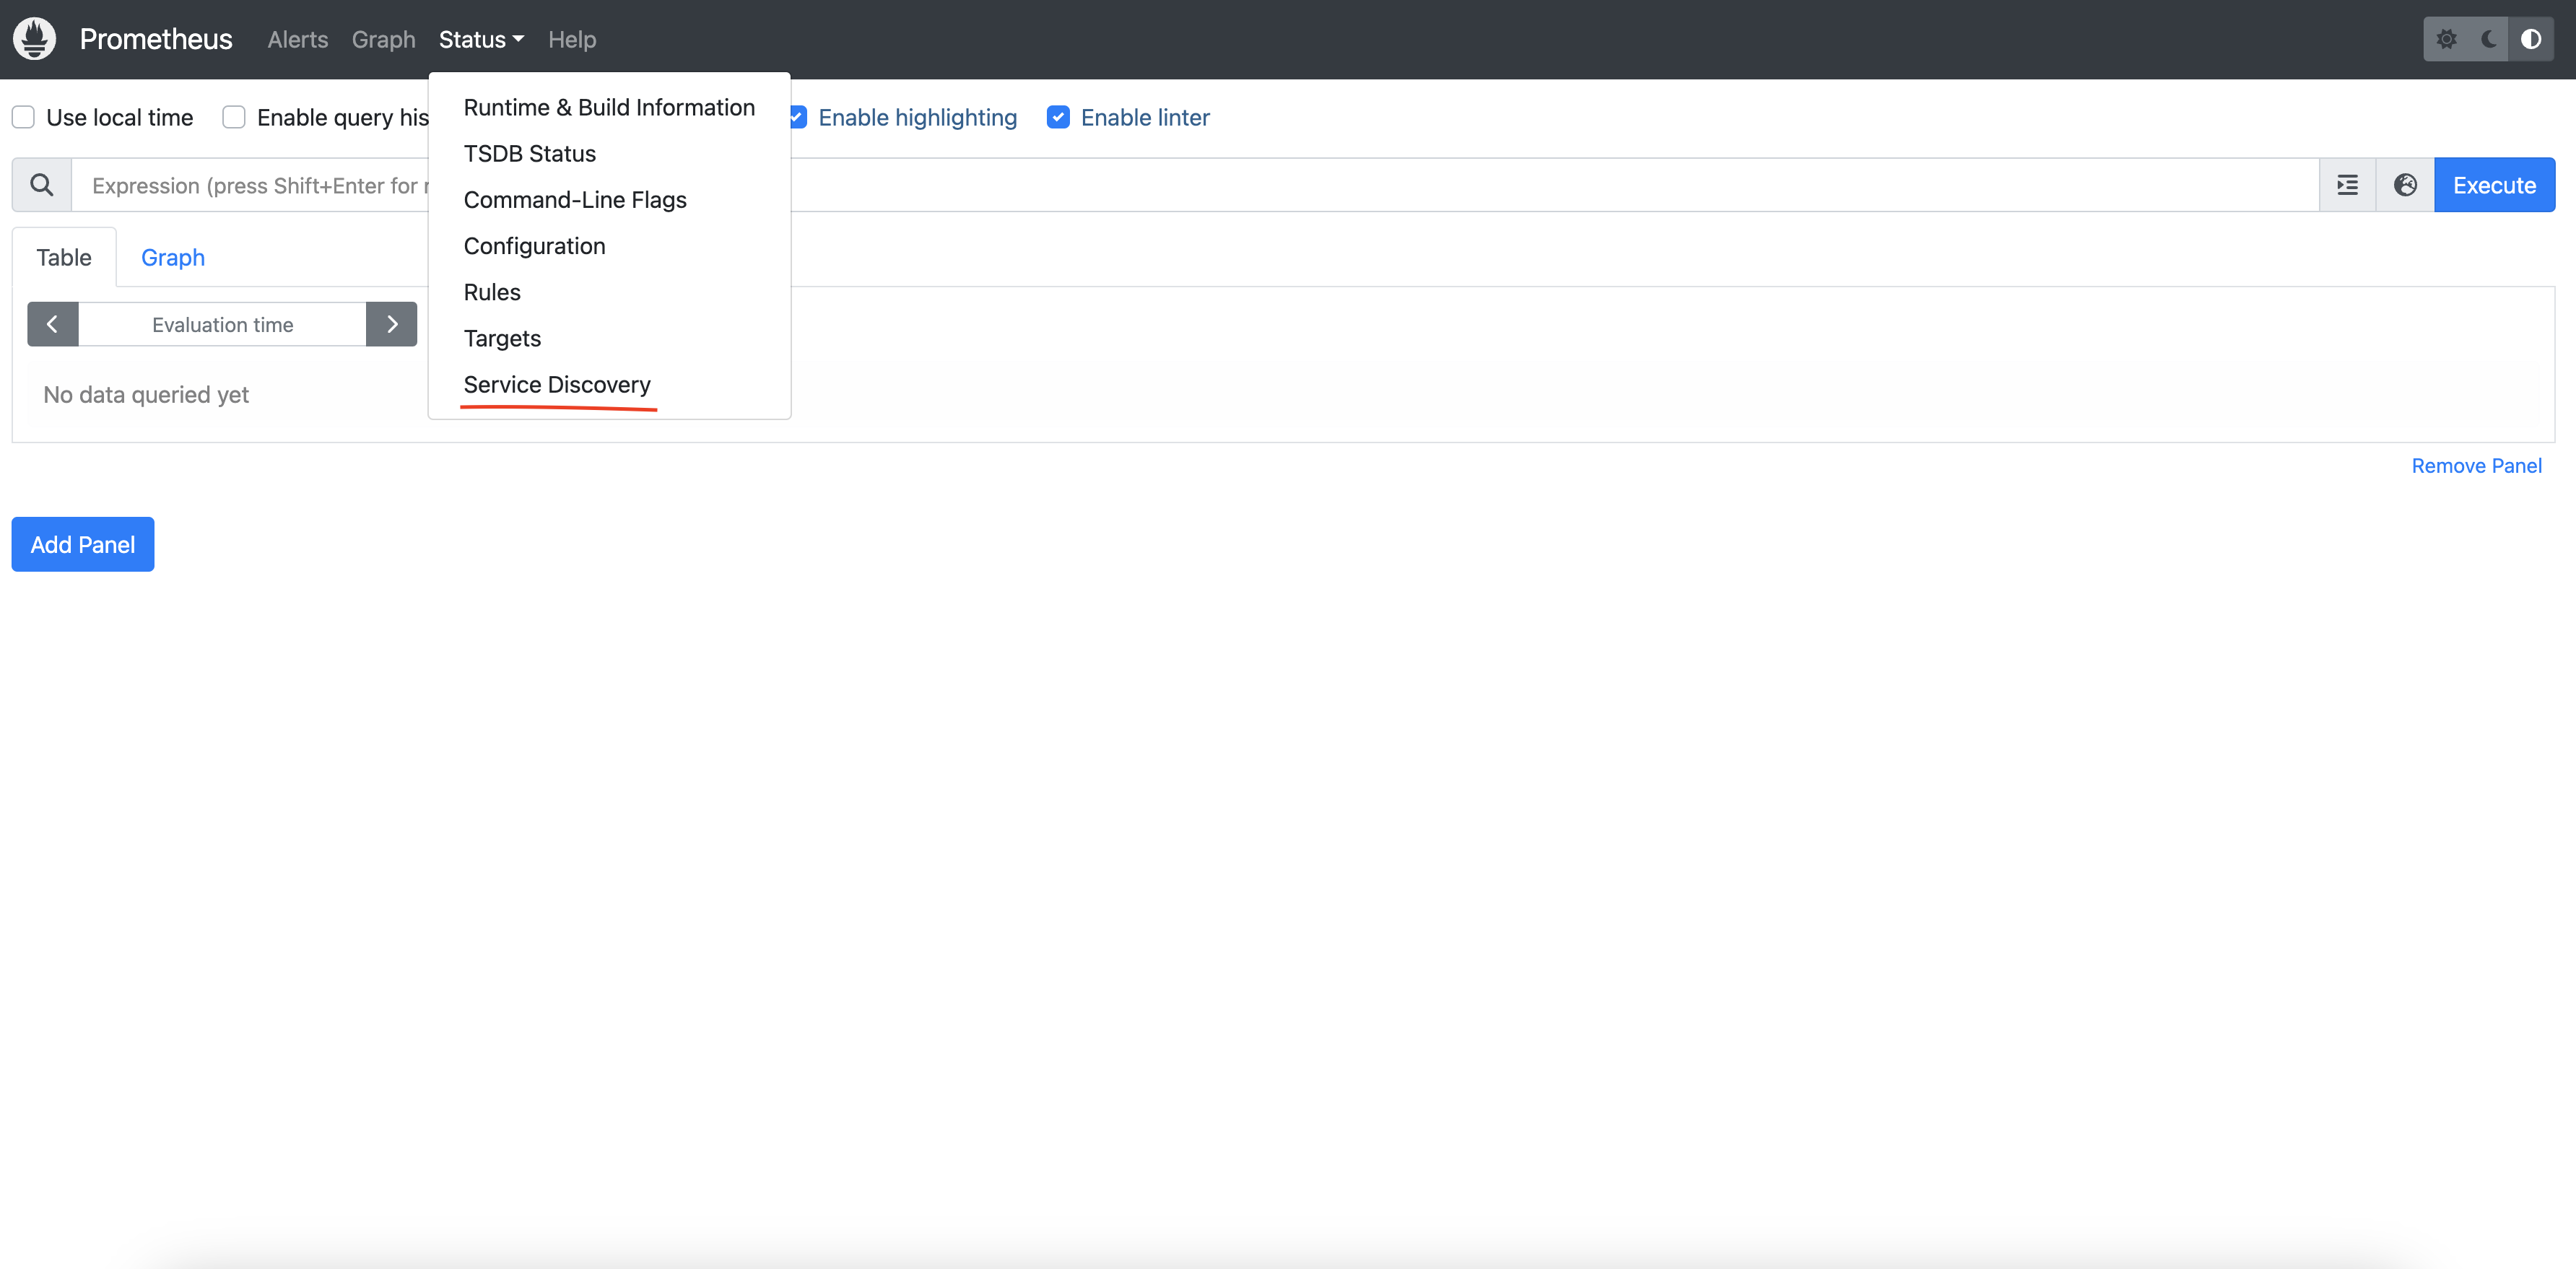
You can see the job_name and its discovered targets.
Example
References
3 - How-To: Observe metrics with Grafana
Available dashboards
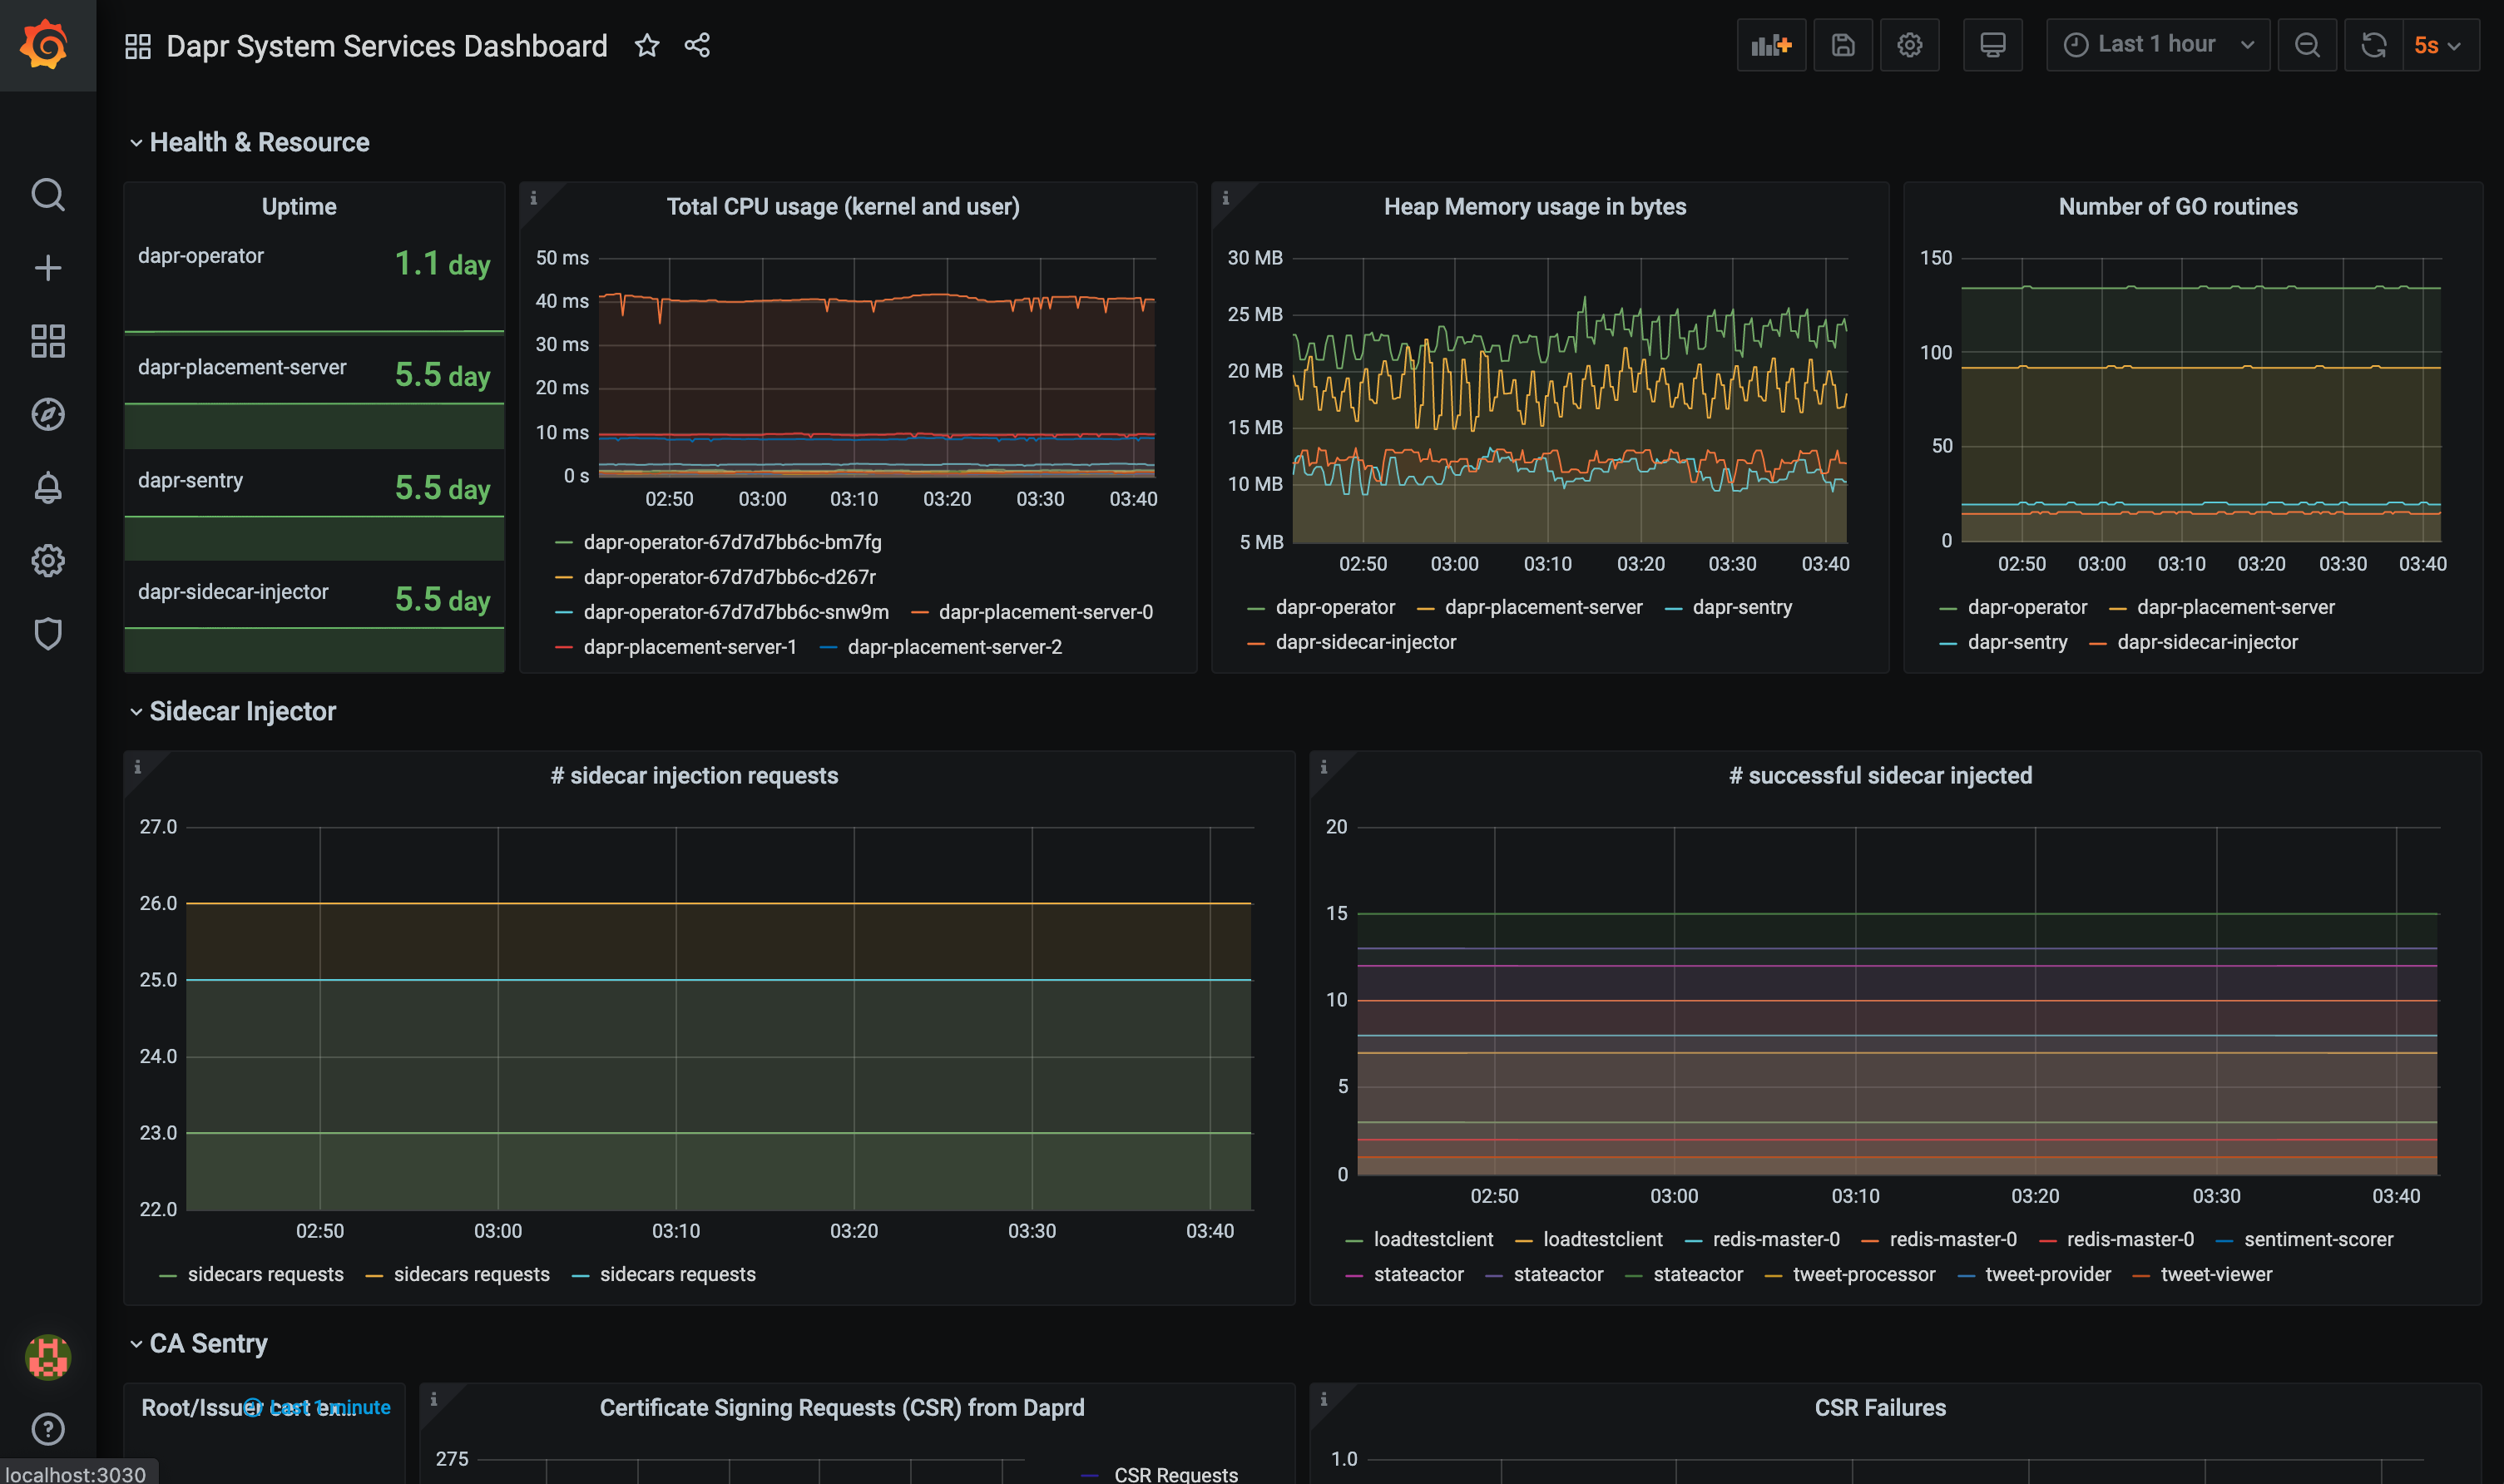
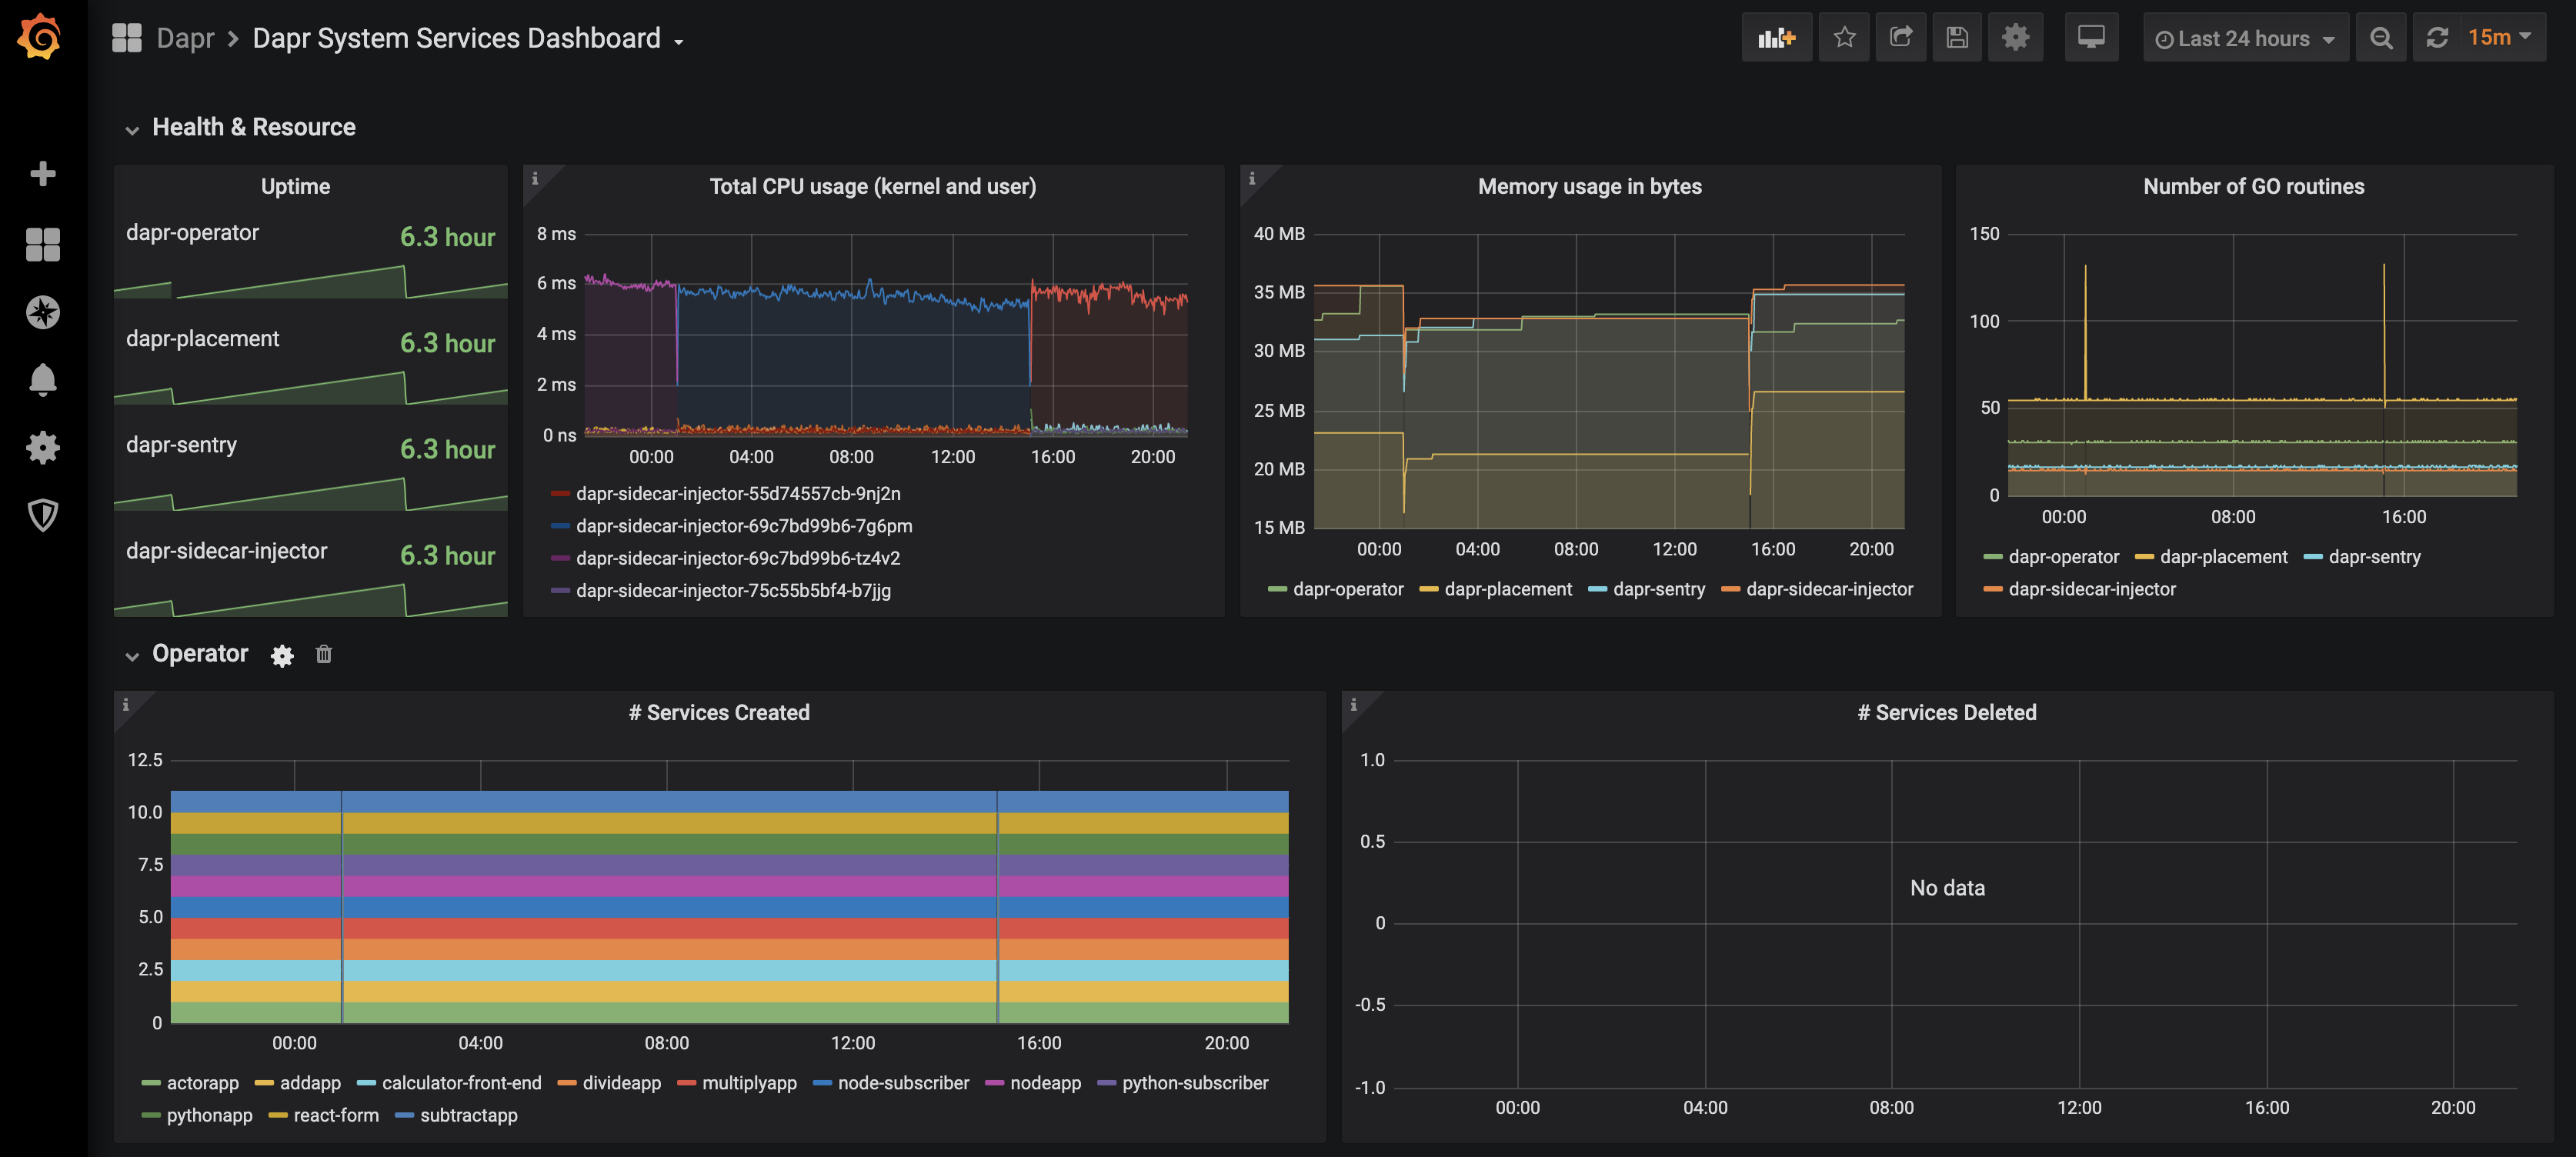
The grafana-system-services-dashboard.json template shows Dapr system component status, dapr-operator, dapr-sidecar-injector, dapr-sentry, and dapr-placement:
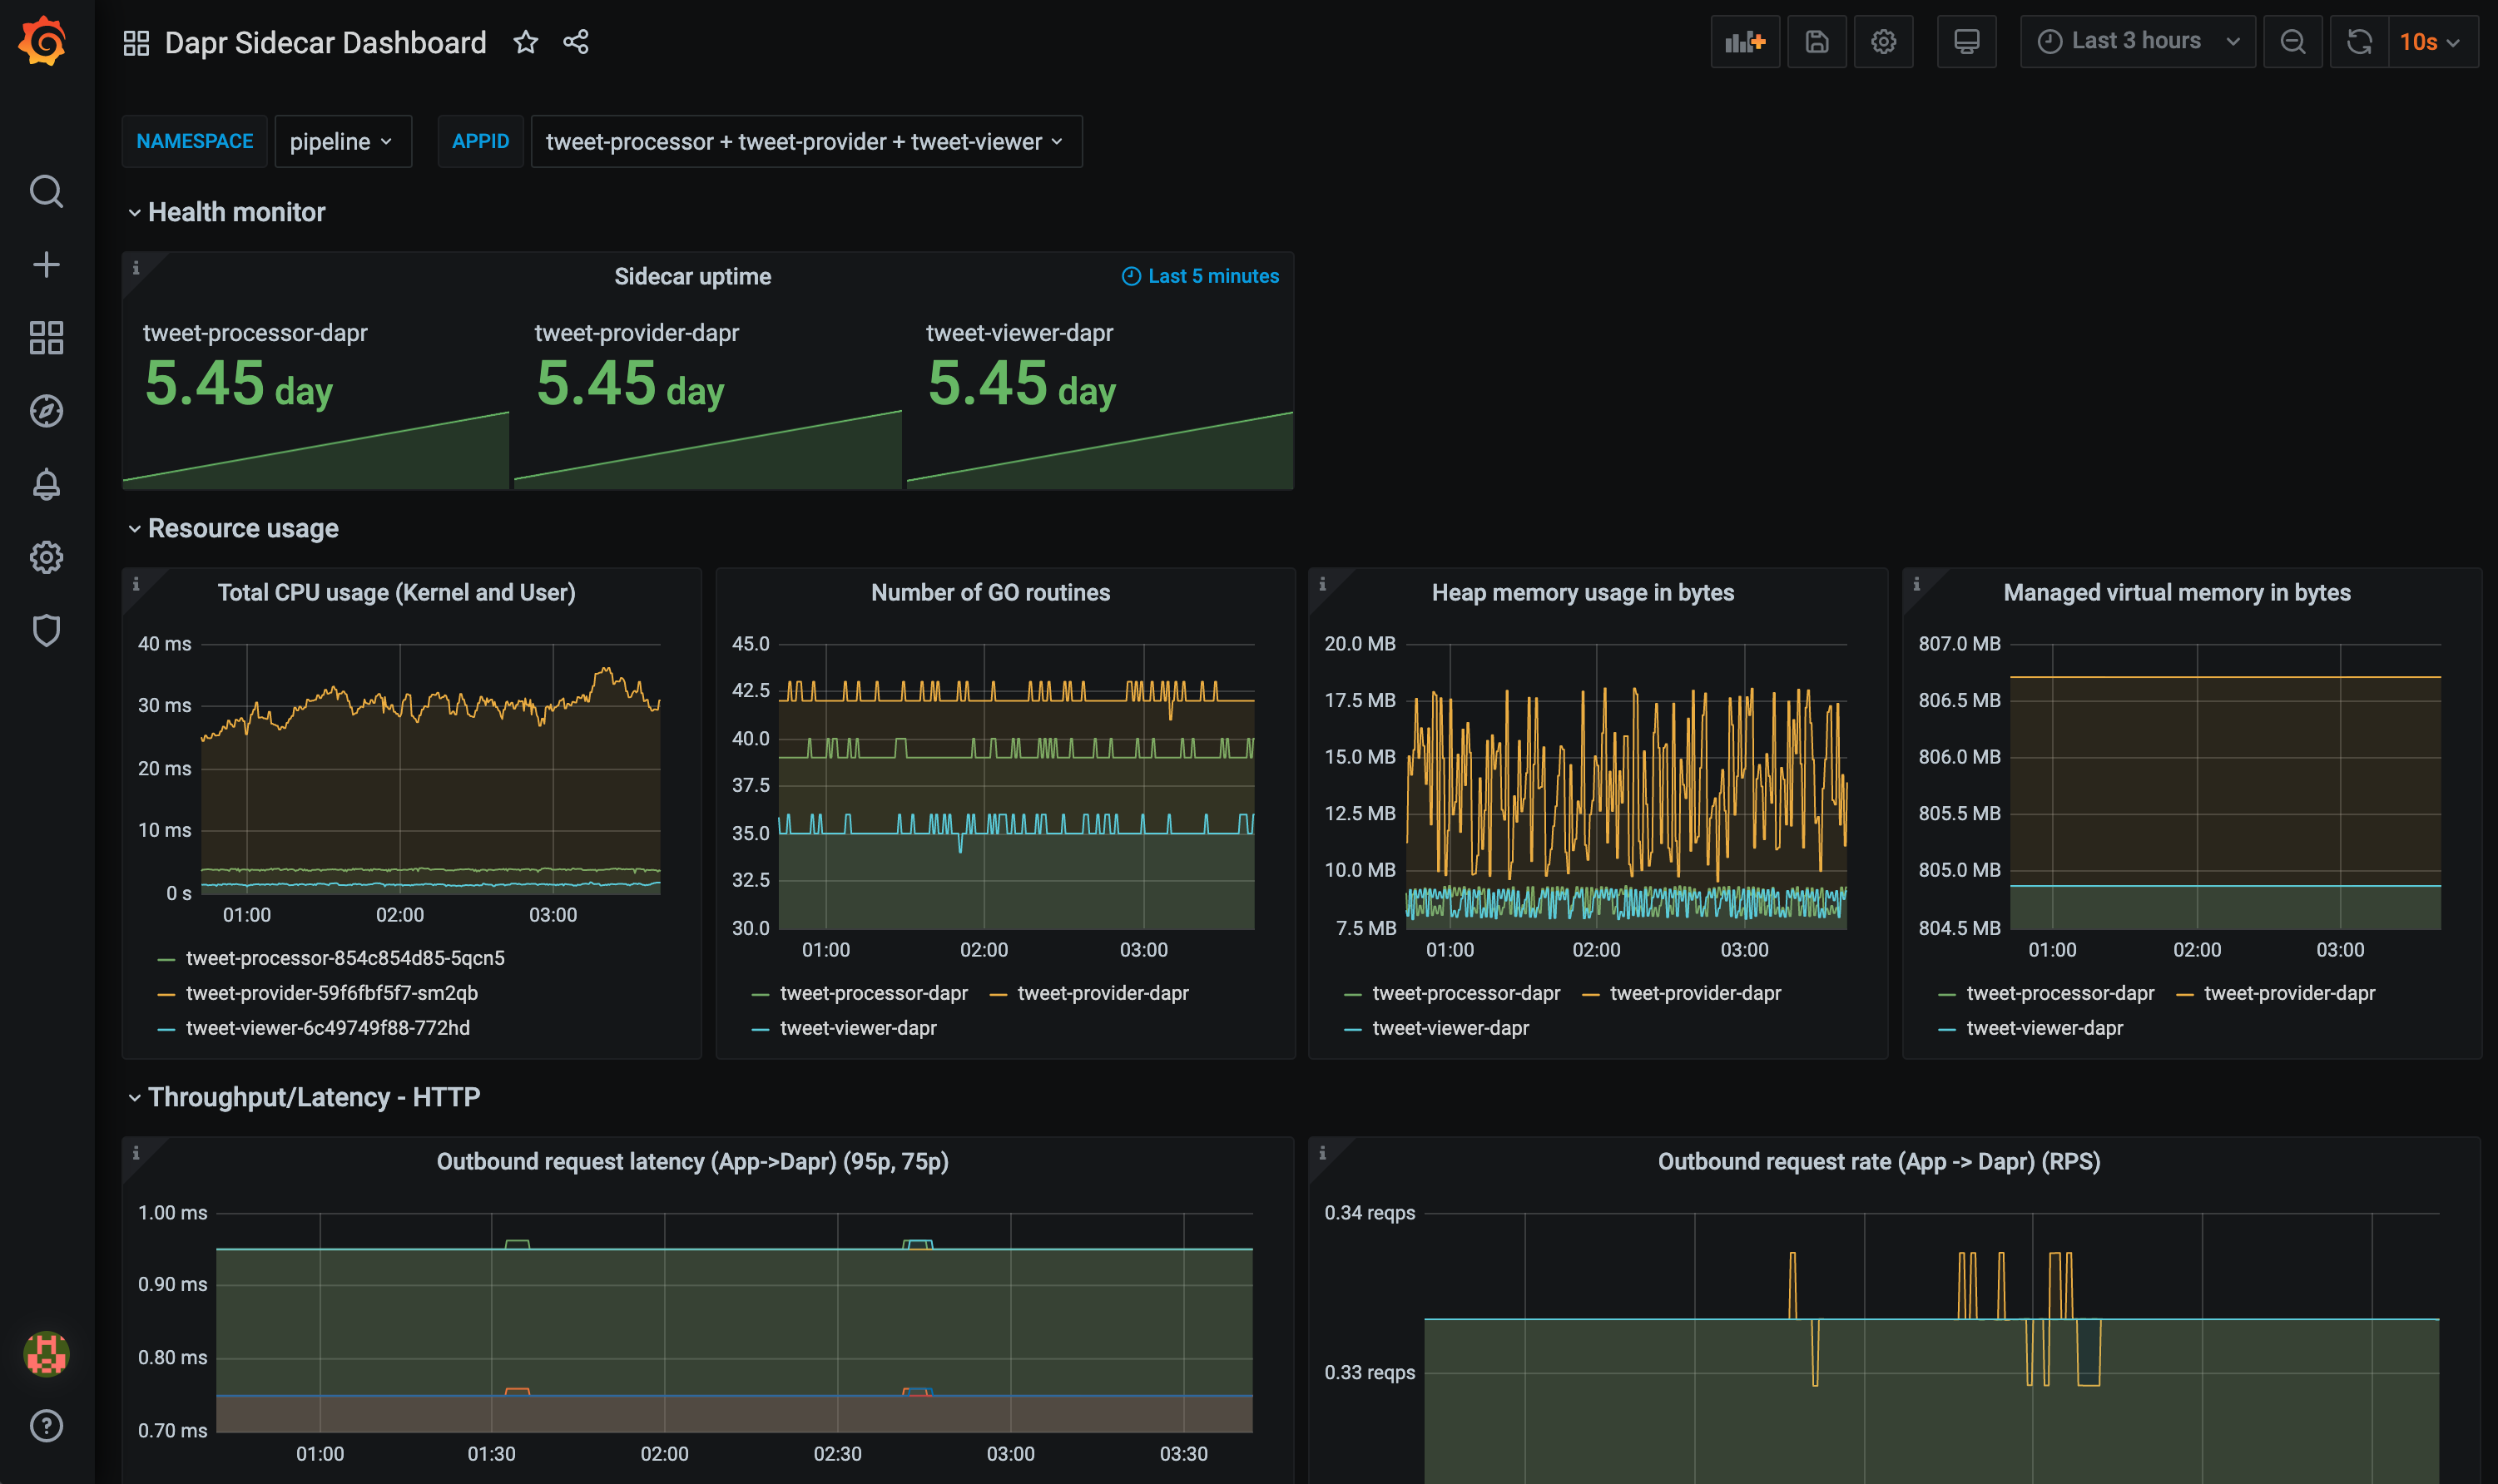
The grafana-sidecar-dashboard.json template shows Dapr sidecar status, including sidecar health/resources, throughput/latency of HTTP and gRPC, Actor, mTLS, etc.:
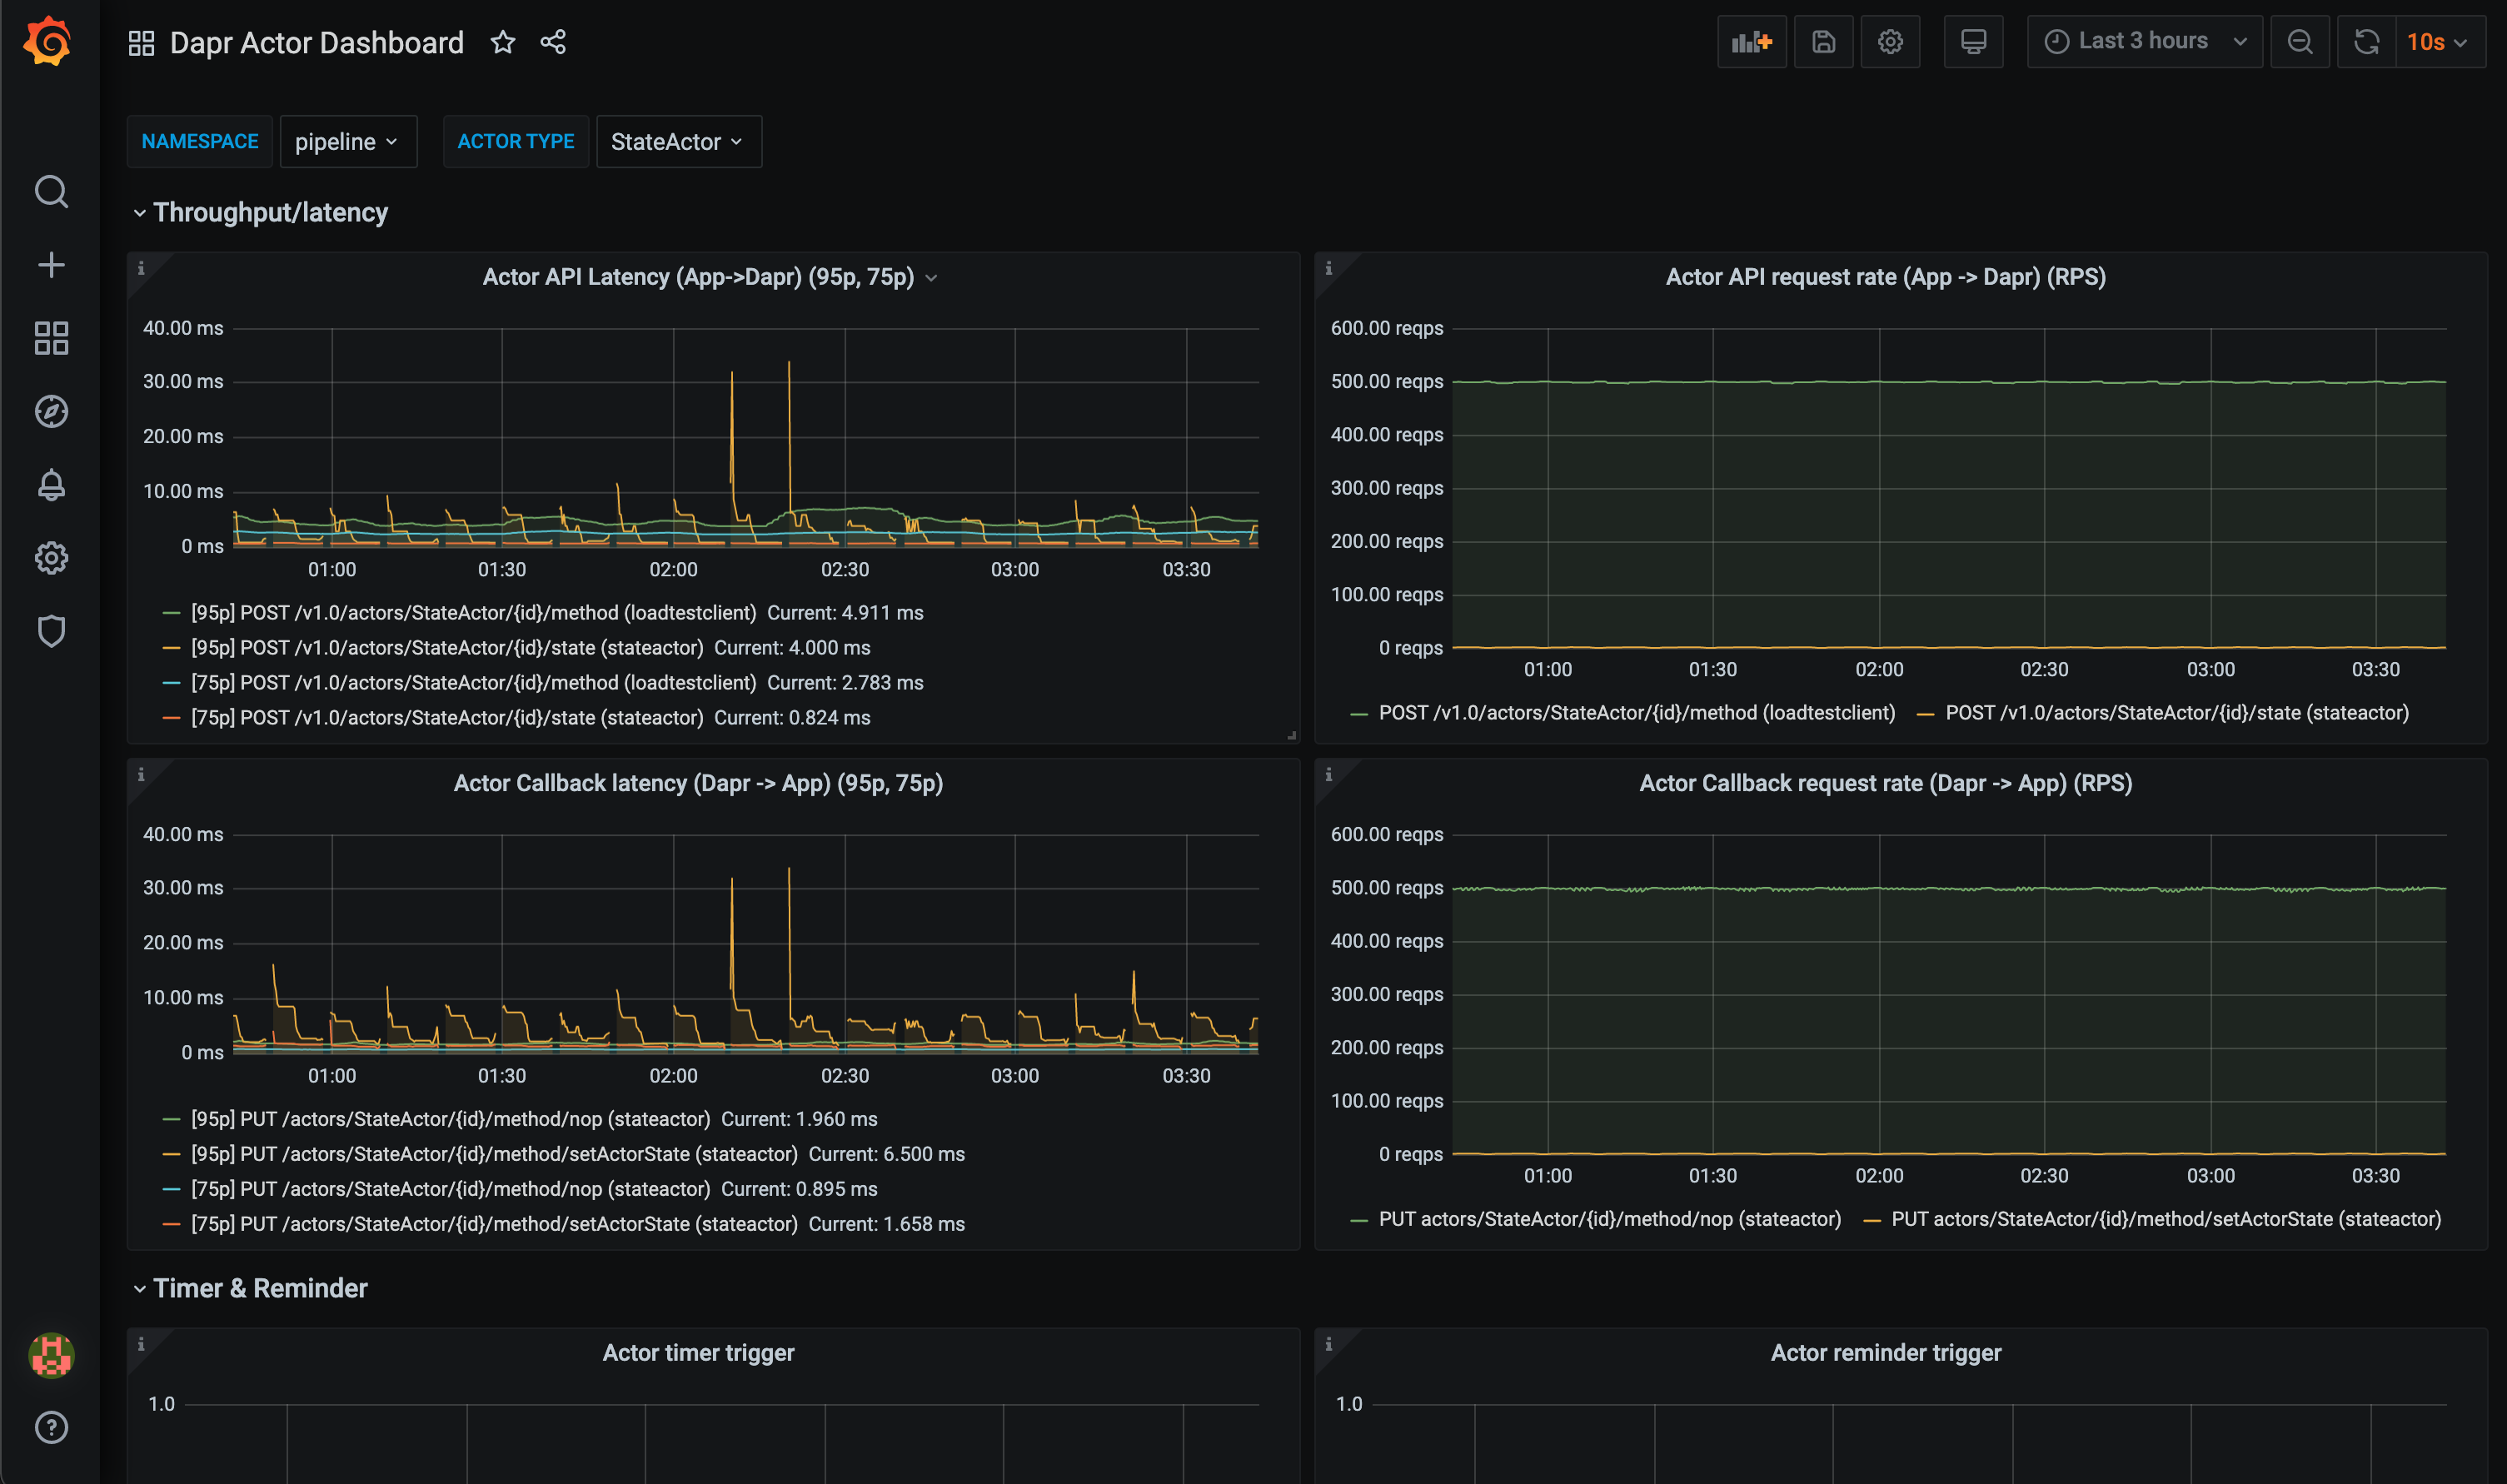
The grafana-actor-dashboard.json template shows Dapr Sidecar status, actor invocation throughput/latency, timer/reminder triggers, and turn-based concurrnecy:
Pre-requisites
Setup on Kubernetes
Install Grafana
-
Add the Grafana Helm repo:
helm repo add grafana https://grafana.github.io/helm-charts helm repo update -
Install the chart:
helm install grafana grafana/grafana -n dapr-monitoringNote
If you are Minikube user or want to disable persistent volume for development purpose, you can disable it by using the following command instead:
helm install grafana grafana/grafana -n dapr-monitoring --set persistence.enabled=false -
Retrieve the admin password for Grafana login:
kubectl get secret --namespace dapr-monitoring grafana -o jsonpath="{.data.admin-password}" | base64 --decode ; echoYou will get a password similar to
cj3m0OfBNx8SLzUlTx91dEECgzRlYJb60D2evof1%. Remove the%character from the password to getcj3m0OfBNx8SLzUlTx91dEECgzRlYJb60D2evof1as the admin password. -
Validation Grafana is running in your cluster:
kubectl get pods -n dapr-monitoring

NAME                                                READY   STATUS       RESTARTS   AGE
dapr-prom-kube-state-metrics-9849d6cc6-t94p8        1/1     Running      0          4m58s
dapr-prom-prometheus-alertmanager-749cc46f6-9b5t8   2/2     Running      0          4m58s
dapr-prom-prometheus-node-exporter-5jh8p            1/1     Running      0          4m58s
dapr-prom-prometheus-node-exporter-88gbg            1/1     Running      0          4m58s
dapr-prom-prometheus-node-exporter-bjp9f            1/1     Running      0          4m58s
dapr-prom-prometheus-pushgateway-688665d597-h4xx2   1/1     Running      0          4m58s
dapr-prom-prometheus-server-694fd8d7c-q5d59         2/2     Running      0          4m58s
grafana-c49889cff-x56vj                             1/1     Running      0          5m10s
Configure Prometheus as data source
First you need to connect Prometheus as a data source to Grafana.
-
Port-forward to svc/grafana:
kubectl port-forward svc/grafana 8080:80 -n dapr-monitoring Forwarding from 127.0.0.1:8080 -> 3000 Forwarding from [::1]:8080 -> 3000 Handling connection for 8080 Handling connection for 8080 -
Open a browser to
http://localhost:8080 -
Login to Grafana
- Username =
admin - Password = Password from above
- Username =
-
Select
ConfigurationandData Sources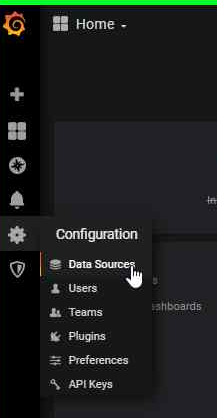
-
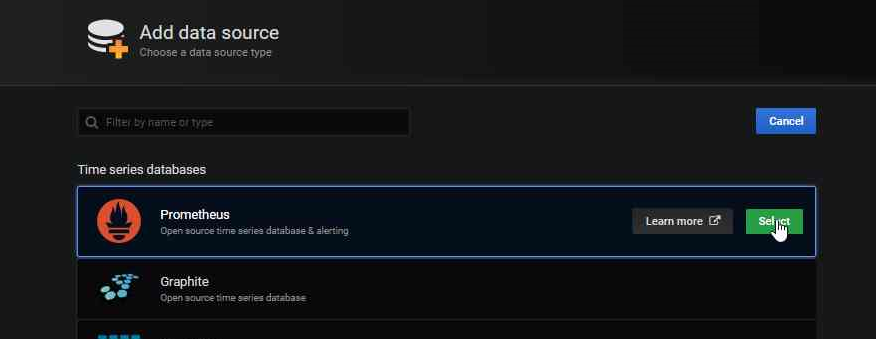
Add Prometheus as a data source.
-
Get your Prometheus HTTP URL
The Prometheus HTTP URL follows the format
http://<prometheus service endpoint>.<namespace>Start by getting the Prometheus server endpoint by running the following command:
kubectl get svc -n dapr-monitoring

NAME                                 TYPE        CLUSTER-IP        EXTERNAL-IP   PORT(S)             AGE
dapr-prom-kube-state-metrics         ClusterIP   10.0.174.177      <none>        8080/TCP            7d9h
dapr-prom-prometheus-alertmanager    ClusterIP   10.0.255.199      <none>        80/TCP              7d9h
dapr-prom-prometheus-node-exporter   ClusterIP   None              <none>        9100/TCP            7d9h
dapr-prom-prometheus-pushgateway     ClusterIP   10.0.190.59       <none>        9091/TCP            7d9h
dapr-prom-prometheus-server          ClusterIP   10.0.172.191      <none>        80/TCP              7d9h
elasticsearch-master                 ClusterIP   10.0.36.146       <none>        9200/TCP,9300/TCP   7d10h
elasticsearch-master-headless        ClusterIP   None              <none>        9200/TCP,9300/TCP   7d10h
grafana                              ClusterIP   10.0.15.229       <none>        80/TCP              5d5h
kibana-kibana                        ClusterIP   10.0.188.224      <none>        5601/TCP            7d10h
In this guide the server name is
dapr-prom-prometheus-serverand the namespace isdapr-monitoring, so the HTTP URL will behttp://dapr-prom-prometheus-server.dapr-monitoring. -
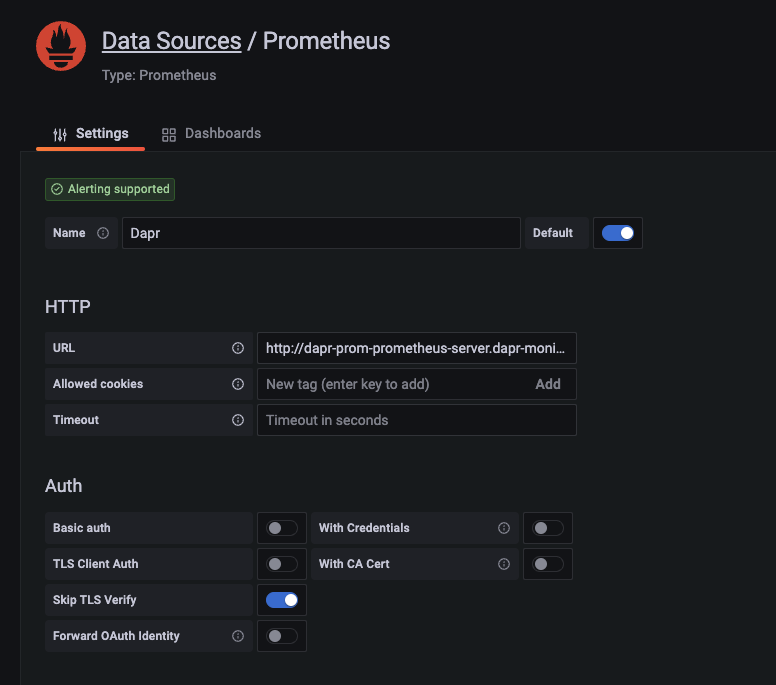
Fill in the following settings:
- Name:
Dapr - HTTP URL:
http://dapr-prom-prometheus-server.dapr-monitoring - Default: On
- Skip TLS Verify: On
- Necessary in order to save and test the configuration
- Name:
-
Click
Save & Testbutton to verify that the connection succeeded.
Import dashboards in Grafana
-
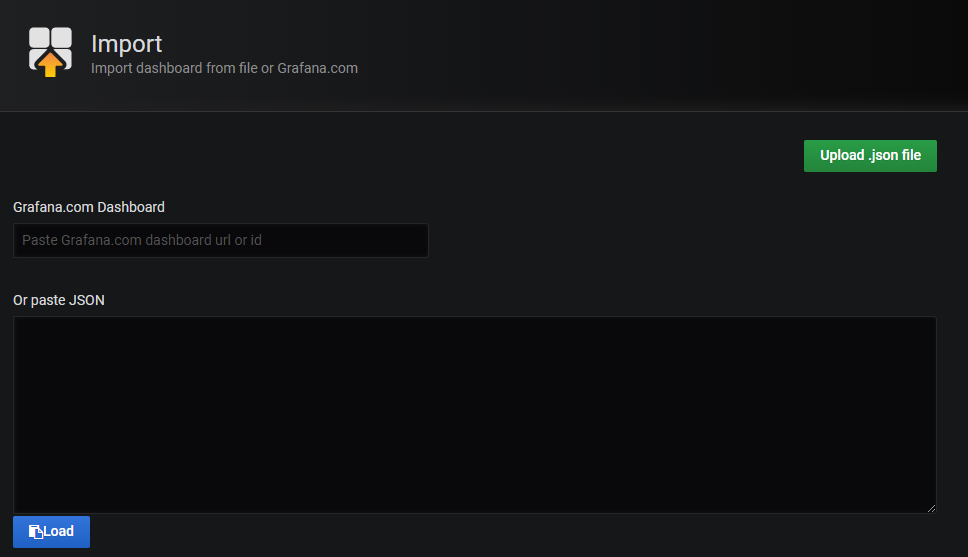
In the upper left corner of the Grafana home screen, click the “+” option, then “Import”.
You can now import Grafana dashboard templates from release assets for your Dapr version:
-
Find the dashboard that you imported and enjoy
Tip
Hover your mouse over the
iin the corner to the description of each chart: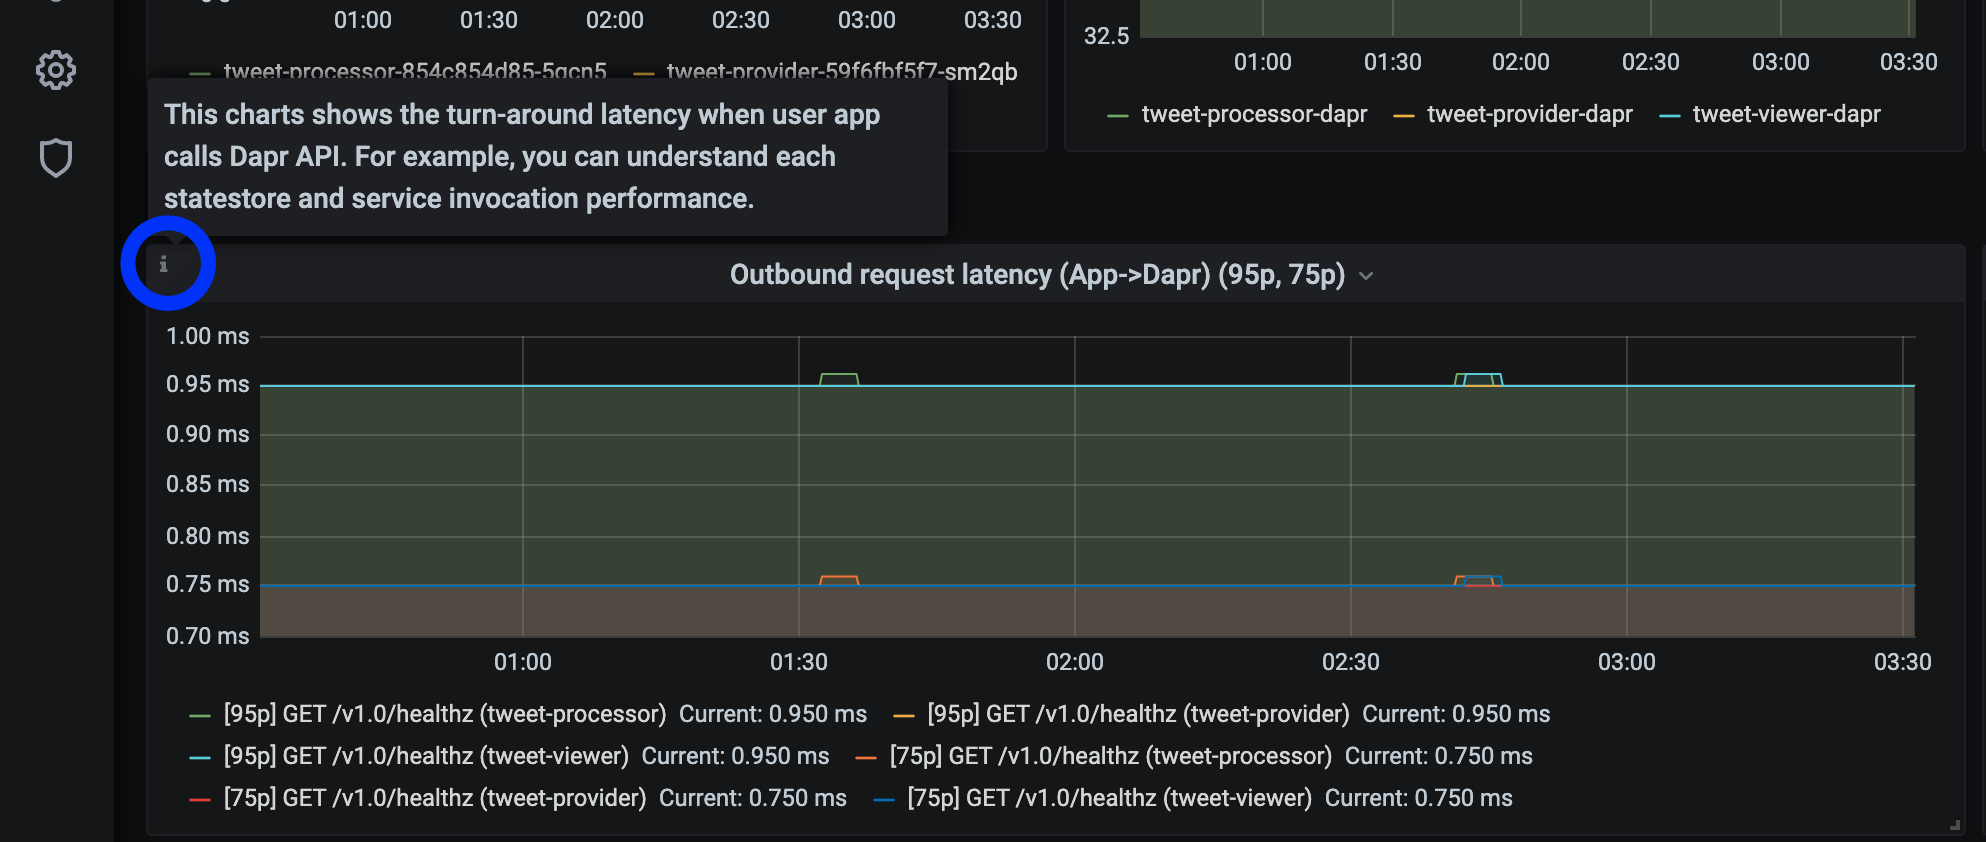
References
- Dapr Observability
- Prometheus Installation
- Prometheus on Kubernetes
- Prometheus Query Language
- Supported Dapr metrics
Example
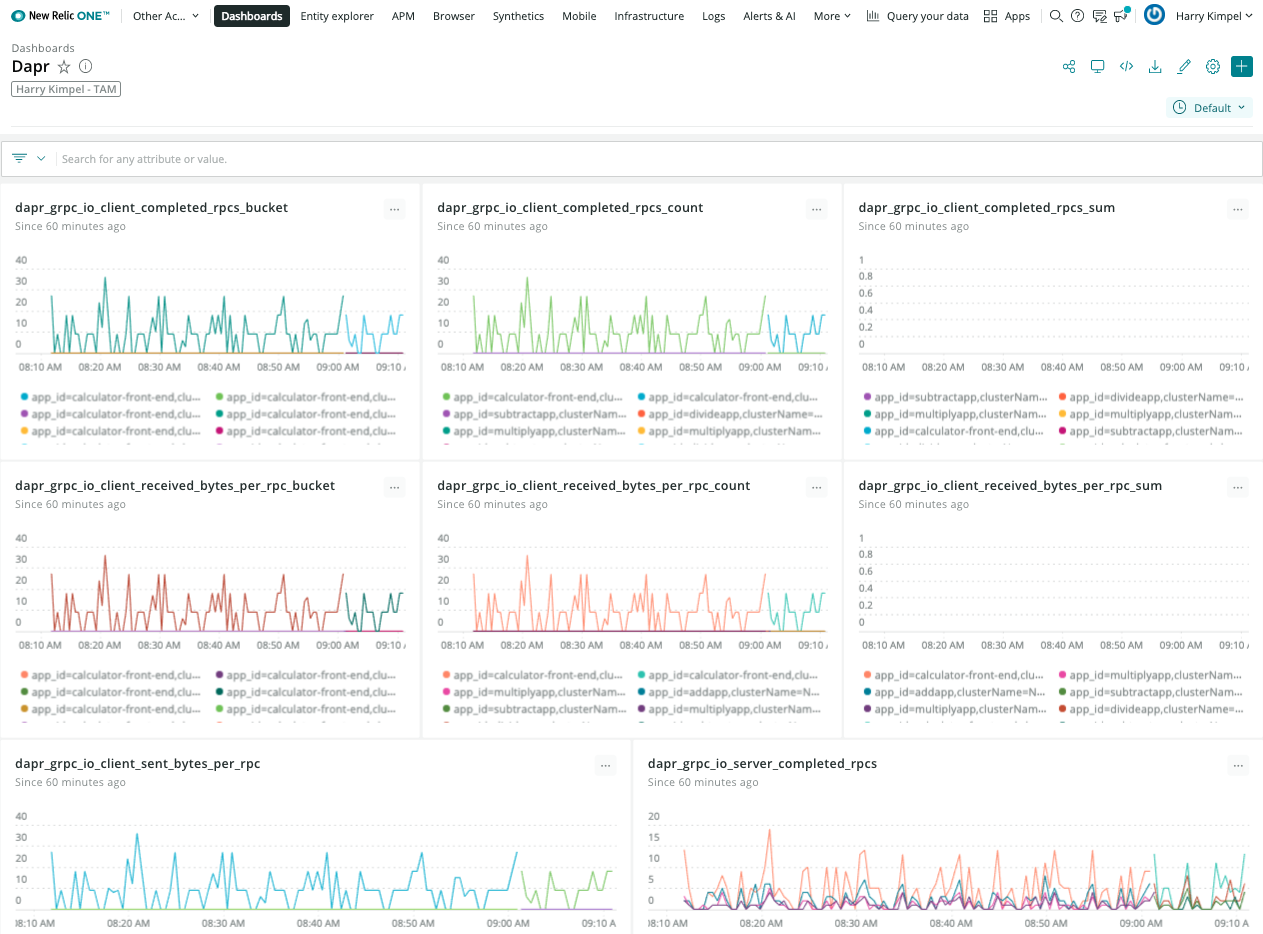
4 - How-To: Set-up New Relic to collect and analyze metrics
Prerequisites
- Perpetually free New Relic account, 100 GB/month of free data ingest, 1 free full access user, unlimited free basic users
Background
New Relic offers a Prometheus OpenMetrics Integration.
This document explains how to install it in your cluster, either using a Helm chart (recommended).
Installation
-
Install Helm following the official instructions.
-
Add the New Relic official Helm chart repository following these instructions
-
Run the following command to install the New Relic Logging Kubernetes plugin via Helm, replacing the placeholder value YOUR_LICENSE_KEY with your New Relic license key:
helm install nri-prometheus newrelic/nri-prometheus --set licenseKey=YOUR_LICENSE_KEY
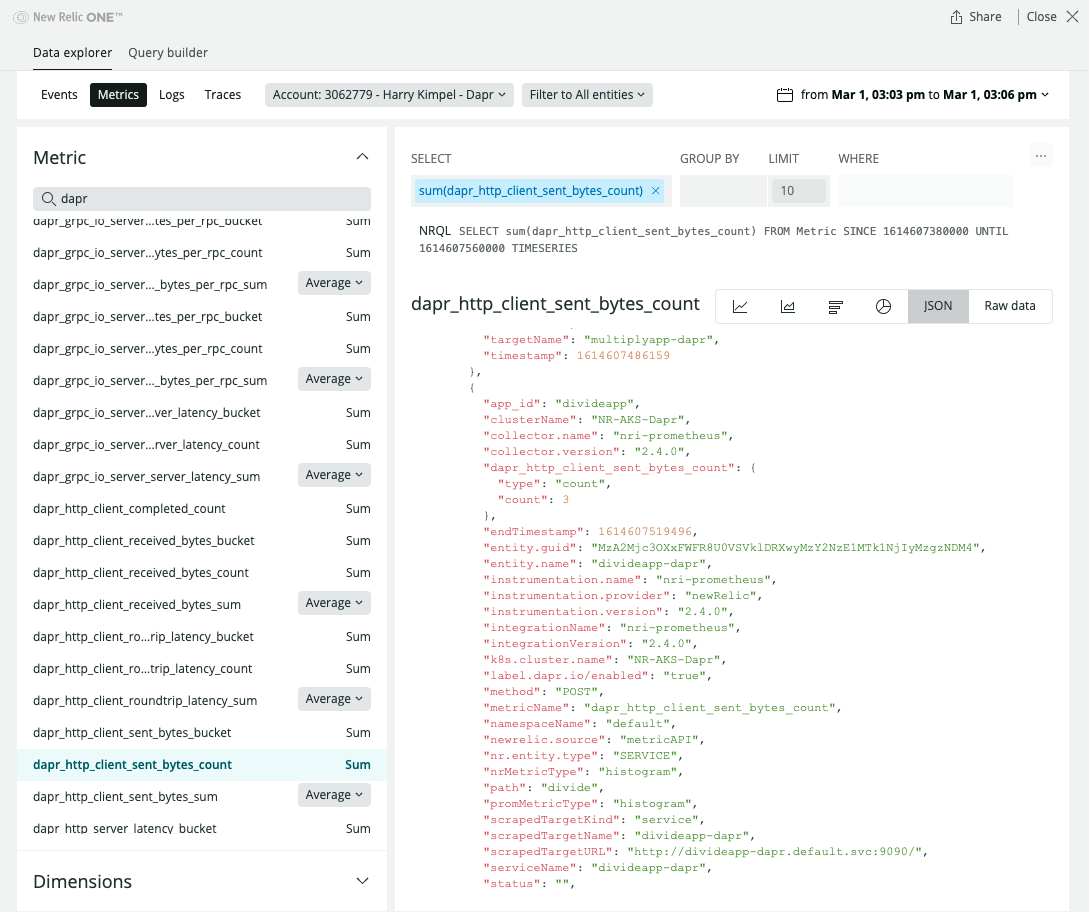
View Metrics
Related Links/References
5 - How-To: Set up Azure Monitor to search logs and collect metrics
Prerequisites
Enable Prometheus metric scrape using config map
-
Make sure that Azure Monitor Agents (AMA) are running.
$ kubectl get pods -n kube-system NAME READY STATUS RESTARTS AGE ... ama-logs-48kpv 2/2 Running 0 2d13h ama-logs-mx24c 2/2 Running 0 2d13h ama-logs-rs-f9bbb9898-vbt6k 1/1 Running 0 30h ama-logs-sm2mz 2/2 Running 0 2d13h ama-logs-z7p4c 2/2 Running 0 2d13h ... -
Apply config map to enable Prometheus metrics endpoint scrape.
You can use azm-config-map.yaml to enable Prometheus metrics endpoint scrape.
If you installed Dapr to a different namespace, you need to change the monitor_kubernetes_pod_namespaces array values. For example:
...
  prometheus-data-collection-settings: |-
    [prometheus_data_collection_settings.cluster]
        interval = "1m"
        monitor_kubernetes_pods = true
        monitor_kubernetes_pods_namespaces = ["dapr-system", "default"]
    [prometheus_data_collection_settings.node]
        interval = "1m"
...
Apply config map:
kubectl apply -f ./azm-config.map.yaml
Install Dapr with JSON formatted logs
-
Install Dapr with enabling JSON-formatted logs.
helm install dapr dapr/dapr --namespace dapr-system --set global.logAsJson=true -
Enable JSON formatted log in Dapr sidecar and add Prometheus annotations.
Note: The Azure Monitor Agents (AMA) only sends the metrics if the Prometheus annotations are set.
Add dapr.io/log-as-json: "true" annotation to your deployment yaml.
Example:
apiVersion: apps/v1
kind: Deployment
metadata:
  name: pythonapp
  namespace: default
  labels:
    app: python
spec:
  replicas: 1
  selector:
    matchLabels:
      app: python
  template:
    metadata:
      labels:
        app: python
      annotations:
        dapr.io/enabled: "true"
        dapr.io/app-id: "pythonapp"
        dapr.io/log-as-json: "true"
        prometheus.io/scrape: "true"
        prometheus.io/port: "9090"
        prometheus.io/path: "/"

...
Search metrics and logs with Azure Monitor
-
Go to Azure Monitor in the Azure portal.
-
Search Dapr Logs.
Here is an example query, to parse JSON formatted logs and query logs from Dapr system processes.
ContainerLog
| extend parsed=parse_json(LogEntry)
| project Time=todatetime(parsed['time']), app_id=parsed['app_id'], scope=parsed['scope'],level=parsed['level'], msg=parsed['msg'], type=parsed['type'], ver=parsed['ver'], instance=parsed['instance']
| where level != ""
| sort by Time
- Search Metrics.
This query, queries process_resident_memory_bytes Prometheus metrics for Dapr system processes and renders timecharts.
InsightsMetrics
| where Namespace == "prometheus" and Name == "process_resident_memory_bytes"
| extend tags=parse_json(Tags)
| project TimeGenerated, Name, Val, app=tostring(tags['app'])
| summarize memInBytes=percentile(Val, 99) by bin(TimeGenerated, 1m), app
| where app startswith "dapr-"
| render timechart