This is the multi-page printable view of this section. Click here to print.
Logging
1 - Logs
Dapr produces structured logs to stdout, either in plain-text or JSON-formatted. By default, all Dapr processes (runtime, or sidecar, and all control plane services) write logs to the console (stdout) in plain-text. To enable JSON-formatted logging, you need to add the --log-as-json command flag when running Dapr processes.
Note
If you want to use a search engine such as Elastic Search or Azure Monitor to search the logs, it is strongly recommended to use JSON-formatted logs which the log collector and search engine can parse using the built-in JSON parser.Log schema
Dapr produces logs based on the following schema:
| Field | Description | Example |
|---|---|---|
| time | ISO8601 Timestamp | 2011-10-05T14:48:00.000Z |
| level | Log Level (info/warn/debug/error) | info |
| type | Log Type | log |
| msg | Log Message | hello dapr! |
| scope | Logging Scope | dapr.runtime |
| instance | Container Name | dapr-pod-xxxxx |
| app_id | Dapr App ID | dapr-app |
| ver | Dapr Runtime Version | 1.9.0 |
API logging may add other structured fields, as described in the documentation for API logging.
Plain text and JSON formatted logs
- Plain-text log examples
time="2022-11-01T17:08:48.303776-07:00" level=info msg="starting Dapr Runtime -- version 1.9.0 -- commit v1.9.0-g5dfcf2e" instance=dapr-pod-xxxx scope=dapr.runtime type=log ver=1.9.0
time="2022-11-01T17:08:48.303913-07:00" level=info msg="log level set to: info" instance=dapr-pod-xxxx scope=dapr.runtime type=log ver=1.9.0
- JSON-formatted log examples
{"instance":"dapr-pod-xxxx","level":"info","msg":"starting Dapr Runtime -- version 1.9.0 -- commit v1.9.0-g5dfcf2e","scope":"dapr.runtime","time":"2022-11-01T17:09:45.788005Z","type":"log","ver":"1.9.0"}
{"instance":"dapr-pod-xxxx","level":"info","msg":"log level set to: info","scope":"dapr.runtime","time":"2022-11-01T17:09:45.788075Z","type":"log","ver":"1.9.0"}
Log formats
Dapr supports printing either plain-text, the default, or JSON-formatted logs.
To use JSON-formatted logs, you need to add additional configuration options when you install Dapr and when deploy your apps. The recommendation is to use JSON-formatted logs because most log collectors and search engines can parse JSON more easily with built-in parsers.
Enabling JSON logging with the Dapr CLI
When using the Dapr CLI to run an application, pass the --log-as-json option to enable JSON-formatted logs, for example:
dapr run \
  --app-id orderprocessing \
  --resources-path ./components/ \
  --log-as-json \
    -- python3 OrderProcessingService.py
Enabling JSON logging in Kubernetes
The following steps describe how to configure JSON-formatted logs for Kubernetes
Dapr control plane
All services in the Dapr control plane (such as operator, sentry, etc) support a --log-as-json option to enable JSON-formatted logging.
If you’re deploying Dapr to Kubernetes using a Helm chart, you can enable JSON-formatted logs for Dapr system services by passing the --set global.logAsJson=true option; for example:
helm upgrade --install dapr \
  dapr/dapr \
  --namespace dapr-system \
  --set global.logAsJson=true
Enable JSON-formatted log for Dapr sidecars
You can enable JSON-formatted logs in Dapr sidecars by adding the dapr.io/log-as-json: "true" annotation to the deployment, for example:
apiVersion: apps/v1
kind: Deployment
metadata:
  name: pythonapp
  labels:
    app: python
spec:
  selector:
    matchLabels:
      app: python
  template:
    metadata:
      labels:
        app: python
      annotations:
        dapr.io/enabled: "true"
        dapr.io/app-id: "pythonapp"
        # This enables JSON-formatted logging
        dapr.io/log-as-json: "true"
...
API Logging
API logging enables you to see the API calls your application makes to the Dapr sidecar, to debug issues or monitor the behavior of your application. You can combine both Dapr API logging with Dapr log events.
See configure and view Dapr Logs and configure and view Dapr API Logs for more information.
Log collectors
If you run Dapr in a Kubernetes cluster, Fluentd is a popular container log collector. You can use Fluentd with a JSON parser plugin to parse Dapr JSON-formatted logs. This how-to shows how to configure Fluentd in your cluster.
If you are using Azure Kubernetes Service, you can use the built-in agent to collect logs with Azure Monitor without needing to install Fluentd.
Search engines
If you use Fluentd, we recommend using Elastic Search and Kibana. This how-to shows how to set up Elastic Search and Kibana in your Kubernetes cluster.
If you are using the Azure Kubernetes Service, you can use Azure Monitor for containers without installing any additional monitoring tools. Also read How to enable Azure Monitor for containers
References
2 - How-To: Set up Fluentd, Elastic search and Kibana in Kubernetes
Prerequisites
Install Elastic search and Kibana
Create a Kubernetes namespace for monitoring tools
kubectl create namespace dapr-monitoringAdd the helm repo for Elastic Search
helm repo add elastic https://helm.elastic.co
helm repo update
Install Elastic Search using Helm
By default, the chart creates 3 replicas which must be on different nodes. If your cluster has fewer than 3 nodes, specify a smaller number of replicas. For example, this sets the number of replicas to 1:
helm install elasticsearch elastic/elasticsearch --version 7.17.3 -n dapr-monitoring --set replicas=1Otherwise:
helm install elasticsearch elastic/elasticsearch --version 7.17.3 -n dapr-monitoringIf you are using minikube or simply want to disable persistent volumes for development purposes, you can do so by using the following command:
helm install elasticsearch elastic/elasticsearch --version 7.17.3 -n dapr-monitoring --set persistence.enabled=false,replicas=1Install Kibana
helm install kibana elastic/kibana --version 7.17.3 -n dapr-monitoringEnsure that Elastic Search and Kibana are running in your Kubernetes cluster
$ kubectl get pods -n dapr-monitoring
NAME                            READY   STATUS    RESTARTS   AGE
elasticsearch-master-0          1/1     Running   0          6m58s
kibana-kibana-95bc54b89-zqdrk   1/1     Running   0          4m21s
Install Fluentd
Install config map and Fluentd as a daemonset
Download these config files:
Note: If you already have Fluentd running in your cluster, please enable the nested json parser so that it can parse JSON-formatted logs from Dapr.
Apply the configurations to your cluster:
kubectl apply -f ./fluentd-config-map.yaml
kubectl apply -f ./fluentd-dapr-with-rbac.yaml
Ensure that Fluentd is running as a daemonset. The number of FluentD instances should be the same as the number of cluster nodes. In the example below, there is only one node in the cluster:
$ kubectl get pods -n kube-system -w
NAME                          READY   STATUS    RESTARTS   AGE
coredns-6955765f44-cxjxk      1/1     Running   0          4m41s
coredns-6955765f44-jlskv      1/1     Running   0          4m41s
etcd-m01                      1/1     Running   0          4m48s
fluentd-sdrld                 1/1     Running   0          14s
Install Dapr with JSON formatted logs
Install Dapr with enabling JSON-formatted logs
helm repo add dapr https://dapr.github.io/helm-charts/
helm repo update
helm install dapr dapr/dapr --namespace dapr-system --set global.logAsJson=true
Enable JSON formatted log in Dapr sidecar
Add the
dapr.io/log-as-json: "true"annotation to your deployment yaml. For example:apiVersion: apps/v1 kind: Deployment metadata: name: pythonapp namespace: default labels: app: python spec: replicas: 1 selector: matchLabels: app: python template: metadata: labels: app: python annotations: dapr.io/enabled: "true" dapr.io/app-id: "pythonapp" dapr.io/log-as-json: "true" ...
Search logs
Note: Elastic Search takes a time to index the logs that Fluentd sends.
Port-forward from localhost to
svc/kibana-kibana$ kubectl port-forward svc/kibana-kibana 5601 -n dapr-monitoring Forwarding from 127.0.0.1:5601 -> 5601 Forwarding from [::1]:5601 -> 5601 Handling connection for 5601 Handling connection for 5601Browse to
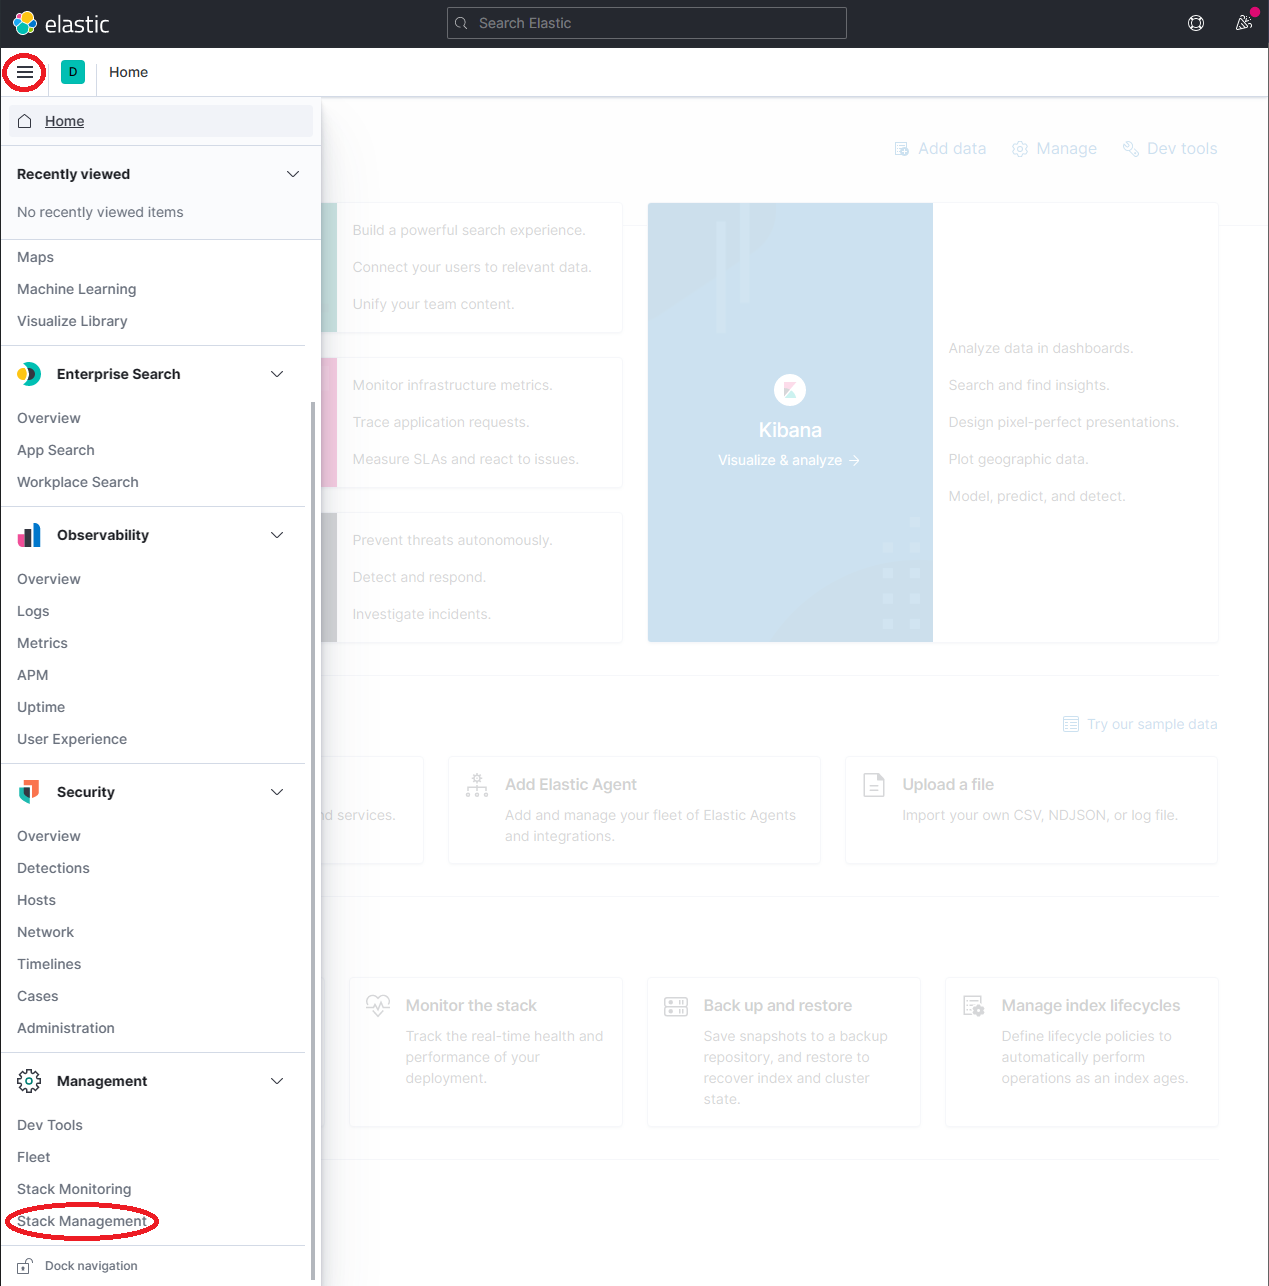
http://localhost:5601Expand the drop-down menu and click Management → Stack Management
On the Stack Management page, select Data → Index Management and wait until
dapr-*is indexed.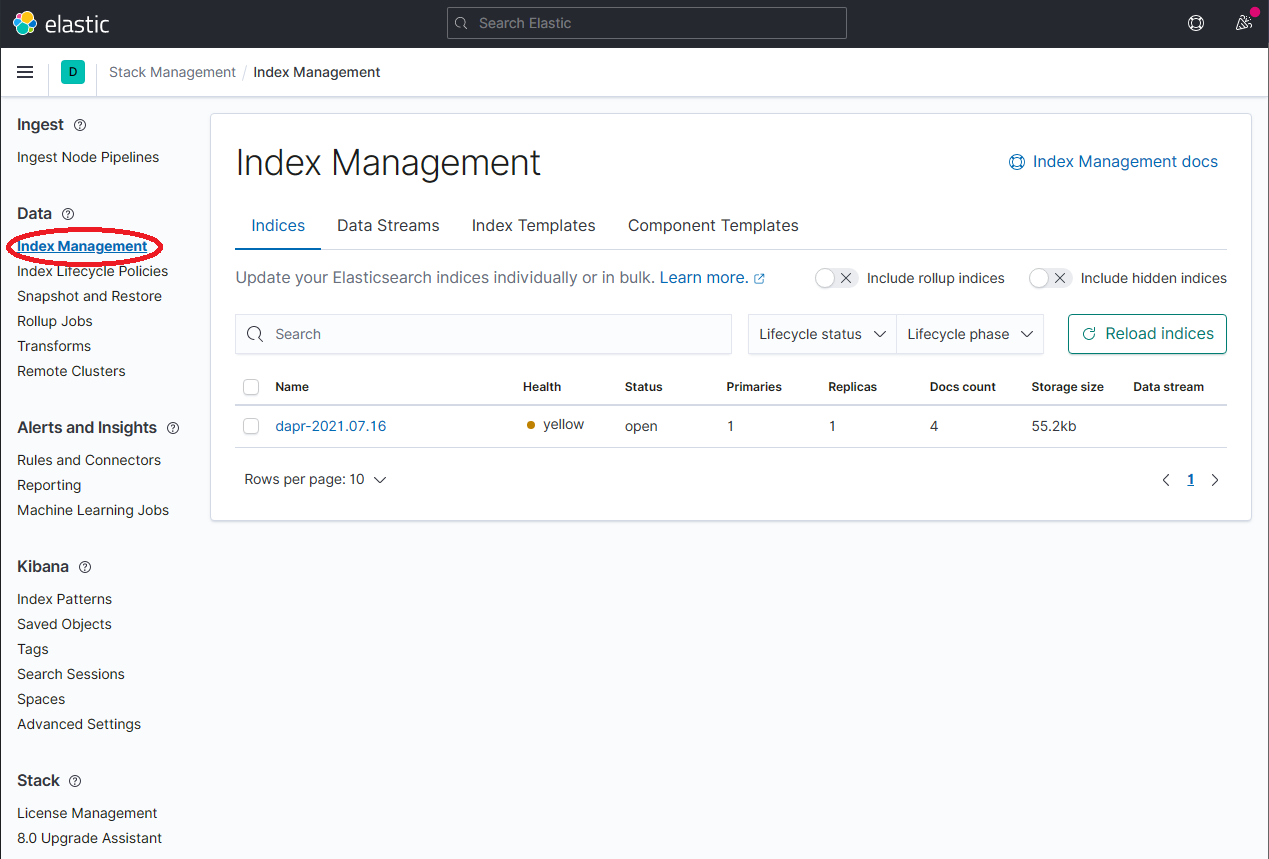
Once
dapr-*is indexed, click on Kibana → Index Patterns and then the Create index pattern button.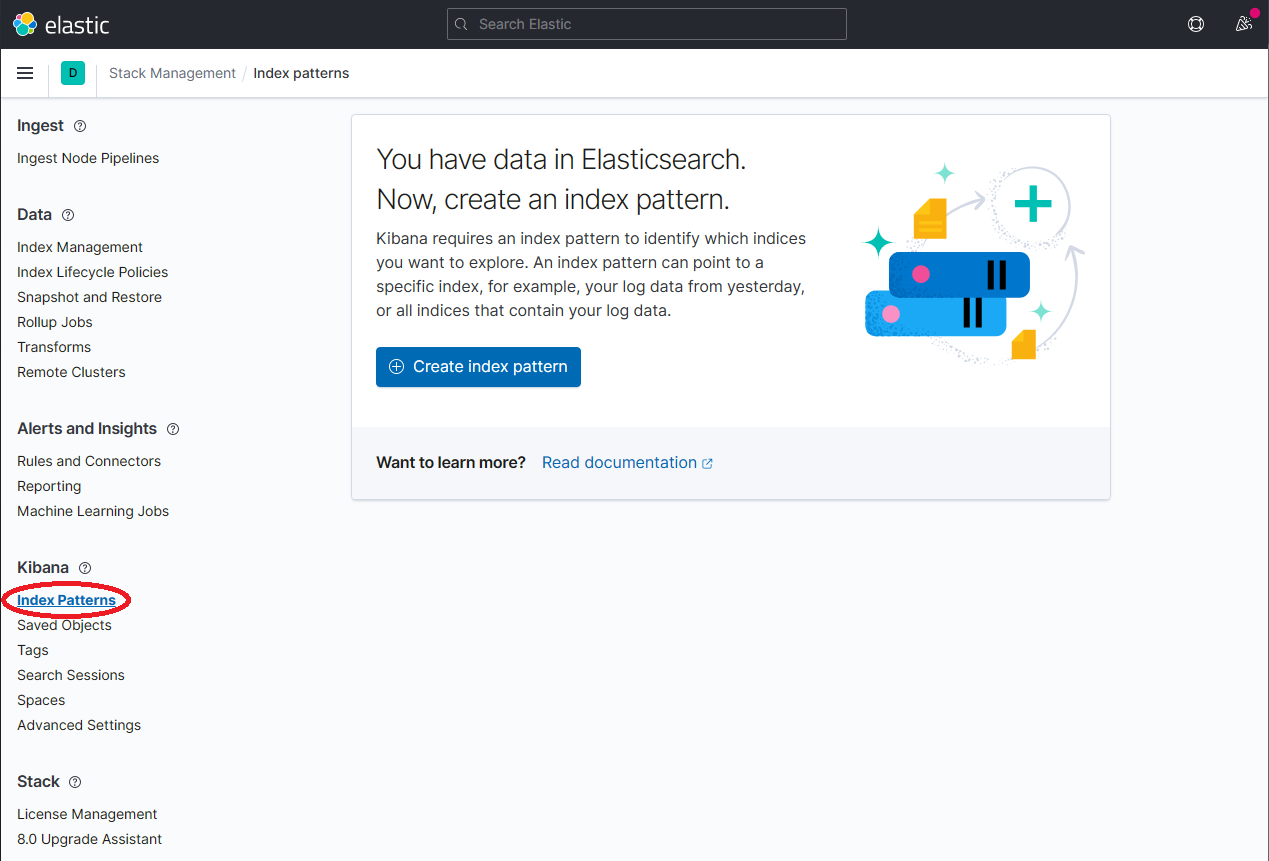
Define a new index pattern by typing
dapr*into the Index Pattern name field, then click the Next step button to continue.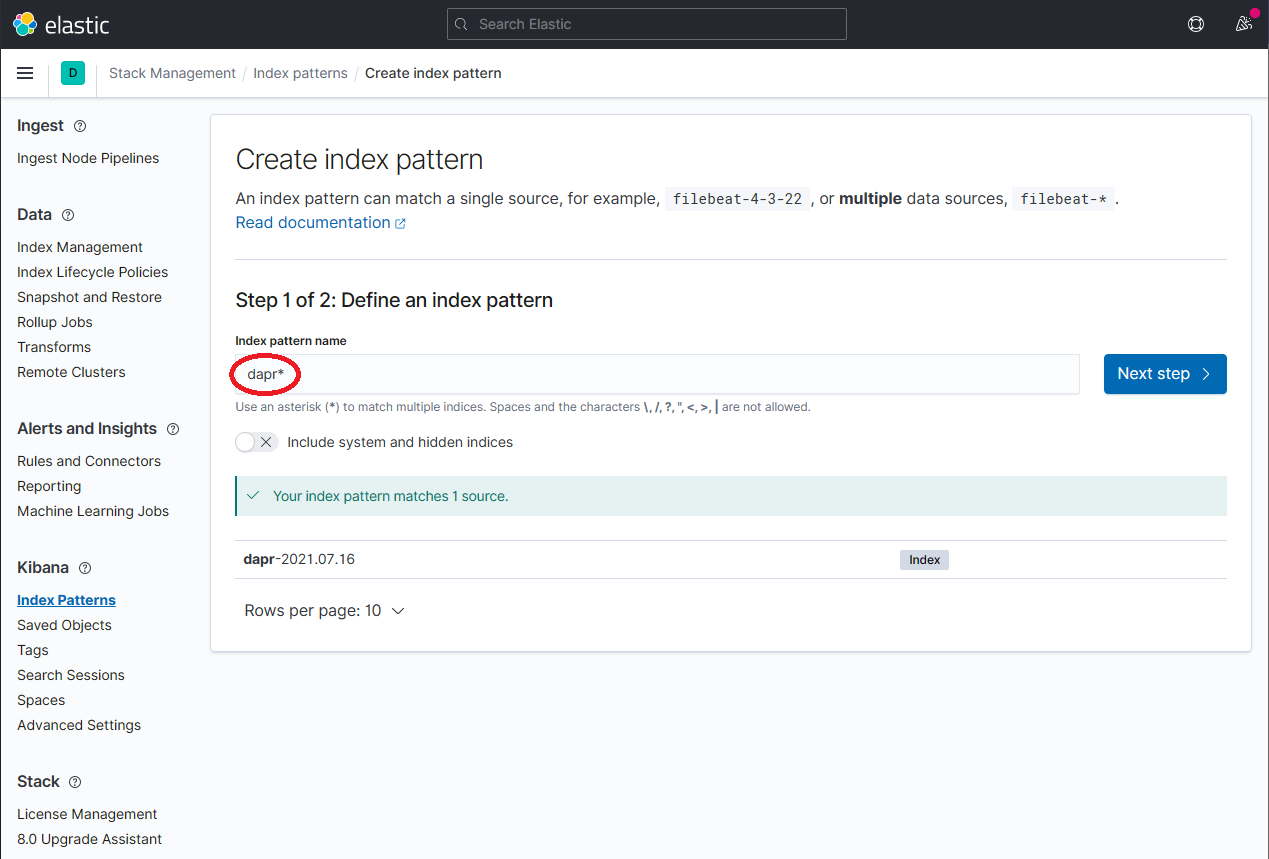
Configure the primary time field to use with the new index pattern by selecting the
@timestampoption from the Time field drop-down. Click the Create index pattern button to complete creation of the index pattern.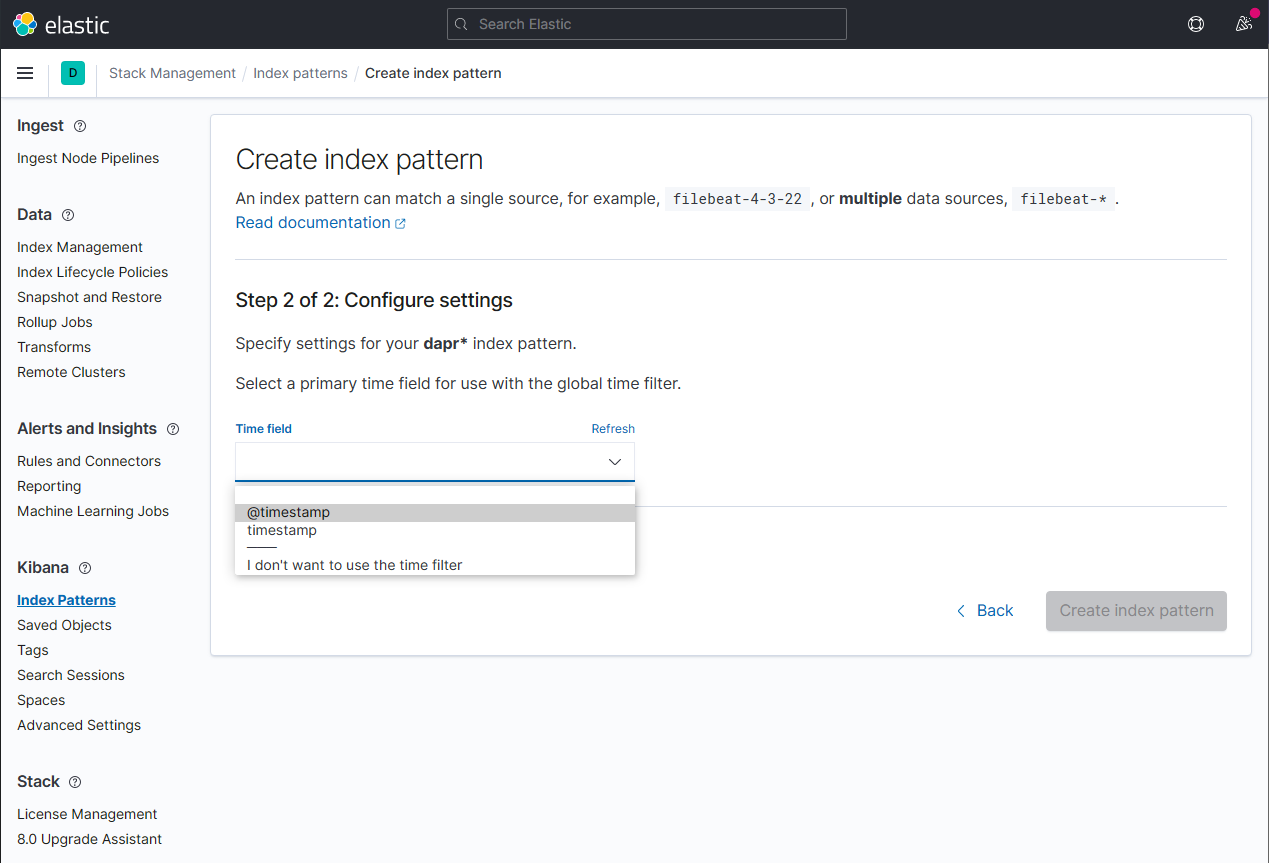
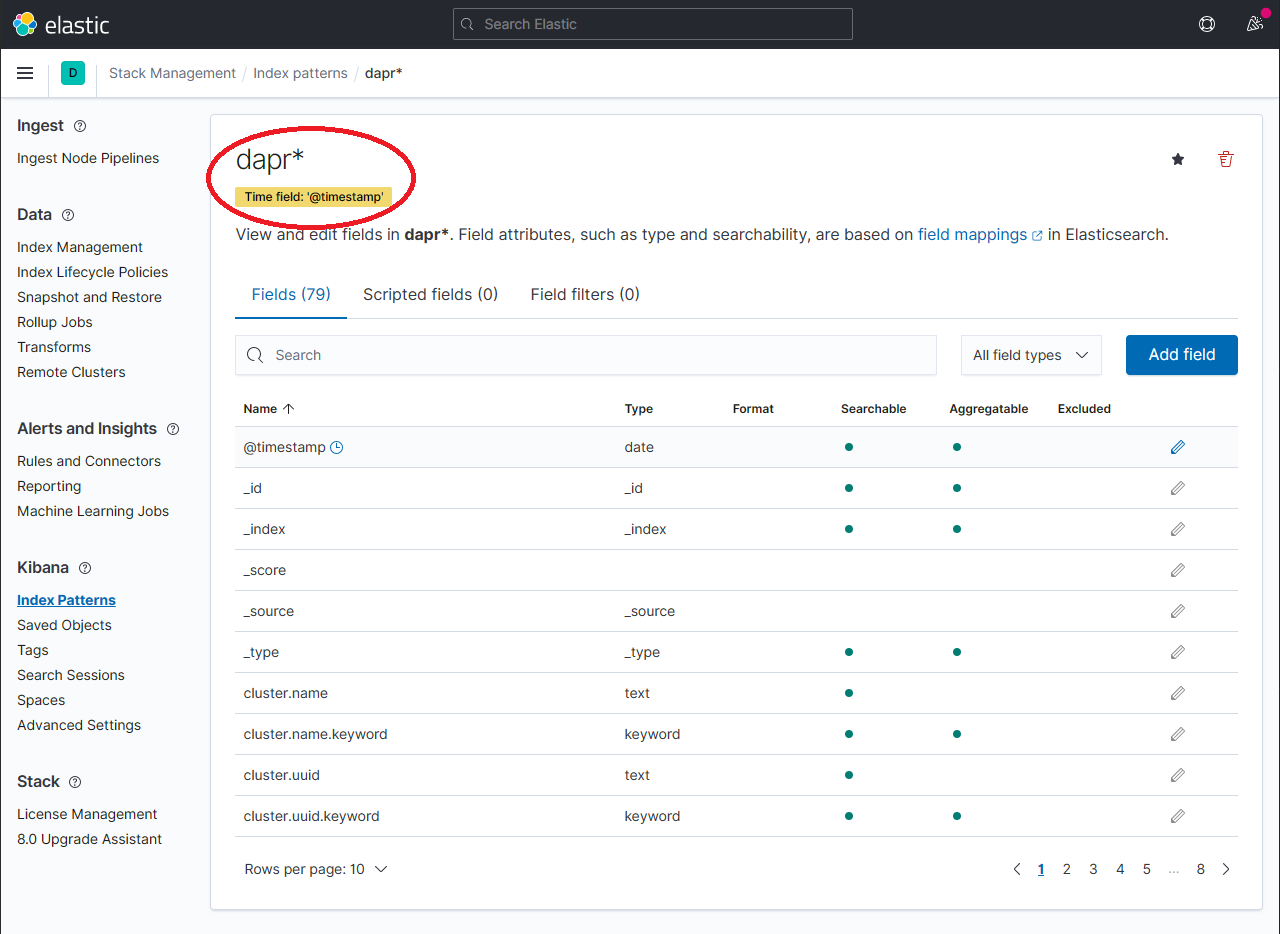
The newly created index pattern should be shown. Confirm that the fields of interest such as
scope,type,app_id,level, etc. are being indexed by using the search box in the Fields tab.Note: If you cannot find the indexed field, please wait. The time it takes to search across all indexed fields depends on the volume of data and size of the resource that the elastic search is running on.
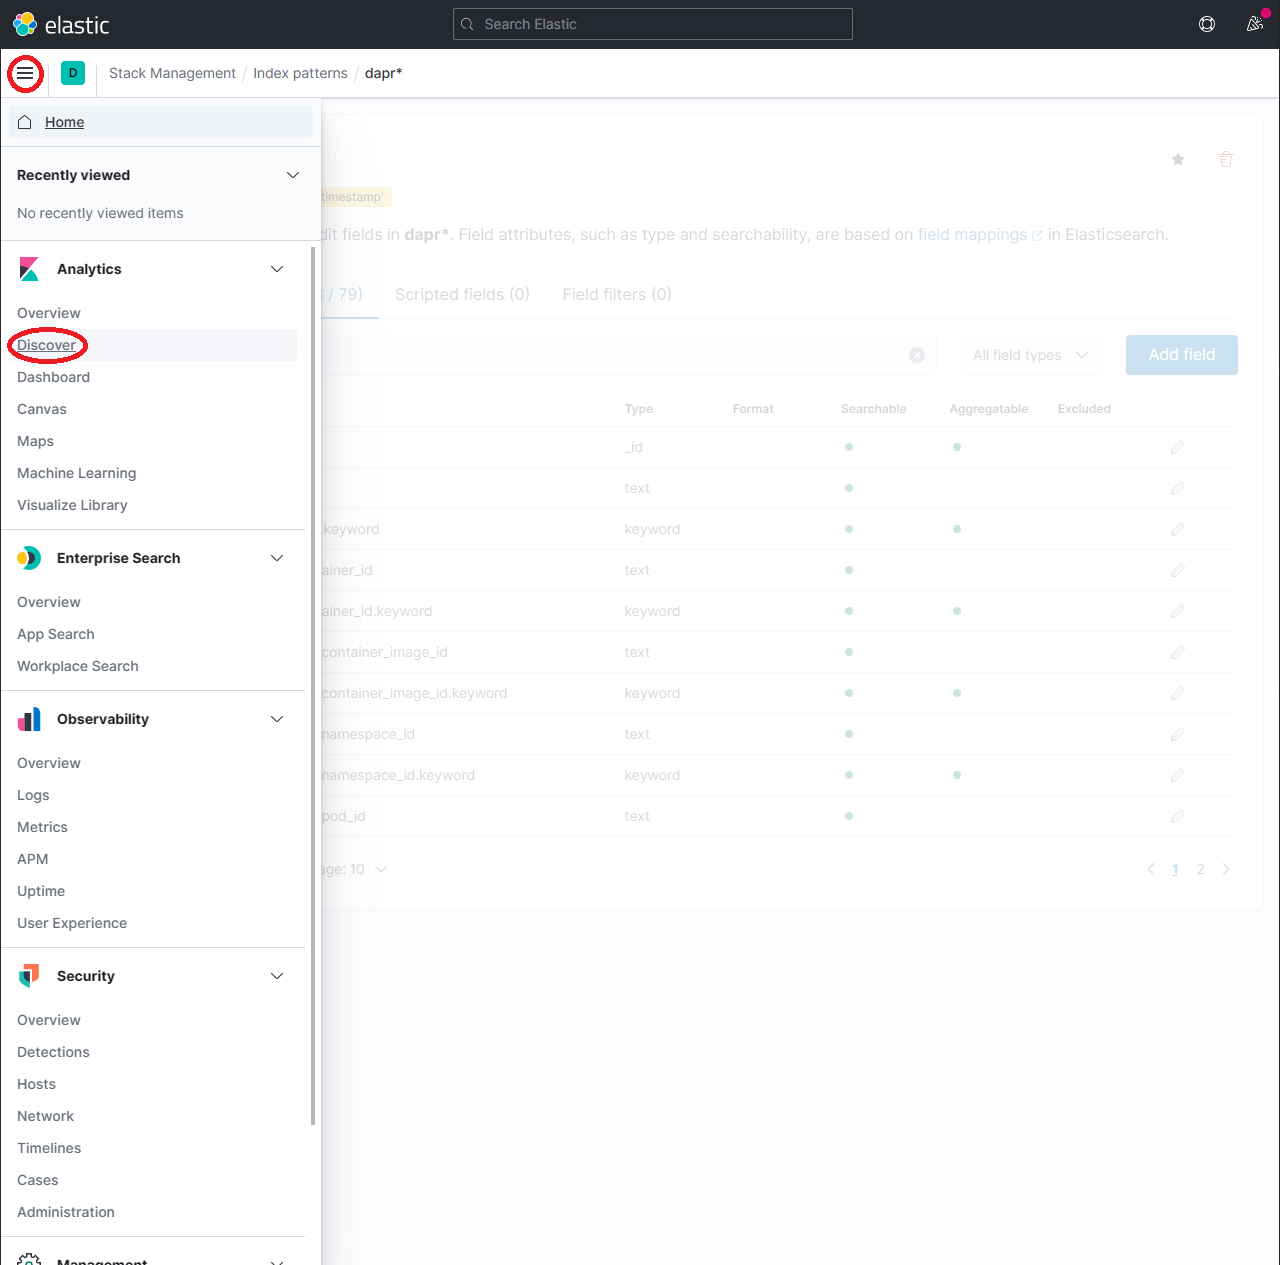
To explore the indexed data, expand the drop-down menu and click Analytics → Discover.
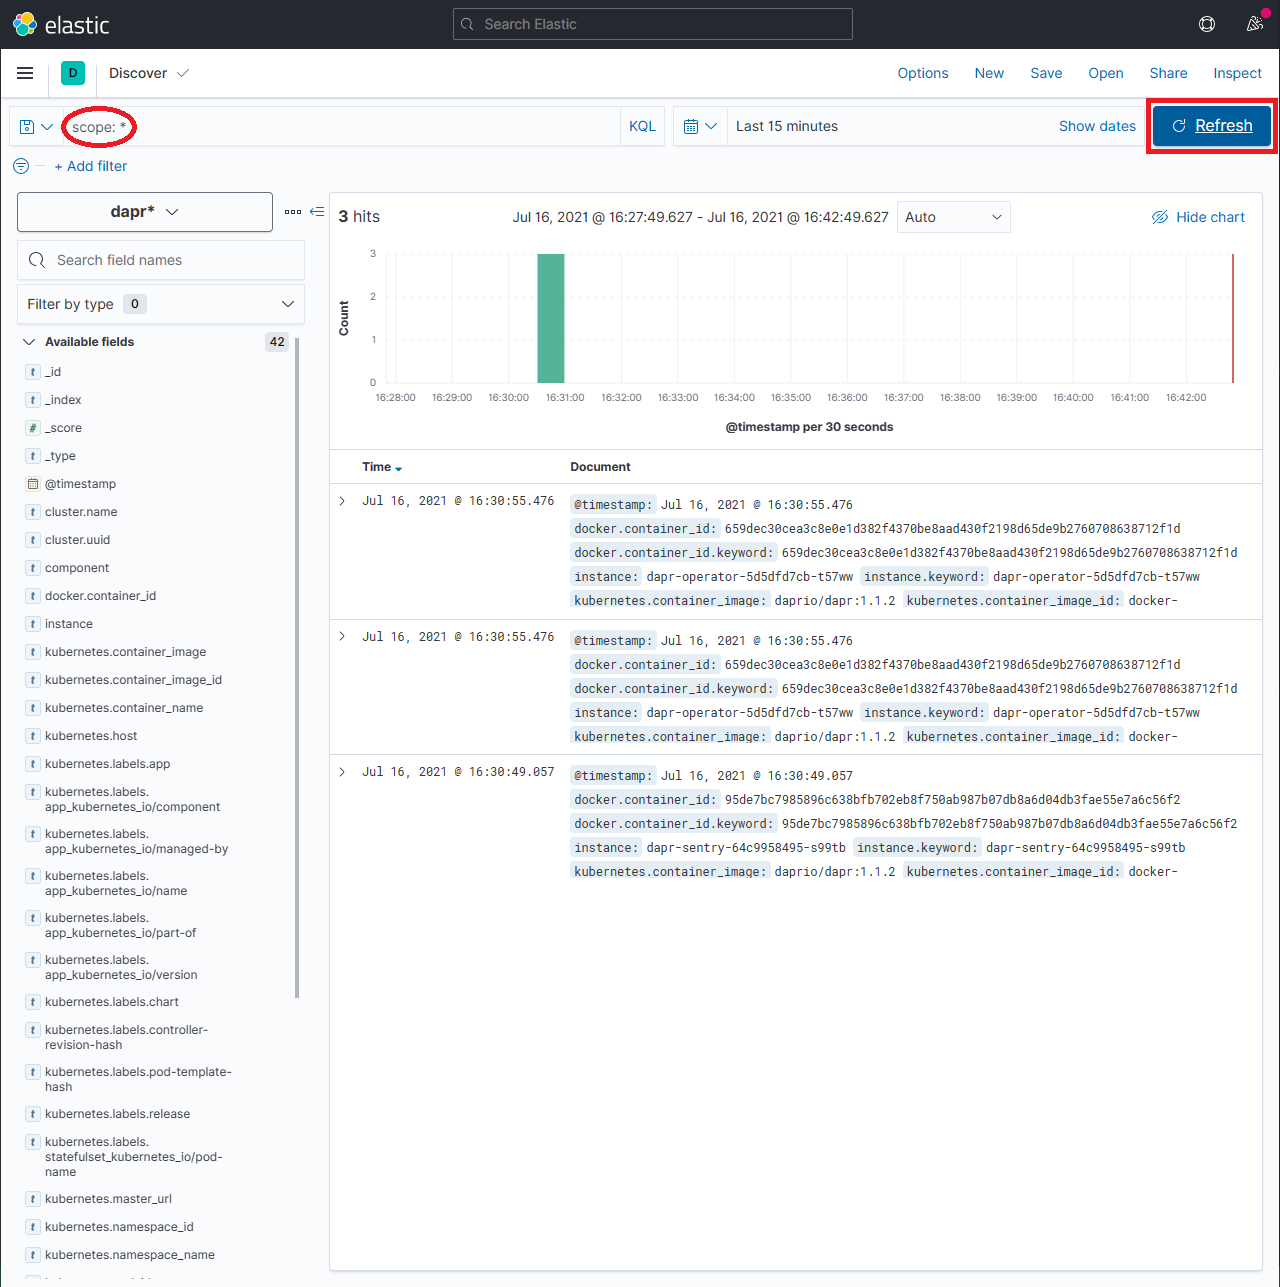
In the search box, type in a query string such as
scope:*and click the Refresh button to view the results.Note: This can take a long time. The time it takes to return all results depends on the volume of data and size of the resource that the elastic search is running on.
References
3 - How-To: Set-up New Relic for Dapr logging
Prerequisites
- Perpetually free New Relic account, 100 GB/month of free data ingest, 1 free full access user, unlimited free basic users
Background
New Relic offers a Fluent Bit output plugin to easily forward your logs to New Relic Logs. This plugin is also provided in a standalone Docker image that can be installed in a Kubernetes cluster in the form of a DaemonSet, which we refer as the Kubernetes plugin.
This document explains how to install it in your cluster, either using a Helm chart (recommended), or manually by applying Kubernetes manifests.
Installation
Install using the Helm chart (recommended)
Install Helm following the official instructions.
Add the New Relic official Helm chart repository following these instructions
Run the following command to install the New Relic Logging Kubernetes plugin via Helm, replacing the placeholder value YOUR_LICENSE_KEY with your New Relic license key:
Helm 3
helm install newrelic-logging newrelic/newrelic-logging --set licenseKey=YOUR_LICENSE_KEYHelm 2
helm install newrelic/newrelic-logging --name newrelic-logging --set licenseKey=YOUR_LICENSE_KEY
For EU users, add `–set endpoint=https://log-api.eu.newrelic.com/log/v1 to any of the helm install commands above.
By default, tailing is set to /var/log/containers/*.log. To change this setting, provide your preferred path by adding –set fluentBit.path=DESIRED_PATH to any of the helm install commands above.
Install the Kubernetes manifest
Download the following 3 manifest files into your current working directory:
curl https://raw.githubusercontent.com/newrelic/helm-charts/master/charts/newrelic-logging/k8s/fluent-conf.yml > fluent-conf.yml
curl https://raw.githubusercontent.com/newrelic/helm-charts/master/charts/newrelic-logging/k8s/new-relic-fluent-plugin.yml > new-relic-fluent-plugin.yml
curl https://raw.githubusercontent.com/newrelic/helm-charts/master/charts/newrelic-logging/k8s/rbac.yml > rbac.yml
In the downloaded new-relic-fluent-plugin.yml file, replace the placeholder value LICENSE_KEY with your New Relic license key.
For EU users, replace the ENDPOINT environment variable to https://log-api.eu.newrelic.com/log/v1.
Once the License key has been added, run the following command in your terminal or command-line interface:
kubectl apply -f .[OPTIONAL] You can configure how the plugin parses the data by editing the parsers.conf section in the fluent-conf.yml file. For more information, see Fluent Bit’s documentation on Parsers configuration.
By default, tailing is set to /var/log/containers/*.log. To change this setting, replace the default path with your preferred path in the new-relic-fluent-plugin.yml file.
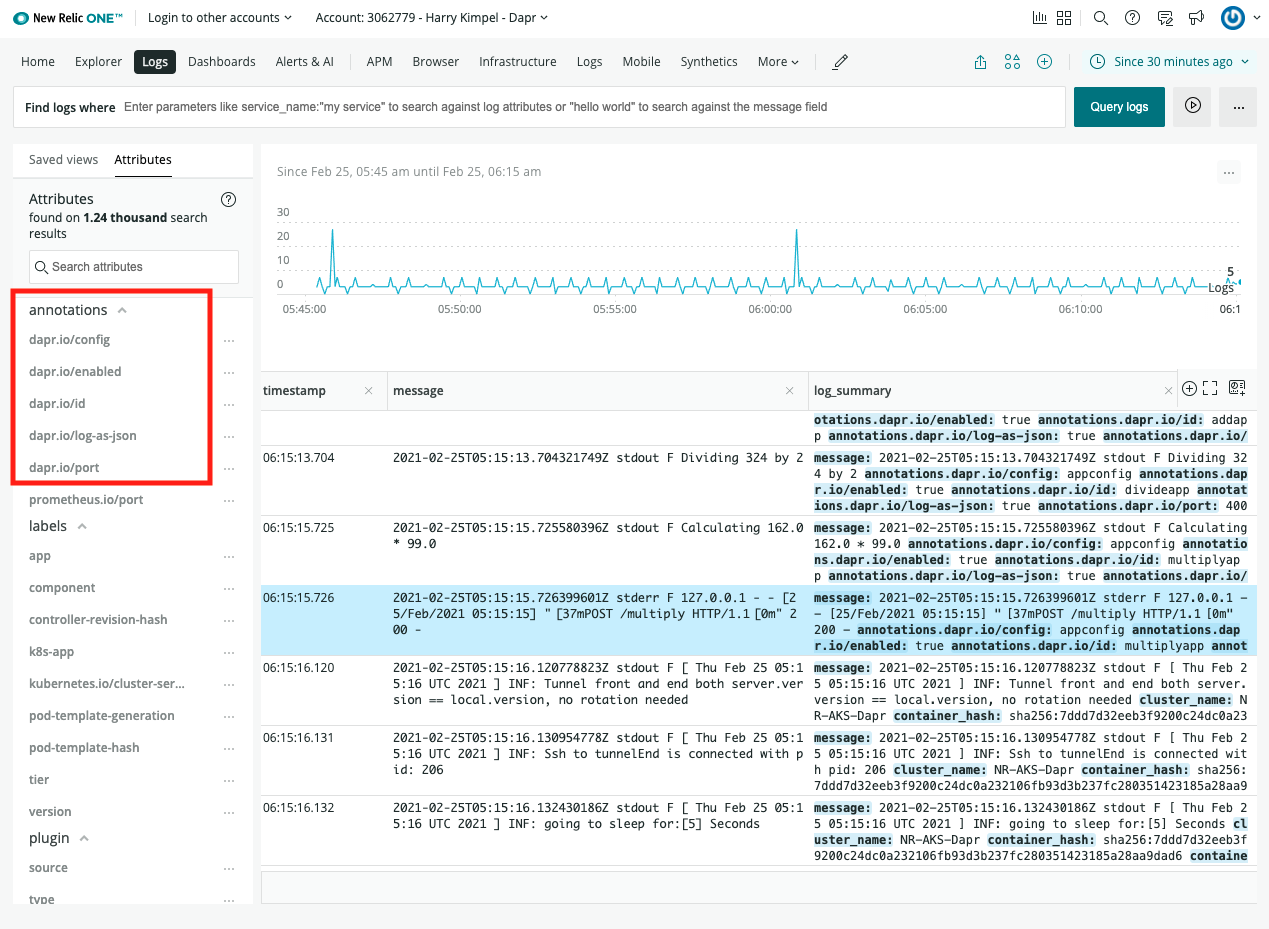
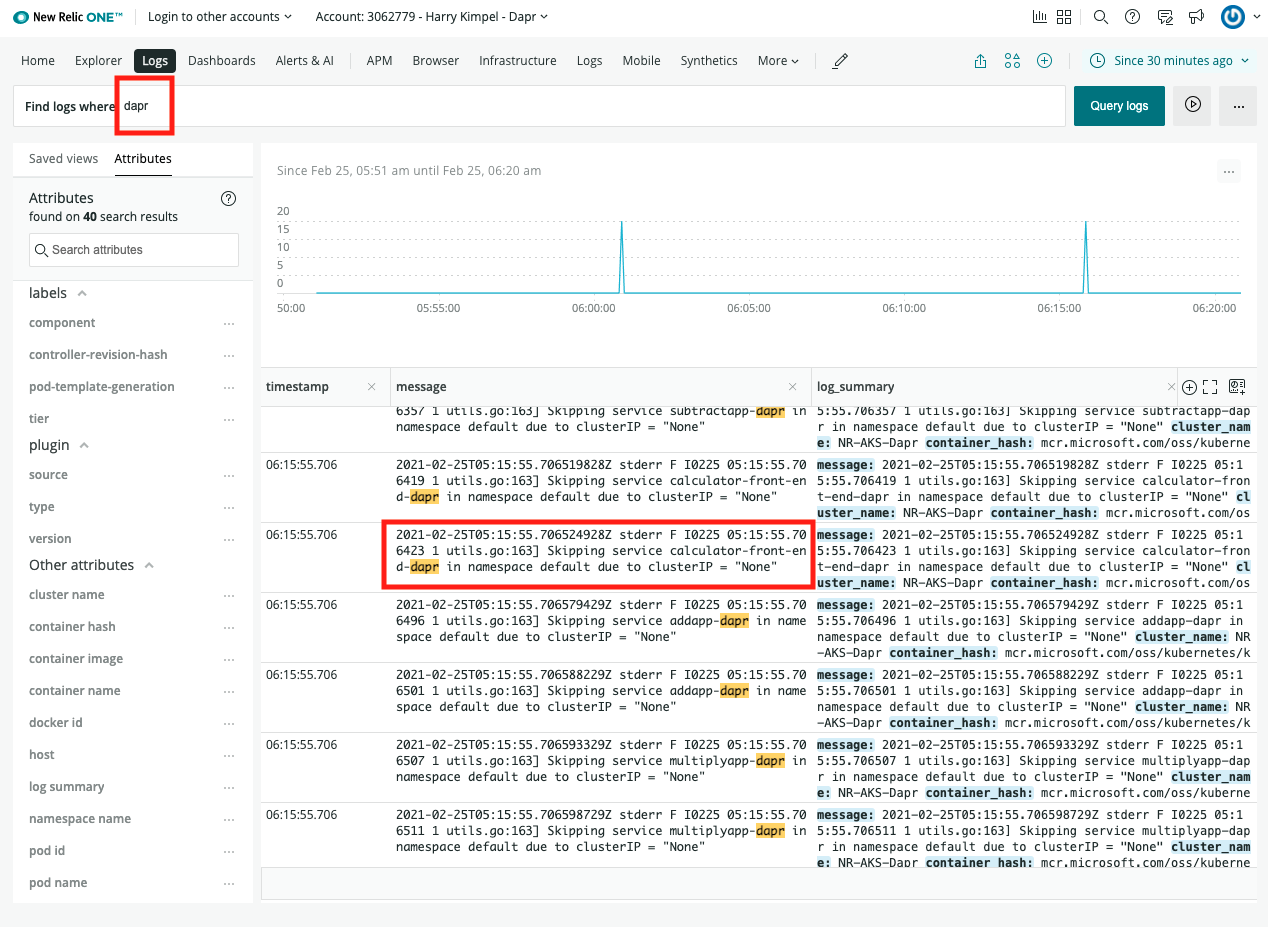
View Logs