Learn about tracing scenarios and how to use tracing for visibility in your application
1.1 - Distributed tracing overview
Overview on using tracing to get visibility into your application
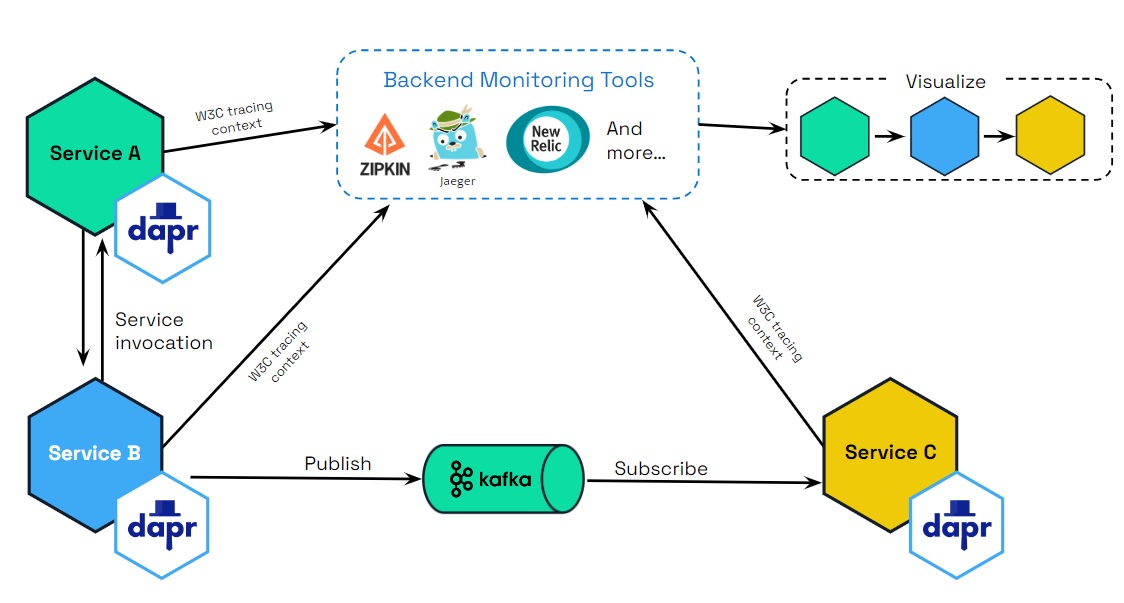
Dapr uses the Open Telemetry (OTEL) and Zipkin protocols for distributed traces. OTEL is the industry standard and is the recommended trace protocol to use.
The following diagram demonstrates how Dapr (using OTEL and Zipkin protocols) integrates with multiple observability tools.
Scenarios
Tracing is used with service invocaton and pub/sub APIs. You can flow trace context between services that uses these APIs. There are two scenarios for how tracing is used:
Dapr generates the trace context and you propagate the trace context to another service.
You generate the trace context and Dapr propagates the trace context to a service.
Scenario 1: Dapr generates trace context headers
Propagating sequential service calls
Dapr takes care of creating the trace headers. However, when there are more than two services, you’re responsible for propagating the trace headers between them. Let’s go through the scenarios with examples:
Single service invocation call
For example, service A -> service B.
Dapr generates the trace headers in service A, which are then propagated from service A to service B. No further propagation is needed.
Multiple sequential service invocation calls
For example, service A -> service B -> propagate trace headers to -> service C and so on to further Dapr-enabled services.
Dapr generates the trace headers at the beginning of the request in service A, which are then propagated to service B. You are now responsible for taking the headers and propagating them to service C, since this is specific to your application.
In other words, if the app is calling to Dapr and wants to trace with an existing trace header (span), it must always propagate to Dapr (from service B to service C, in this example). Dapr always propagates trace spans to an application.
Note
No helper methods are exposed in Dapr SDKs to propagate and retrieve trace context. You need to use HTTP/gRPC clients to propagate and retrieve trace headers through HTTP headers and gRPC metadata.
Request is from external endpoint
For example, from a gateway service to a Dapr-enabled service A.
An external gateway ingress calls Dapr, which generates the trace headers and calls service A. Service A then calls service B and further Dapr-enabled services.
You must propagate the headers from service A to service B. For example: Ingress -> service A -> propagate trace headers -> service B. This is similar to case 2.
Pub/sub messages
Dapr generates the trace headers in the published message topic. For rawPayload messages, it is possible to specify the traceparent header to propagate the tracing information. These trace headers are propagated to any services listening on that topic.
Propagating multiple different service calls
In the following scenarios, Dapr does some of the work for you, with you then creating or propagating trace headers.
Multiple service calls to different services from single service
When you are calling multiple services from a single service, you need to propagate the trace headers. For example:
service A -> service B
[ .. some code logic ..]
service A -> service C
[ .. some code logic ..]
service A -> service D
[ .. some code logic ..]
In this case:
When service A first calls service B, Dapr generates the trace headers in service A.
The trace headers in service A are propagated to service B.
These trace headers are returned in the response from service B as part of response headers.
You then need to propagate the returned trace context to the next services, like service C and service D, as Dapr does not know you want to reuse the same header.
Scenario 2: You generate your own trace context headers from non-Daprized applications
Generating your own trace context headers is more unusual and typically not required when calling Dapr.
However, there are scenarios where you could specifically choose to add W3C trace headers into a service call. For example, you have an existing application that does not use Dapr. In this case, Dapr still propagates the trace context headers for you.
If you decide to generate trace headers yourself, there are three ways this can be done:
Standard OpenTelemetry SDK
You can use the industry standard OpenTelemetry SDKs to generate trace headers and pass these trace headers to a Dapr-enabled service. This is the preferred method.
Vendor SDK
You can use a vendor SDK that provides a way to generate W3C trace headers and pass them to a Dapr-enabled service.
Background and scenarios for using W3C tracing context and headers with Dapr
Dapr uses the Open Telemetry protocol, which in turn uses the W3C trace context for distributed tracing for both service invocation and pub/sub messaging. Dapr generates and propagates the trace context information, which can be sent to observability tools for visualization and querying.
Background
Distributed tracing is a methodology implemented by tracing tools to follow, analyze, and debug a transaction across multiple software components.
Typically, a distributed trace traverses more than one service, which requires it to be uniquely identifiable. Trace context propagation passes along this unique identification.
In the past, trace context propagation was implemented individually by each different tracing vendor. In multi-vendor environments, this causes interoperability problems, such as:
Traces collected by different tracing vendors can’t be correlated, as there is no shared unique identifier.
Traces crossing boundaries between different tracing vendors can’t be propagated, as there is no forwarded, uniformly agreed set of identification.
Vendor-specific metadata might be dropped by intermediaries.
Cloud platform vendors, intermediaries, and service providers cannot guarantee to support trace context propagation, as there is no standard to follow.
Previously, most applications were monitored by a single tracing vendor and stayed within the boundaries of a single platform provider, so these problems didn’t have a significant impact.
Today, an increasing number of applications are distributed and leverage multiple middleware services and cloud platforms. This transformation of modern applications requires a distributed tracing context propagation standard.
The W3C trace context specification defines a universally agreed-upon format for the exchange of trace context propagation data (referred to as trace context). Trace context solves the above problems by providing:
A unique identifier for individual traces and requests, allowing trace data of multiple providers to be linked together.
An agreed-upon mechanism to forward vendor-specific trace data and avoid broken traces when multiple tracing tools participate in a single transaction.
An industry standard that intermediaries, platforms, and hardware providers can support.
This unified approach for propagating trace data improves visibility into the behavior of distributed applications, facilitating problem and performance analysis.
W3C trace context and headers format
W3C trace context
Dapr uses the standard W3C trace context headers.
For HTTP requests, Dapr uses traceparent header.
For gRPC requests, Dapr uses grpc-trace-bin header.
When a request arrives without a trace ID, Dapr creates a new one. Otherwise, it passes the trace ID along the call chain.
W3C trace headers
These are the specific trace context headers that are generated and propagated by Dapr for HTTP and gRPC.
Copy these headers when propagating a trace context header from an HTTP response to an HTTP request:
Traceparent header
The traceparent header represents the incoming request in a tracing system in a common format, understood by all vendors:
1.3 - Configure Dapr to send distributed tracing data
Set up Dapr to send distributed tracing data
Note
It is recommended to run Dapr with tracing enabled for any production scenario. You can configure Dapr to send tracing and telemetry data to many observability tools based on your environment, whether it is running in the cloud or on-premises.
Configuration
The tracing section under the Configuration spec contains the following properties:
The following table lists the properties for tracing:
Property
Type
Description
samplingRate
string
Set sampling rate for tracing to be enabled or disabled.
stdout
bool
True write more verbose information to the traces
otel.endpointAddress
string
Set the Open Telemetry (OTEL) target hostname and optionally port. If this is used, you do not need to specify the ‘zipkin’ section.
otel.isSecure
bool
Is the connection to the endpoint address encrypted.
otel.protocol
string
Set to http or grpc protocol.
zipkin.endpointAddress
string
Set the Zipkin server URL. If this is used, you do not need to specify the otel section.
To enable tracing, use a configuration file (in self hosted mode) or a Kubernetes configuration object (in Kubernetes mode). For example, the following configuration object changes the sample rate to 1 (every span is sampled), and sends trace using OTEL protocol to the OTEL server at localhost:4317
Dapr uses probabilistic sampling. The sample rate defines the probability a tracing span will be sampled and can have a value between 0 and 1 (inclusive). The default sample rate is 0.0001 (i.e. 1 in 10,000 spans is sampled).
Changing samplingRate to 0 disables tracing altogether.
Environment variables
The OpenTelemetry (otel) endpoint can also be configured via an environment variables. The presence of the OTEL_EXPORTER_OTLP_ENDPOINT environment variable
turns on tracing for the sidecar.
Environment Variable
Description
OTEL_EXPORTER_OTLP_ENDPOINT
Sets the Open Telemetry (OTEL) server hostname and optionally port, turns on tracing
OTEL_EXPORTER_OTLP_INSECURE
Sets the connection to the endpoint as unencrypted (true/false)
OTEL_EXPORTER_OTLP_PROTOCOL
Transport protocol (grpc, http/protobuf, http/json)
Next steps
Learn how to set up tracing with one of the following tools:
How to set up your observability tools to receive application traces
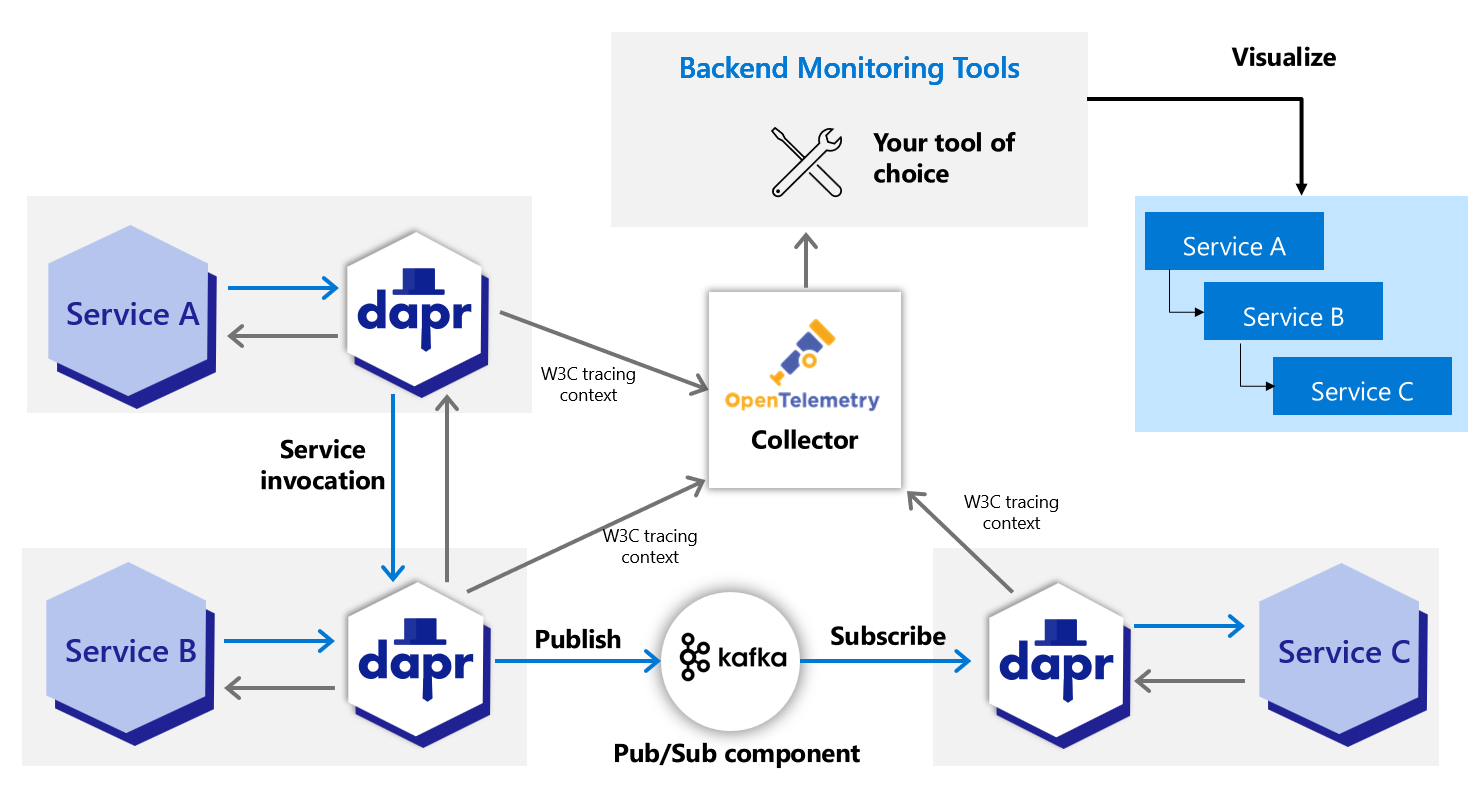
1.4.1 - Using OpenTelemetry Collector to collect traces
How to use Dapr to push trace events through the OpenTelemetry Collector.
Dapr directly writes traces using the OpenTelemetry (OTLP) protocol as the recommended method. For observability tools that support the OTLP directly, it is recommended to use the OpenTelemetry Collector, as it allows your application to quickly offload data and includes features, such as retries, batching, and encryption. For more information, read the Open Telemetry Collector documentation.
Dapr can also write traces using the Zipkin protocol. Prior to supporting the OTLP protocol, the Zipkin protocol was used with the OpenTelemetry Collector to send traces to observability tools such as AWS X-Ray, Google Cloud Operations Suite, and Azure Monitor. Both protocol approaches are valid, however the OpenTelemetry protocol is the recommended choice.
Apply the appconfig configuration by adding a dapr.io/config annotation to the container that you want to participate in the distributed tracing, as shown in the following example:
If you are using one of the Dapr tutorials, such as distributed calculator, the appconfig configuration is already configured, so no additional settings are needed.
You can register multiple tracing exporters at the same time, and the tracing logs are forwarded to all registered exporters.
That’s it! There’s no need to include any SDKs or instrument your application code. Dapr automatically handles the distributed tracing for you.
View traces
Deploy and run some applications. Wait for the trace to propagate to your tracing backend and view them there.
1.4.2 - Using OpenTelemetry Collector to collect traces to send to App Insights
How to push trace events to Azure Application Insights, using the OpenTelemetry Collector.
Dapr integrates with OpenTelemetry (OTEL) Collector using the OpenTelemetry protocol (OTLP). This guide walks through an example using Dapr to push traces to Azure Application Insights, using the OpenTelemetry Collector.
Set up Dapr to send traces to the OpenTelemetry Collector
Create a Dapr configuration file to enable tracing and send traces to the OpenTelemetry Collector via OTLP.
Download and inspect the collector-config-otel.yaml. Update the namespace and otel.endpointAddress values to align with the namespace where your Dapr-enabled applications and OpenTelemetry Collector are deployed.
Apply the configuration with:
kubectl apply -f collector-config-otel.yaml
Deploy your app with tracing
Apply the tracing configuration by adding a dapr.io/config annotation to the Dapr applications that you want to include in distributed tracing, as shown in the following example:
If you are using one of the Dapr tutorials, such as distributed calculator, you will need to update the appconfig configuration to tracing.
You can register multiple tracing exporters at the same time, and the tracing logs are forwarded to all registered exporters.
That’s it! There’s no need to include any SDKs or instrument your application code. Dapr automatically handles the distributed tracing for you.
View traces
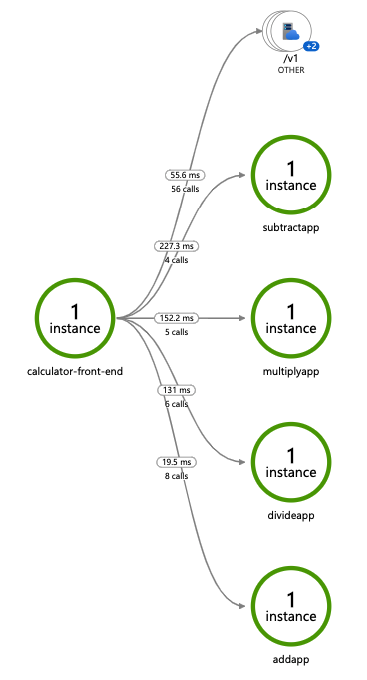
Deploy and run some applications. After a few minutes, you should see tracing logs appearing in your App Insights resource. You can also use the Application Map to examine the topology of your services, as shown below:
Note
Only operations going through Dapr API exposed by Dapr sidecar (for example, service invocation or event publishing) are displayed in Application Map topology.
1.4.3 - Using OpenTelemetry Collector to collect traces to send to Jaeger
How to push trace events to Jaeger distributed tracing platform, using the OpenTelemetry Collector.
While Dapr supports writing traces using OpenTelemetry (OTLP) and Zipkin protocols, Zipkin support for Jaeger has been deprecated in favor of OTLP. Although Jaeger supports OTLP directly, the recommended approach for production is to use the OpenTelemetry Collector to collect traces from Dapr and send them to Jaeger, allowing your application to quickly offload data and take advantage of features like retries, batching, and encryption. For more information, read the Open Telemetry Collector documentation.
Configure Jaeger in self-hosted mode
Local setup
The simplest way to start Jaeger is to run the pre-built, all-in-one Jaeger image published to DockerHub and expose the OTLP port:
Next, create the following config.yaml file locally:
Note: Because you are using the Open Telemetry protocol to talk to Jaeger, you need to fill out the otel section of the tracing configuration and set the endpointAddress to the address of the Jaeger container.
To launch the application referring to the new YAML configuration file, use
the --config option. For example:
dapr run --app-id myapp --app-port 3000 node app.js --config config.yaml
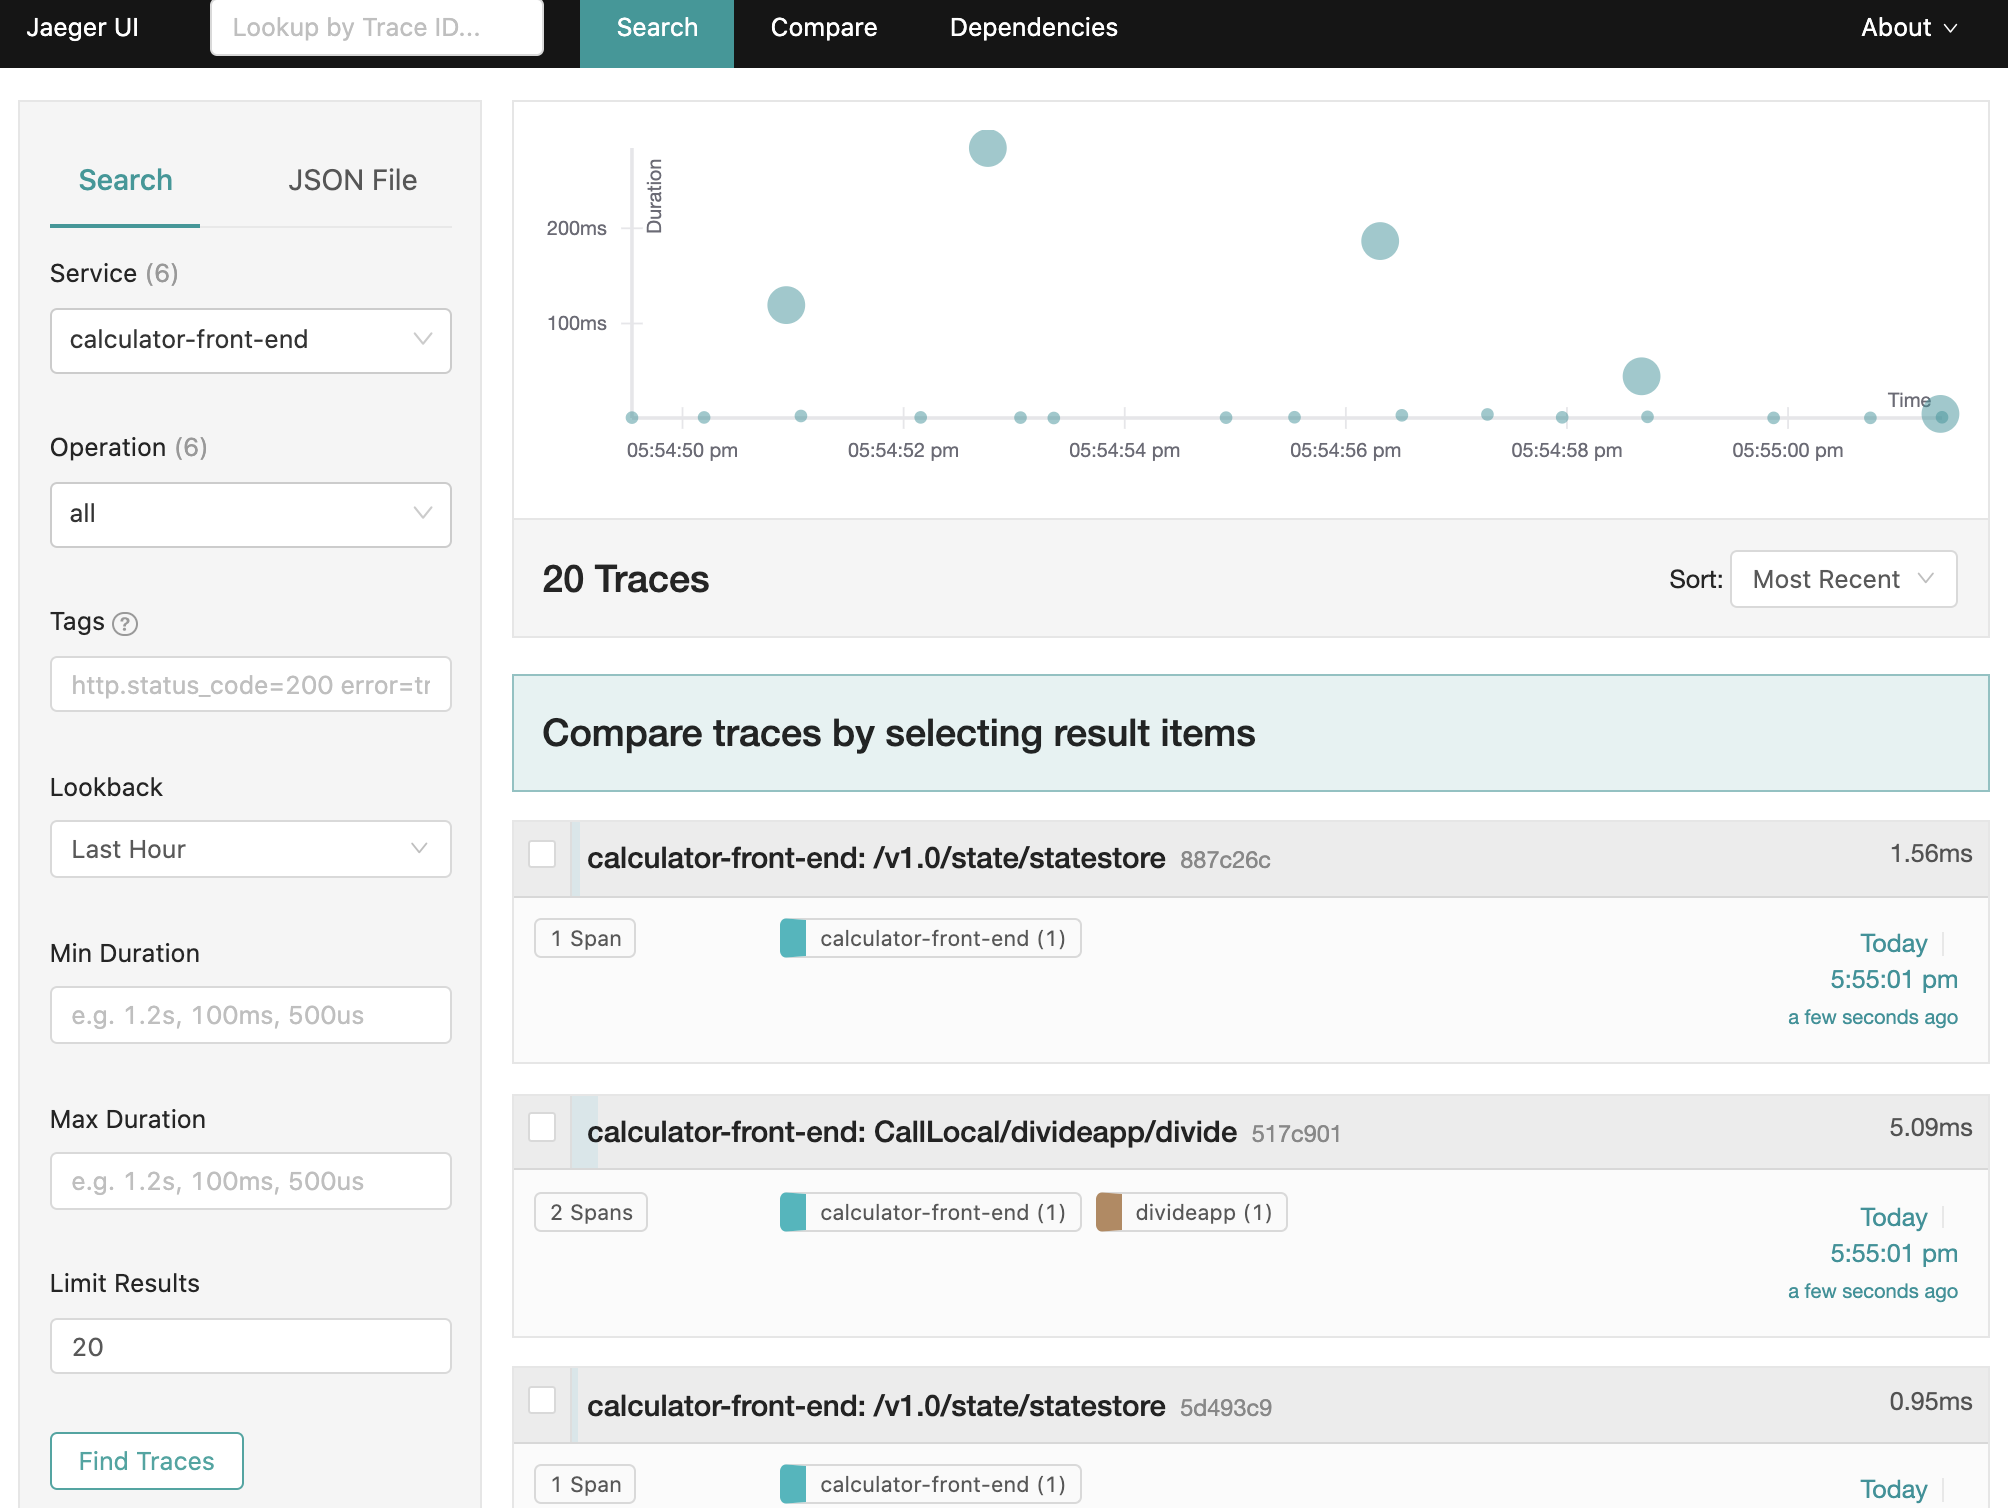
View traces
To view traces in your browser, go to http://localhost:16686 to see the Jaeger UI.
Configure Jaeger on Kubernetes with the OpenTelemetry Collector
The following steps show you how to configure Dapr to send distributed tracing data to the OpenTelemetry Collector which, in turn, sends the traces to Jaeger.
In the data section of the otel-collector-conf ConfigMap, update the otlp/jaeger.endpoint value to reflect the endpoint of your Jaeger collector Kubernetes service object.
Deploy the OpenTelemetry Collector into the same namespace where your Dapr-enabled applications are running:
Update the namespace and otel.endpointAddress values to align with the namespace where your Dapr-enabled applications and OpenTelemetry Collector are deployed.
Apply the configuration with:
kubectl apply -f collector-config.yaml
Deploy your app with tracing enabled
Apply the tracing Dapr configuration by adding a dapr.io/config annotation to the application deployment that you want to enable distributed tracing for, as shown in the following example:
You can register multiple tracing exporters at the same time, and the tracing logs are forwarded to all registered exporters.
That’s it! There’s no need to include the OpenTelemetry SDK or instrument your application code. Dapr automatically handles the distributed tracing for you.
View traces
To view Dapr sidecar traces, port-forward the Jaeger Service and open the UI:
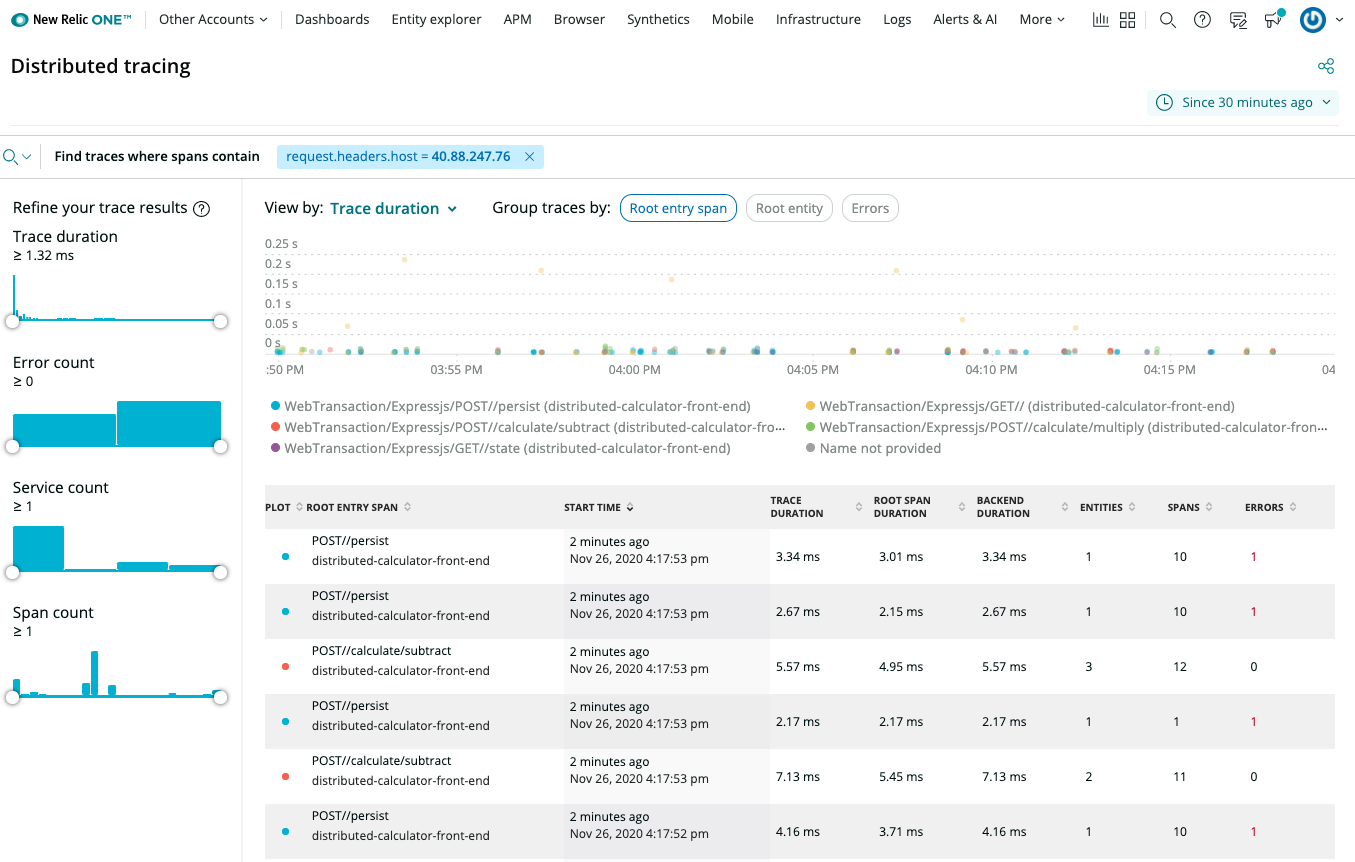
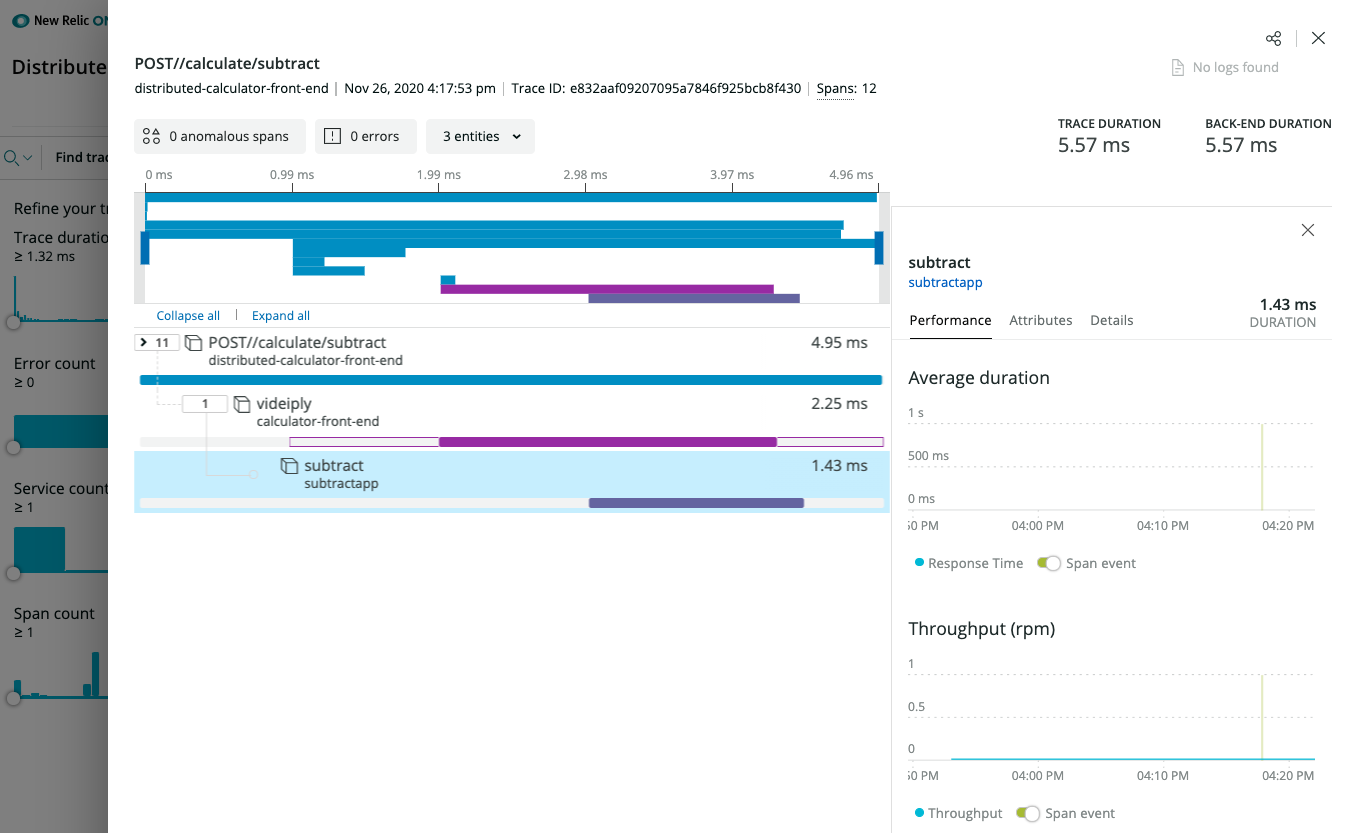
1.5 - How-To: Set-up New Relic for distributed tracing
Set-up New Relic for distributed tracing
Prerequisites
Perpetually free New Relic account, 100 GB/month of free data ingest, 1 free full access user, unlimited free basic users
Configure Dapr tracing
Dapr natively captures metrics and traces that can be send directly to New Relic. The easiest way to export these is by configuring Dapr to send the traces to New Relic’s Trace API using the Zipkin trace format.
Similarly to the OpenTelemetry instrumentation, you can also leverage a New Relic language agent. As an example, the New Relic agent instrumentation for .NET Core is part of the Dockerfile. See example here.
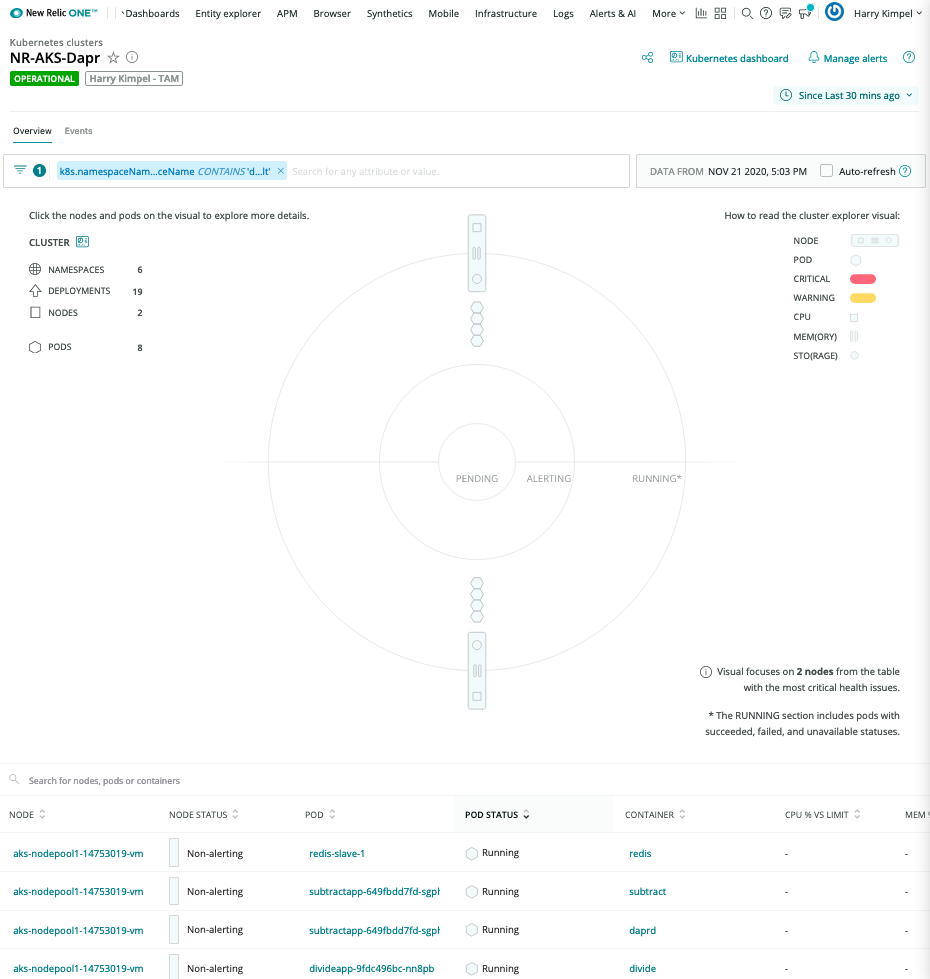
(optional) Enable New Relic Kubernetes integration
In case Dapr and your applications run in the context of a Kubernetes environment, you can enable additional metrics and logs.
The New Relic Kubernetes Cluster Explorer provides a unique visualization of the entire data and deployments of the data collected by the Kubernetes integration.
It is a good starting point to observe all your data and dig deeper into any performance issues or incidents happening inside of the application or microservices.
Automated correlation is part of the visualization capabilities of New Relic.
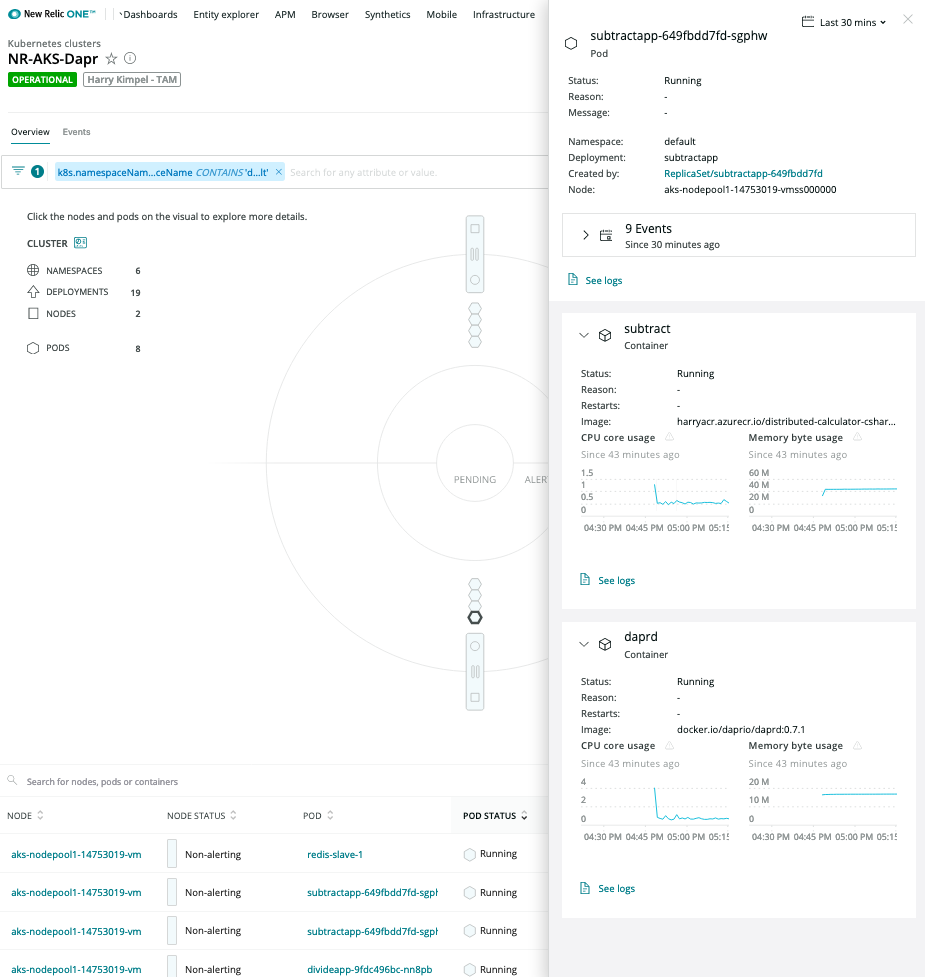
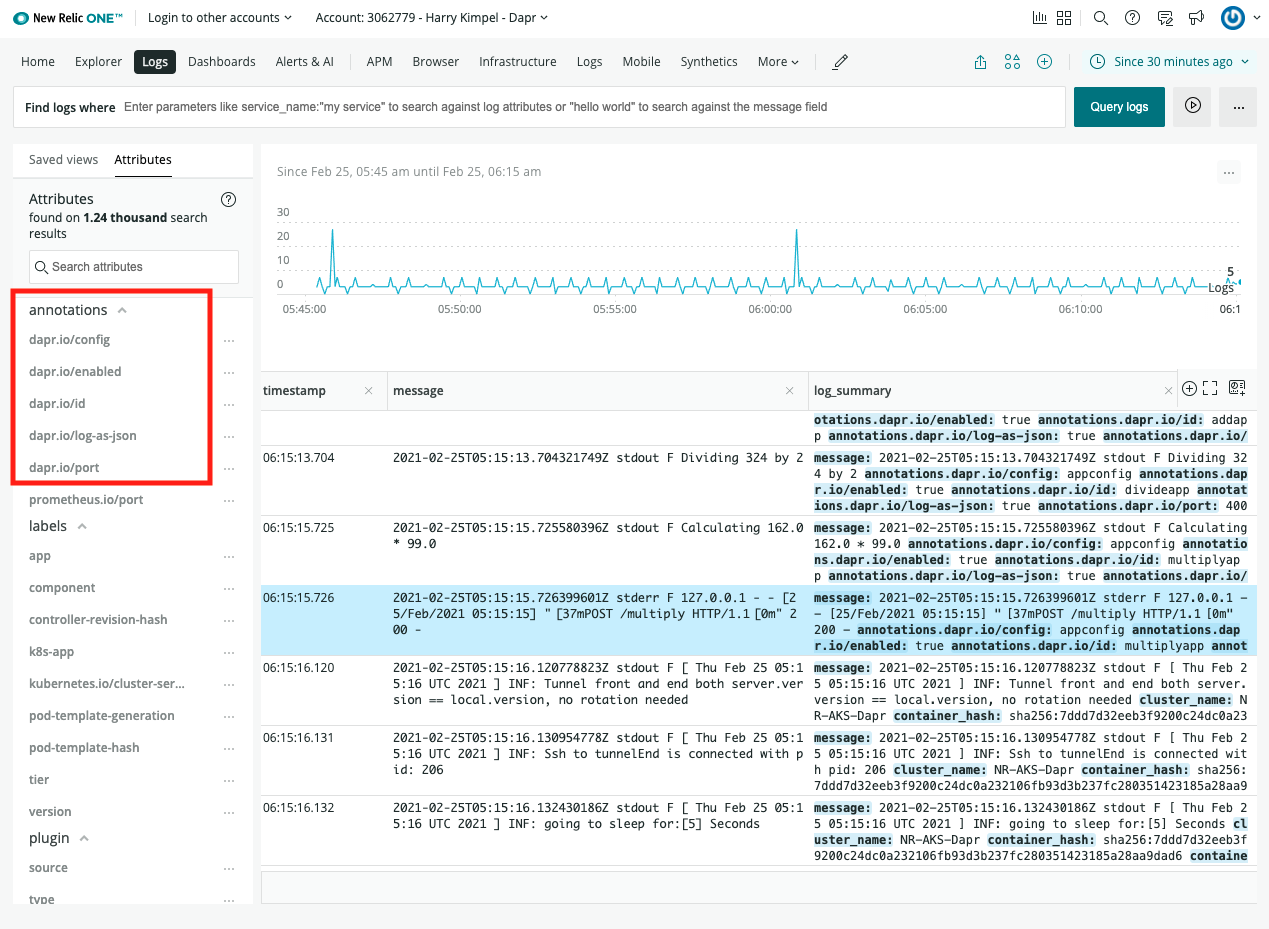
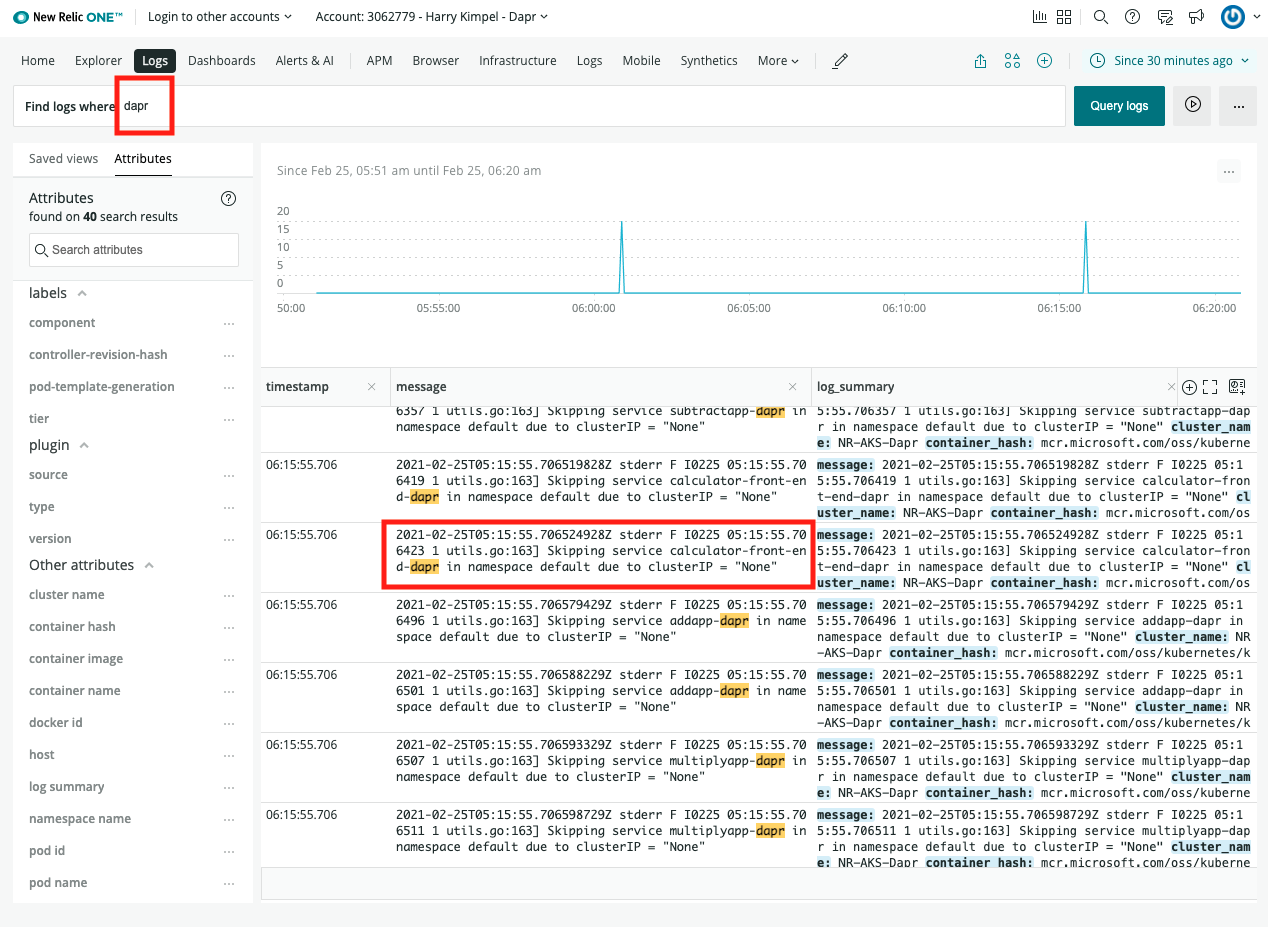
Pod-level details
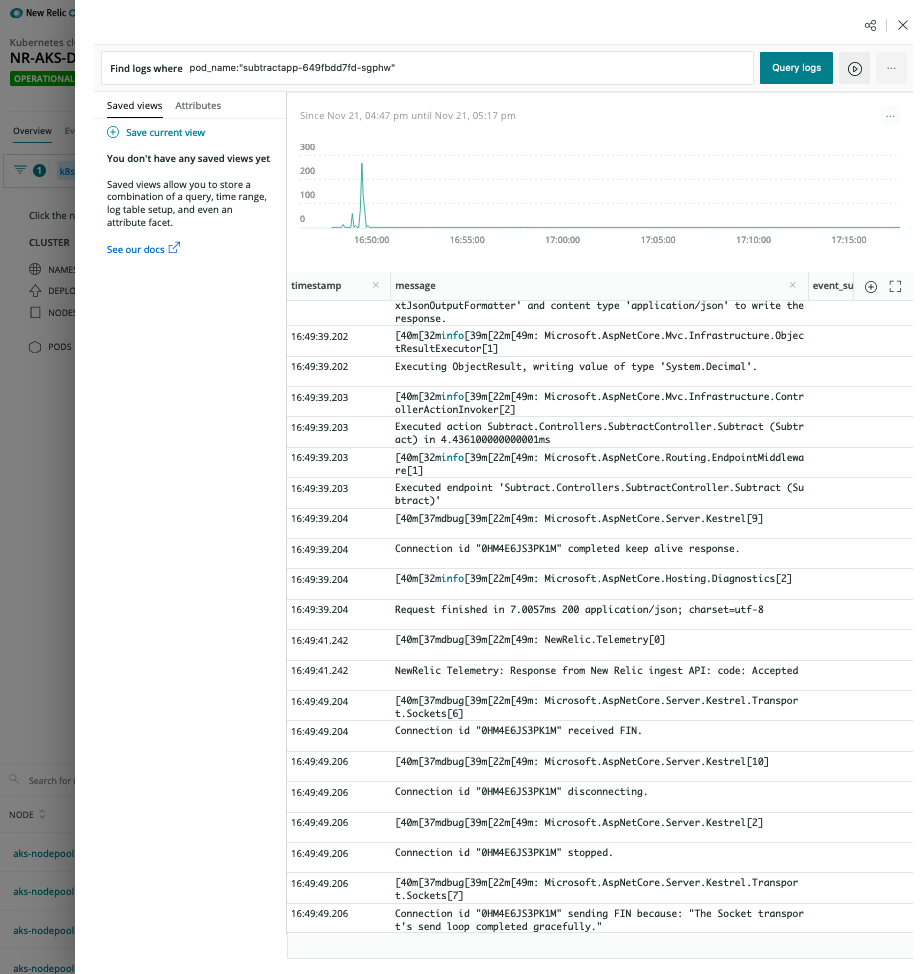
Logs in Context
New Relic Dashboards
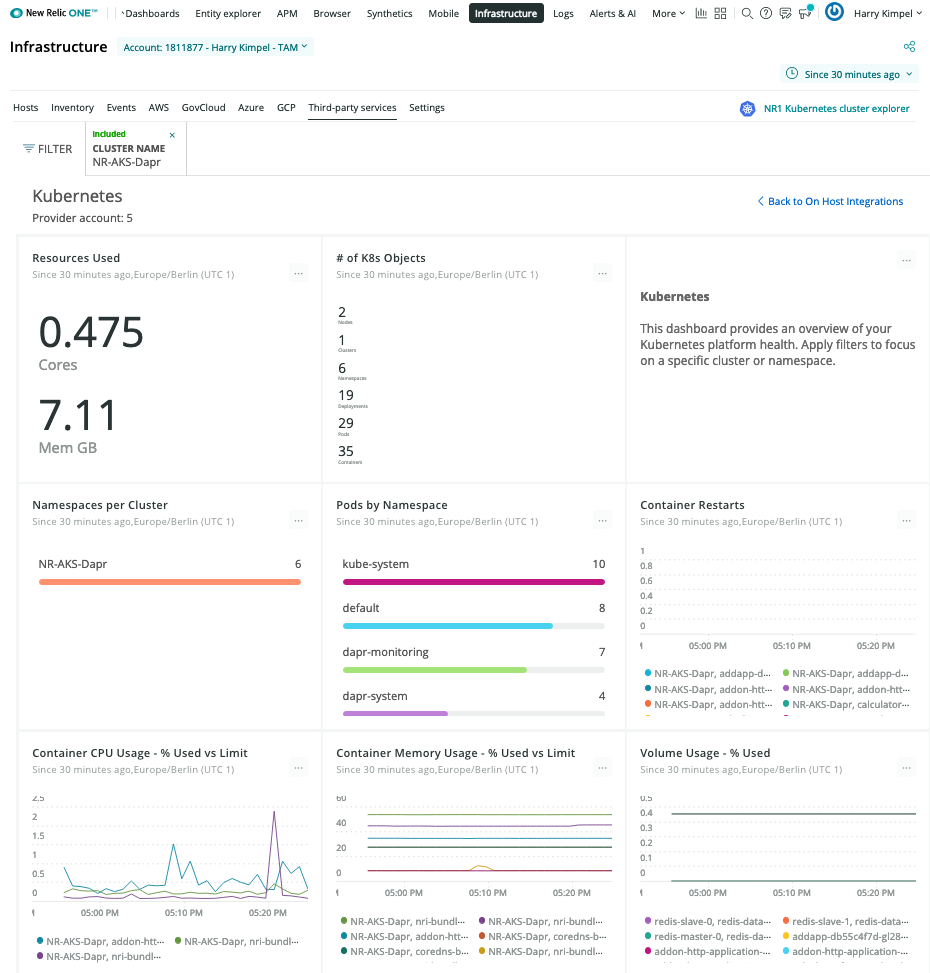
Kubernetes Overview
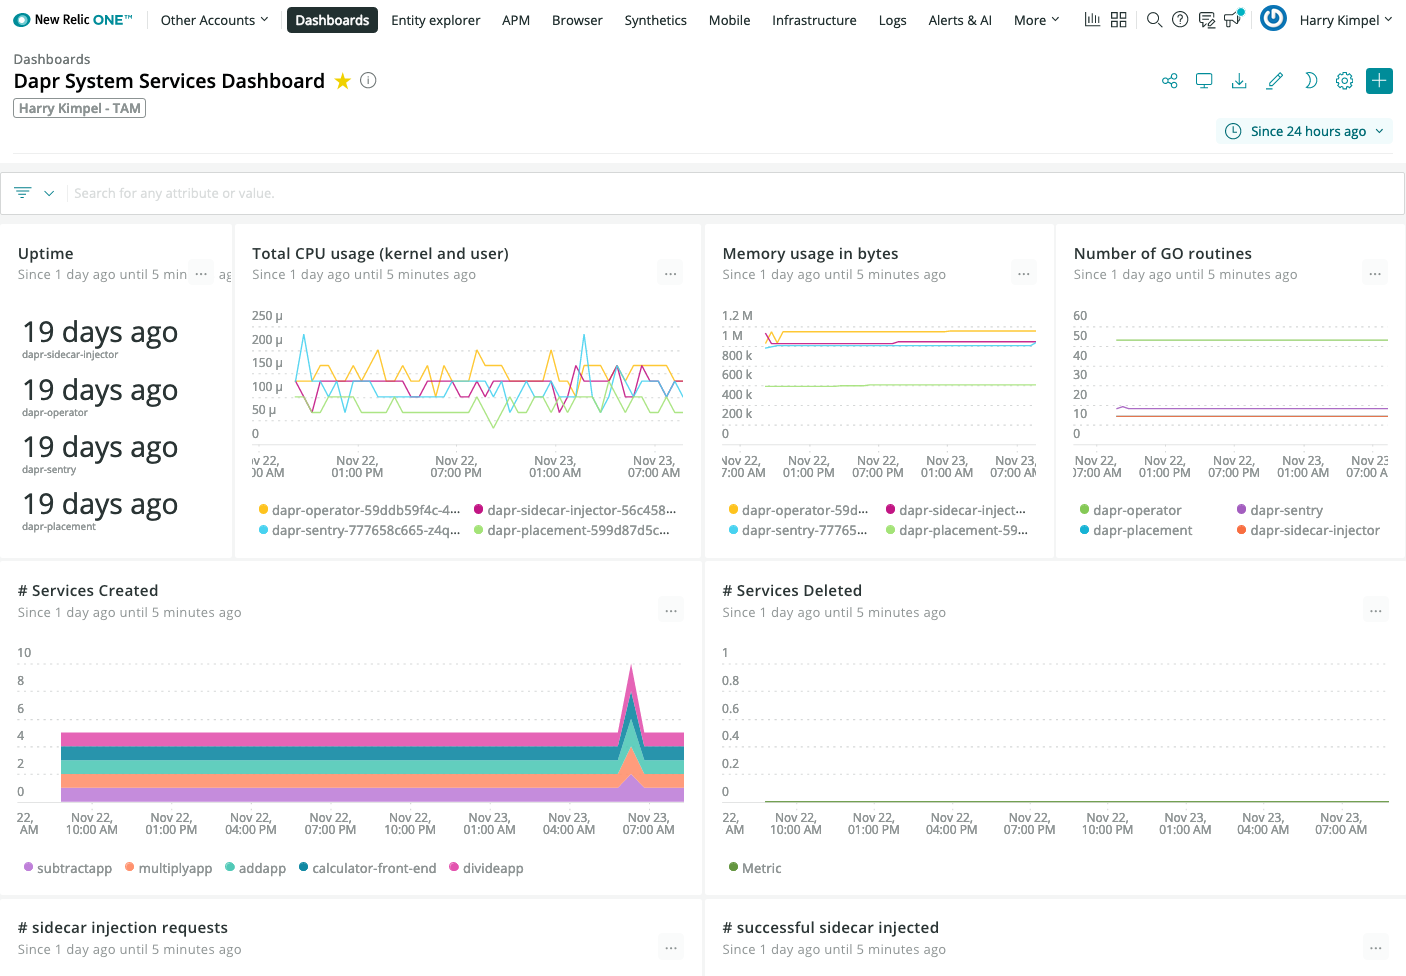
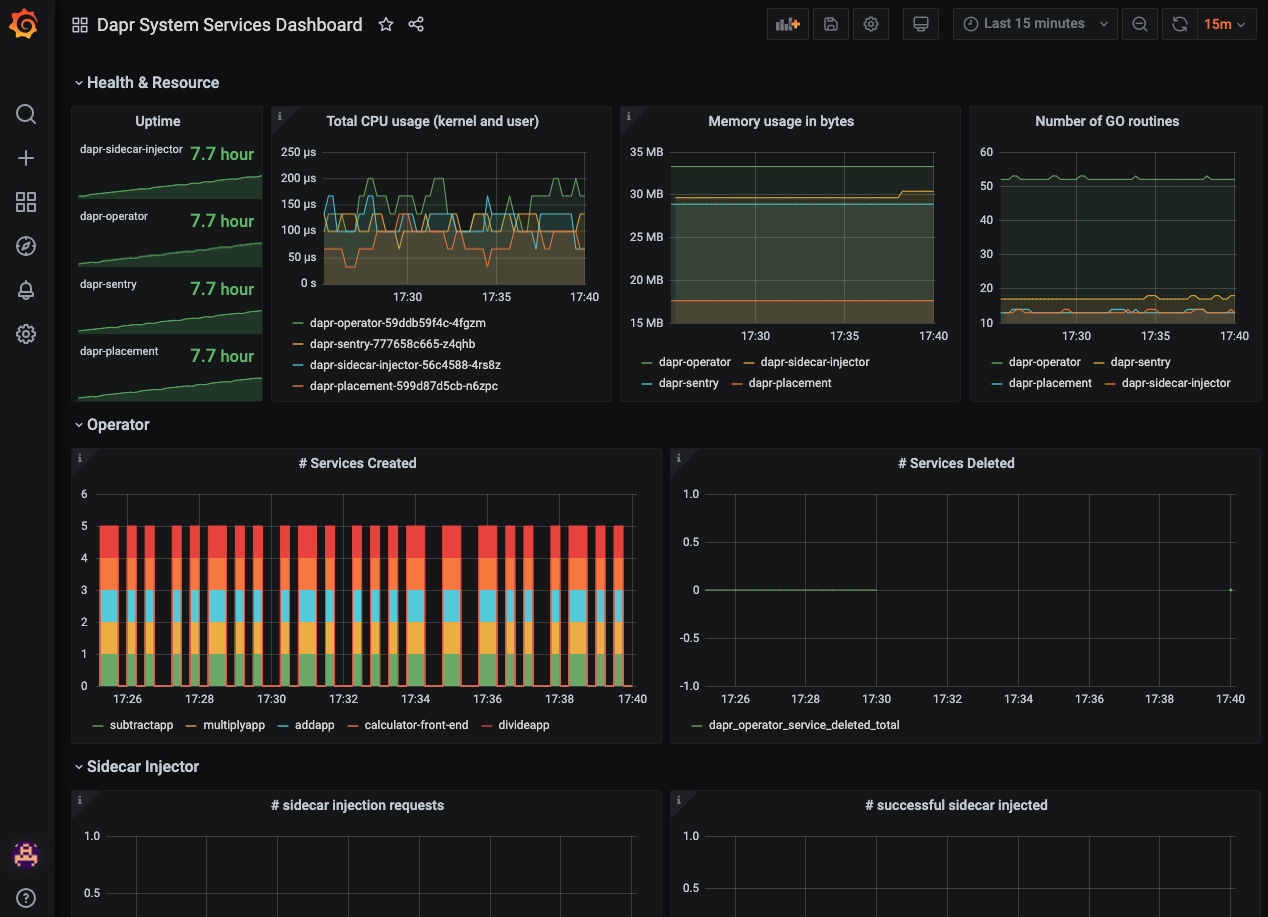
Dapr System Services
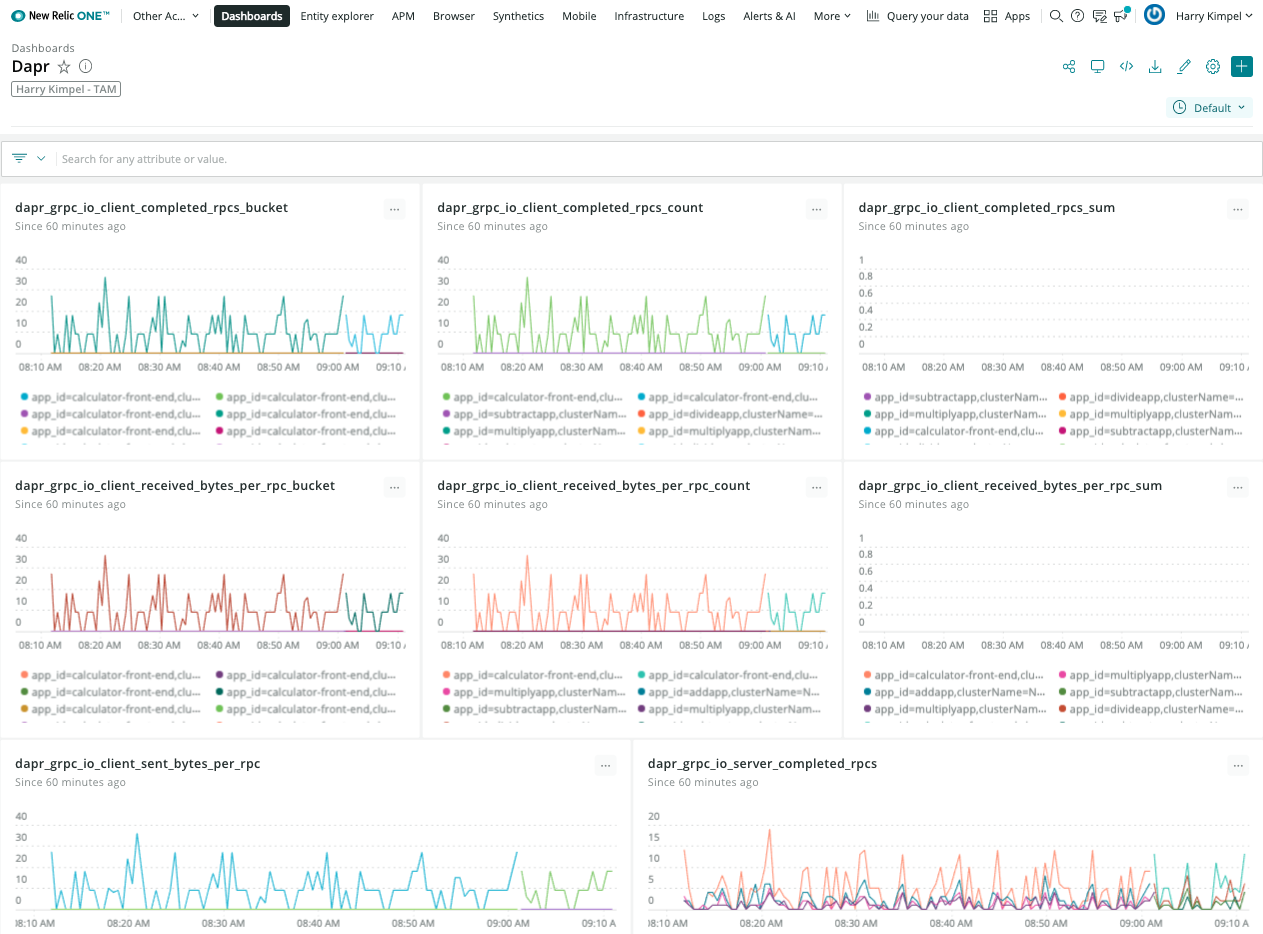
Dapr Metrics
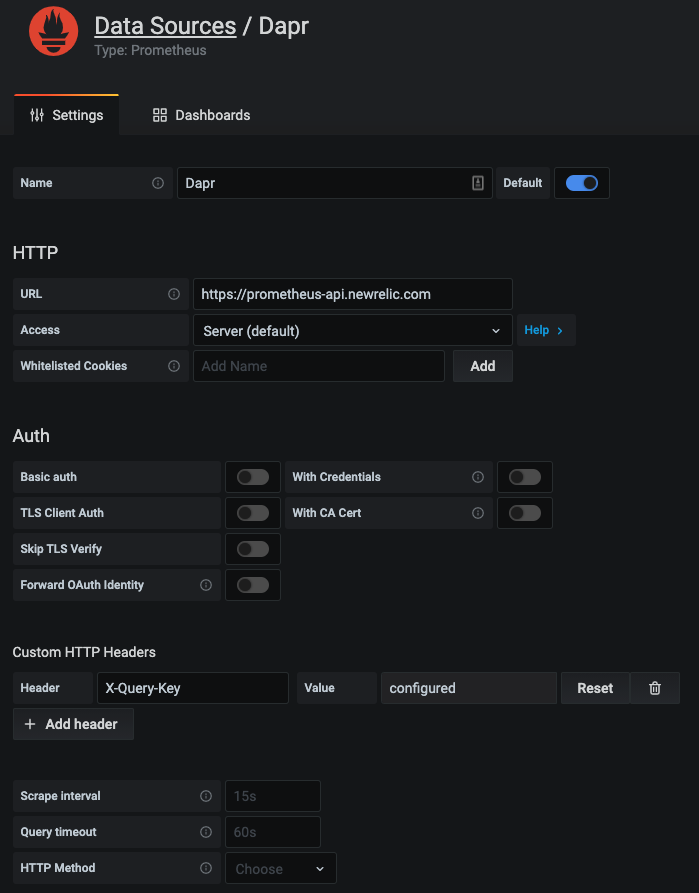
New Relic Grafana integration
New Relic teamed up with Grafana Labs so you can use the Telemetry Data Platform as a data source for Prometheus metrics and see them in your existing dashboards, seamlessly tapping into the reliability, scale, and security provided by New Relic.
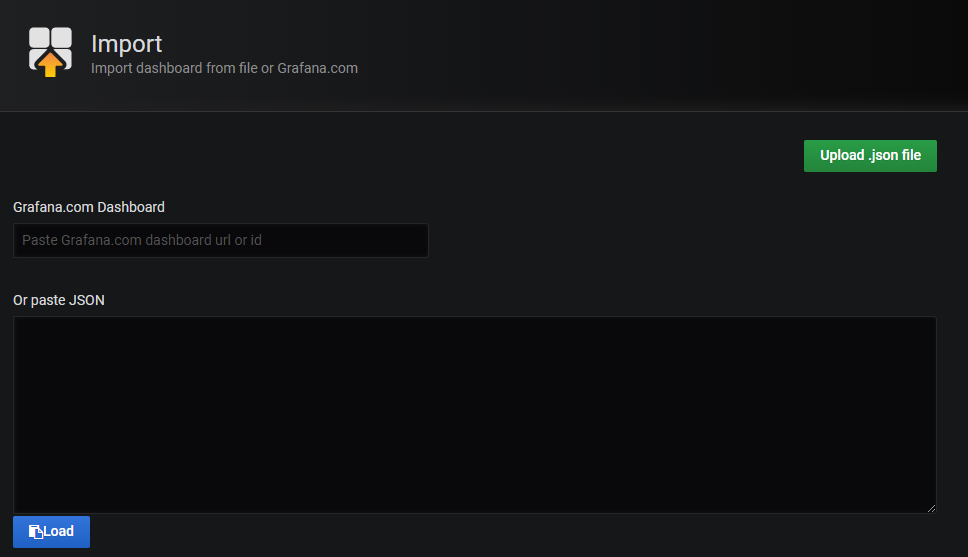
And the exact same dashboard templates from Dapr can be imported to visualize Dapr system services and sidecars.
New Relic Alerts
All the data that is collected from Dapr, Kubernetes or any services that run on top of can be used to set-up alerts and notifications into the preferred channel of your choice. See Alerts and Applied Intelligence.
1.6 - How-To: Set up Zipkin for distributed tracing
Set up Zipkin for distributed tracing
Configure self hosted mode
For self hosted mode, on running dapr init:
The following YAML file is created by default in $HOME/.dapr/config.yaml (on Linux/Mac) or %USERPROFILE%\.dapr\config.yaml (on Windows) and it is referenced by default on dapr run calls unless otherwise overridden `:
The openzipkin/zipkin docker container is launched on running dapr init or it can be launched with the following code.
Launch Zipkin using Docker:
docker run -d -p 9411:9411 openzipkin/zipkin
The applications launched with dapr run by default reference the config file in $HOME/.dapr/config.yaml or %USERPROFILE%\.dapr\config.yaml and can be overridden with the Dapr CLI using the --config param:
dapr run --app-id mynode --app-port 3000 node app.js
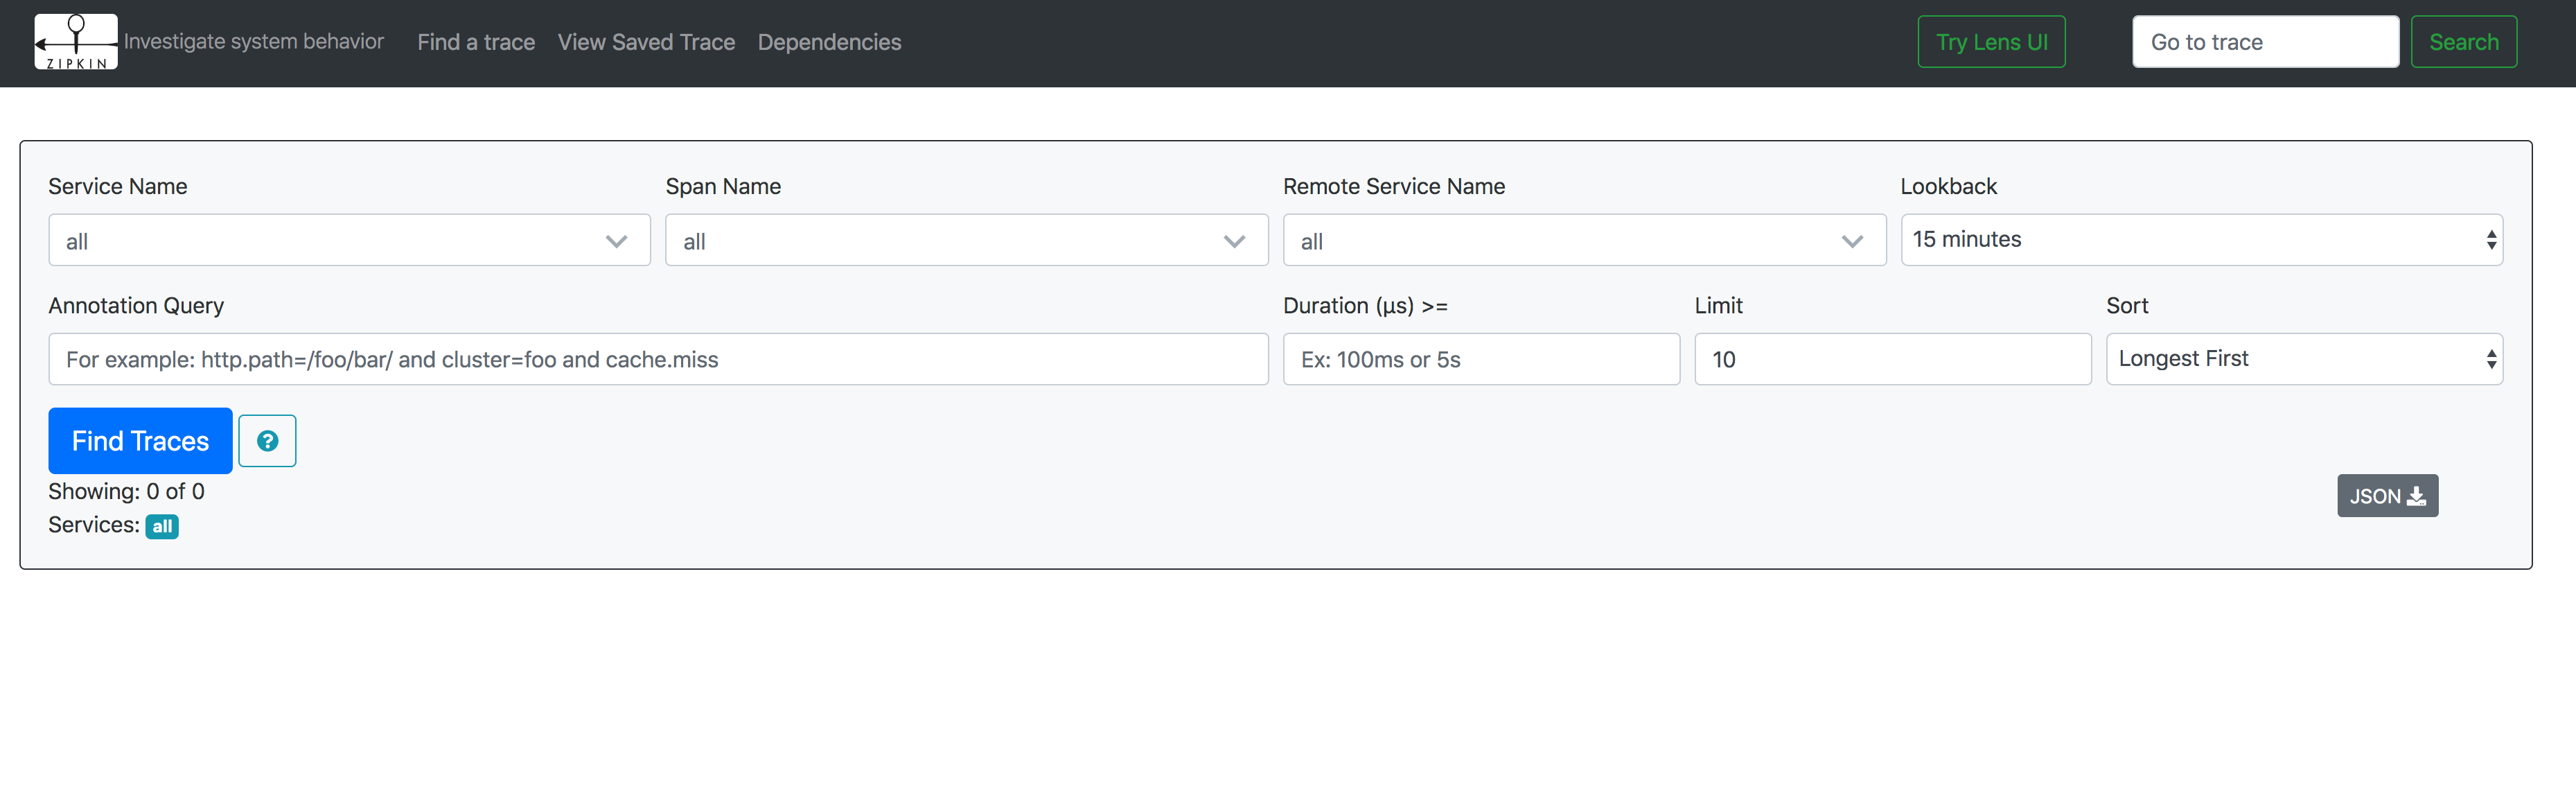
Viewing Traces
To view traces, in your browser go to http://localhost:9411 and you will see the Zipkin UI.
Configure Kubernetes
The following steps shows you how to configure Dapr to send distributed tracing data to Zipkin running as a container in your Kubernetes cluster, and how to view them.
1.7 - How-To: Set up Datadog for distributed tracing
Set up Datadog for distributed tracing
Dapr captures metrics and traces that can be sent directly to Datadog through the OpenTelemetry Collector Datadog exporter.
Configure Dapr tracing with the OpenTelemetry Collector and Datadog
Using the OpenTelemetry Collector Datadog exporter, you can configure Dapr to create traces for each application in your Kubernetes cluster and collect them in Datadog.
By default, each Dapr system process emits Go runtime/process metrics and has their own Dapr metrics.
Prometheus endpoint
The Dapr sidecar exposes a Prometheus-compatible metrics endpoint that you can scrape to gain a greater understanding of how Dapr is behaving.
Configuring metrics using the CLI
The metrics application endpoint is enabled by default. You can disable it by passing the command line argument --enable-metrics=false.
The default metrics port is 9090. You can override this by passing the command line argument --metrics-port to daprd.
Configuring metrics in Kubernetes
You can also enable/disable the metrics for a specific application by setting the dapr.io/enable-metrics: "false" annotation on your application deployment. With the metrics exporter disabled, daprd does not open the metrics listening port.
The following Kubernetes deployment example shows how metrics are explicitly enabled with the port specified as “9090”.
Configuring metrics using application configuration
You can also enable metrics via application configuration. To disable the metrics collection in the Dapr sidecars by default, set spec.metrics.enabled to false.
You can enable additional metrics for Dapr API error codes by setting spec.metrics.recordErrorCodes to true. Dapr APIs which communicate back to their caller may return standardized error codes. A new metric called error_code_total is recorded, which allows monitoring of error codes triggered by application, code, and category. See the errorcodes package for specific codes and categories.
Optimizing HTTP metrics reporting with path matching
When invoking Dapr using HTTP, metrics are created for each requested method by default. This can result in a high number of metrics, known as high cardinality, which can impact memory usage and CPU.
Path matching allows you to manage and control the cardinality of HTTP metrics in Dapr. This is an aggregation of metrics, so rather than having a metric for each event, you can reduce the number of metrics events and report an overall number. Learn more about how to set the cardinality in configuration.
This configuration is opt-in and is enabled via the Dapr configuration spec.metrics.http.pathMatching. When defined, it enables path matching, which standardizes specified paths for both metrics paths. This reduces the number of unique metrics paths, making metrics more manageable and reducing resource consumption in a controlled way.
When spec.metrics.http.pathMatching is combined with the increasedCardinality flag set to false, non-matched paths are transformed into a catch-all bucket to control and limit cardinality, preventing unbounded path growth. Conversely, when increasedCardinality is true (the default), non-matched paths are passed through as they normally would be, allowing for potentially higher cardinality but preserving the original path data.
Examples of Path Matching in HTTP Metrics
The following examples demonstrate how to use the Path Matching API in Dapr for managing HTTP metrics. On each example, the metrics are collected from 5 HTTP requests to the /orders endpoint with different order IDs. By adjusting cardinality and utilizing path matching, you can fine-tune metric granularity to balance detail and resource efficiency.
These examples illustrate the cardinality of the metrics, highlighting that high cardinality configurations result in many entries, which correspond to higher memory usage for handling metrics. For simplicity, the following example focuses on a single metric: dapr_http_server_request_count.
Low cardinality with path matching (Recommendation)
With low cardinality and path matching configured, you get the best of both worlds by grouping the metrics for the important endpoints without compromising the cardinality. This approach helps avoid high memory usage and potential security issues.
In low cardinality mode, the path, which is the main source of unbounded cardinality, is dropped. This results in metrics that primarily indicate the number of requests made to the service for a given HTTP method, but without any information about the paths invoked.
This example results from the same HTTP requests as the example above, but with path matching configured for the path /orders/{orderID}. By using path matching, you achieve reduced cardinality by grouping the metrics based on the matched path.
For each request, a new metric is created with the request path. This process continues for every request made to a new order ID, resulting in unbounded cardinality since the IDs are ever-growing.
HTTP metrics exclude verbs
The excludeVerbs option allows you to exclude specific HTTP verbs from being reported in the metrics. This can be useful in high-performance applications where memory savings are critical.
Examples of excluding HTTP verbs in metrics
The following examples demonstrate how to exclude HTTP verbs in Dapr for managing HTTP metrics.
Grouping latency values in a cumulative fashion allows buckets to be used or dropped as needed for increased or decreased granularity of data.
For example, if a request takes 3ms, it’s counted in the 3ms bucket, the 4ms bucket, the 5ms bucket, and so on.
Similarly, if a request takes 10ms, it’s counted in the 10ms bucket, the 13ms bucket, the 16ms bucket, and so on.
After these two requests have completed, the 3ms bucket has a count of 1 and the 10ms bucket has a count of 2, since both the 3ms and 10ms requests are included here.
This shows up as follows:
1
2
3
4
5
6
8
10
13
16
20
25
30
40
50
65
80
100
130
160
…..
100000
0
0
1
1
1
1
1
2
2
2
2
2
2
2
2
2
2
2
2
2
…..
2
The default number of buckets works well for most use cases, but can be adjusted as needed. Each request creates 34 different metrics, leaving this value to grow considerably for a large number of applications.
More accurate latency percentiles can be achieved by increasing the number of buckets. However, a higher number of buckets increases the amount of memory used to store the metrics, potentially negatively impacting your monitoring system.
It is recommended to keep the number of latency buckets set to the default value, unless you are seeing unwanted memory pressure in your monitoring system. Configuring the number of buckets allows you to choose applications where:
You want to see more detail with a higher number of buckets
Broader values are sufficient by reducing the buckets
Take note of the default latency values your applications are producing before configuring the number buckets.
Customizing latency buckets to your scenario
Tailor the latency buckets to your needs, by modifying the spec.metrics.latencyDistributionBuckets field in the Dapr configuration spec for your application(s).
For example, if you aren’t interested in extremely low latency values (1-10ms), you can group them in a single 10ms bucket. Similarly, you can group the high values in a single bucket (1000-5000ms), while keeping more detail in the middle range of values that you are most interested in.
The following Configuration spec example replaces the default 34 buckets with 11 buckets, giving a higher level of granularity in the middle range of values:
You can set regular expressions for every metric exposed by the Dapr sidecar to “transform” their values. See a list of all Dapr metrics.
The name of the rule must match the name of the metric that is transformed. The following example shows how to apply a regular expression for the label method in the metric dapr_runtime_service_invocation_req_sent_total:
When this configuration is applied, a recorded metric with the method label of orders/a746dhsk293972nz is replaced with orders/.
Using regular expressions to reduce metrics cardinality is considered legacy. We encourage all users to set spec.metrics.http.increasedCardinality to false instead, which is simpler to configure and offers better performance.
You don’t need to install Prometheus if you plan to run it as a Docker container. Please refer to the Container instructions.
To install Prometheus, follow the steps outlined here for your OS.
Configure
Now you’ve installed Prometheus, you need to create a configuration.
Below is an example Prometheus configuration, save this to a file i.e. /tmp/prometheus.yml or C:\Temp\prometheus.yml
global:scrape_interval:15s# By default, scrape targets every 15 seconds.# A scrape configuration containing exactly one endpoint to scrape:# Here it's Prometheus itself.scrape_configs:- job_name:'dapr'# Override the global default and scrape targets from this job every 5 seconds.scrape_interval:5sstatic_configs:- targets:['localhost:9090']# Replace with Dapr metrics port if not default
Run as Process
Run Prometheus with your configuration to start it collecting metrics from the specified targets.
We change the port so it doesn’t conflict with Dapr’s own metrics endpoint.
If you are not currently running a Dapr application, the target will show as offline. In order to start
collecting metrics you must start Dapr with the metrics port matching the one provided as the target in the configuration.
Once Prometheus is running, you’ll be able to visit its dashboard by visiting http://localhost:8080.
Run as Container
To run Prometheus as a Docker container on your local machine, first ensure you have Docker installed and running.
Then you can run Prometheus as a Docker container using:
--net=host ensures that the Prometheus instance will be able to connect to any Dapr instances running on the host machine. If you plan to run your Dapr apps in containers as well, you’ll need to run them on a shared Docker network and update the configuration with the correct target address.
Once Prometheus is running, you’ll be able to visit its dashboard by visiting http://localhost:8080.
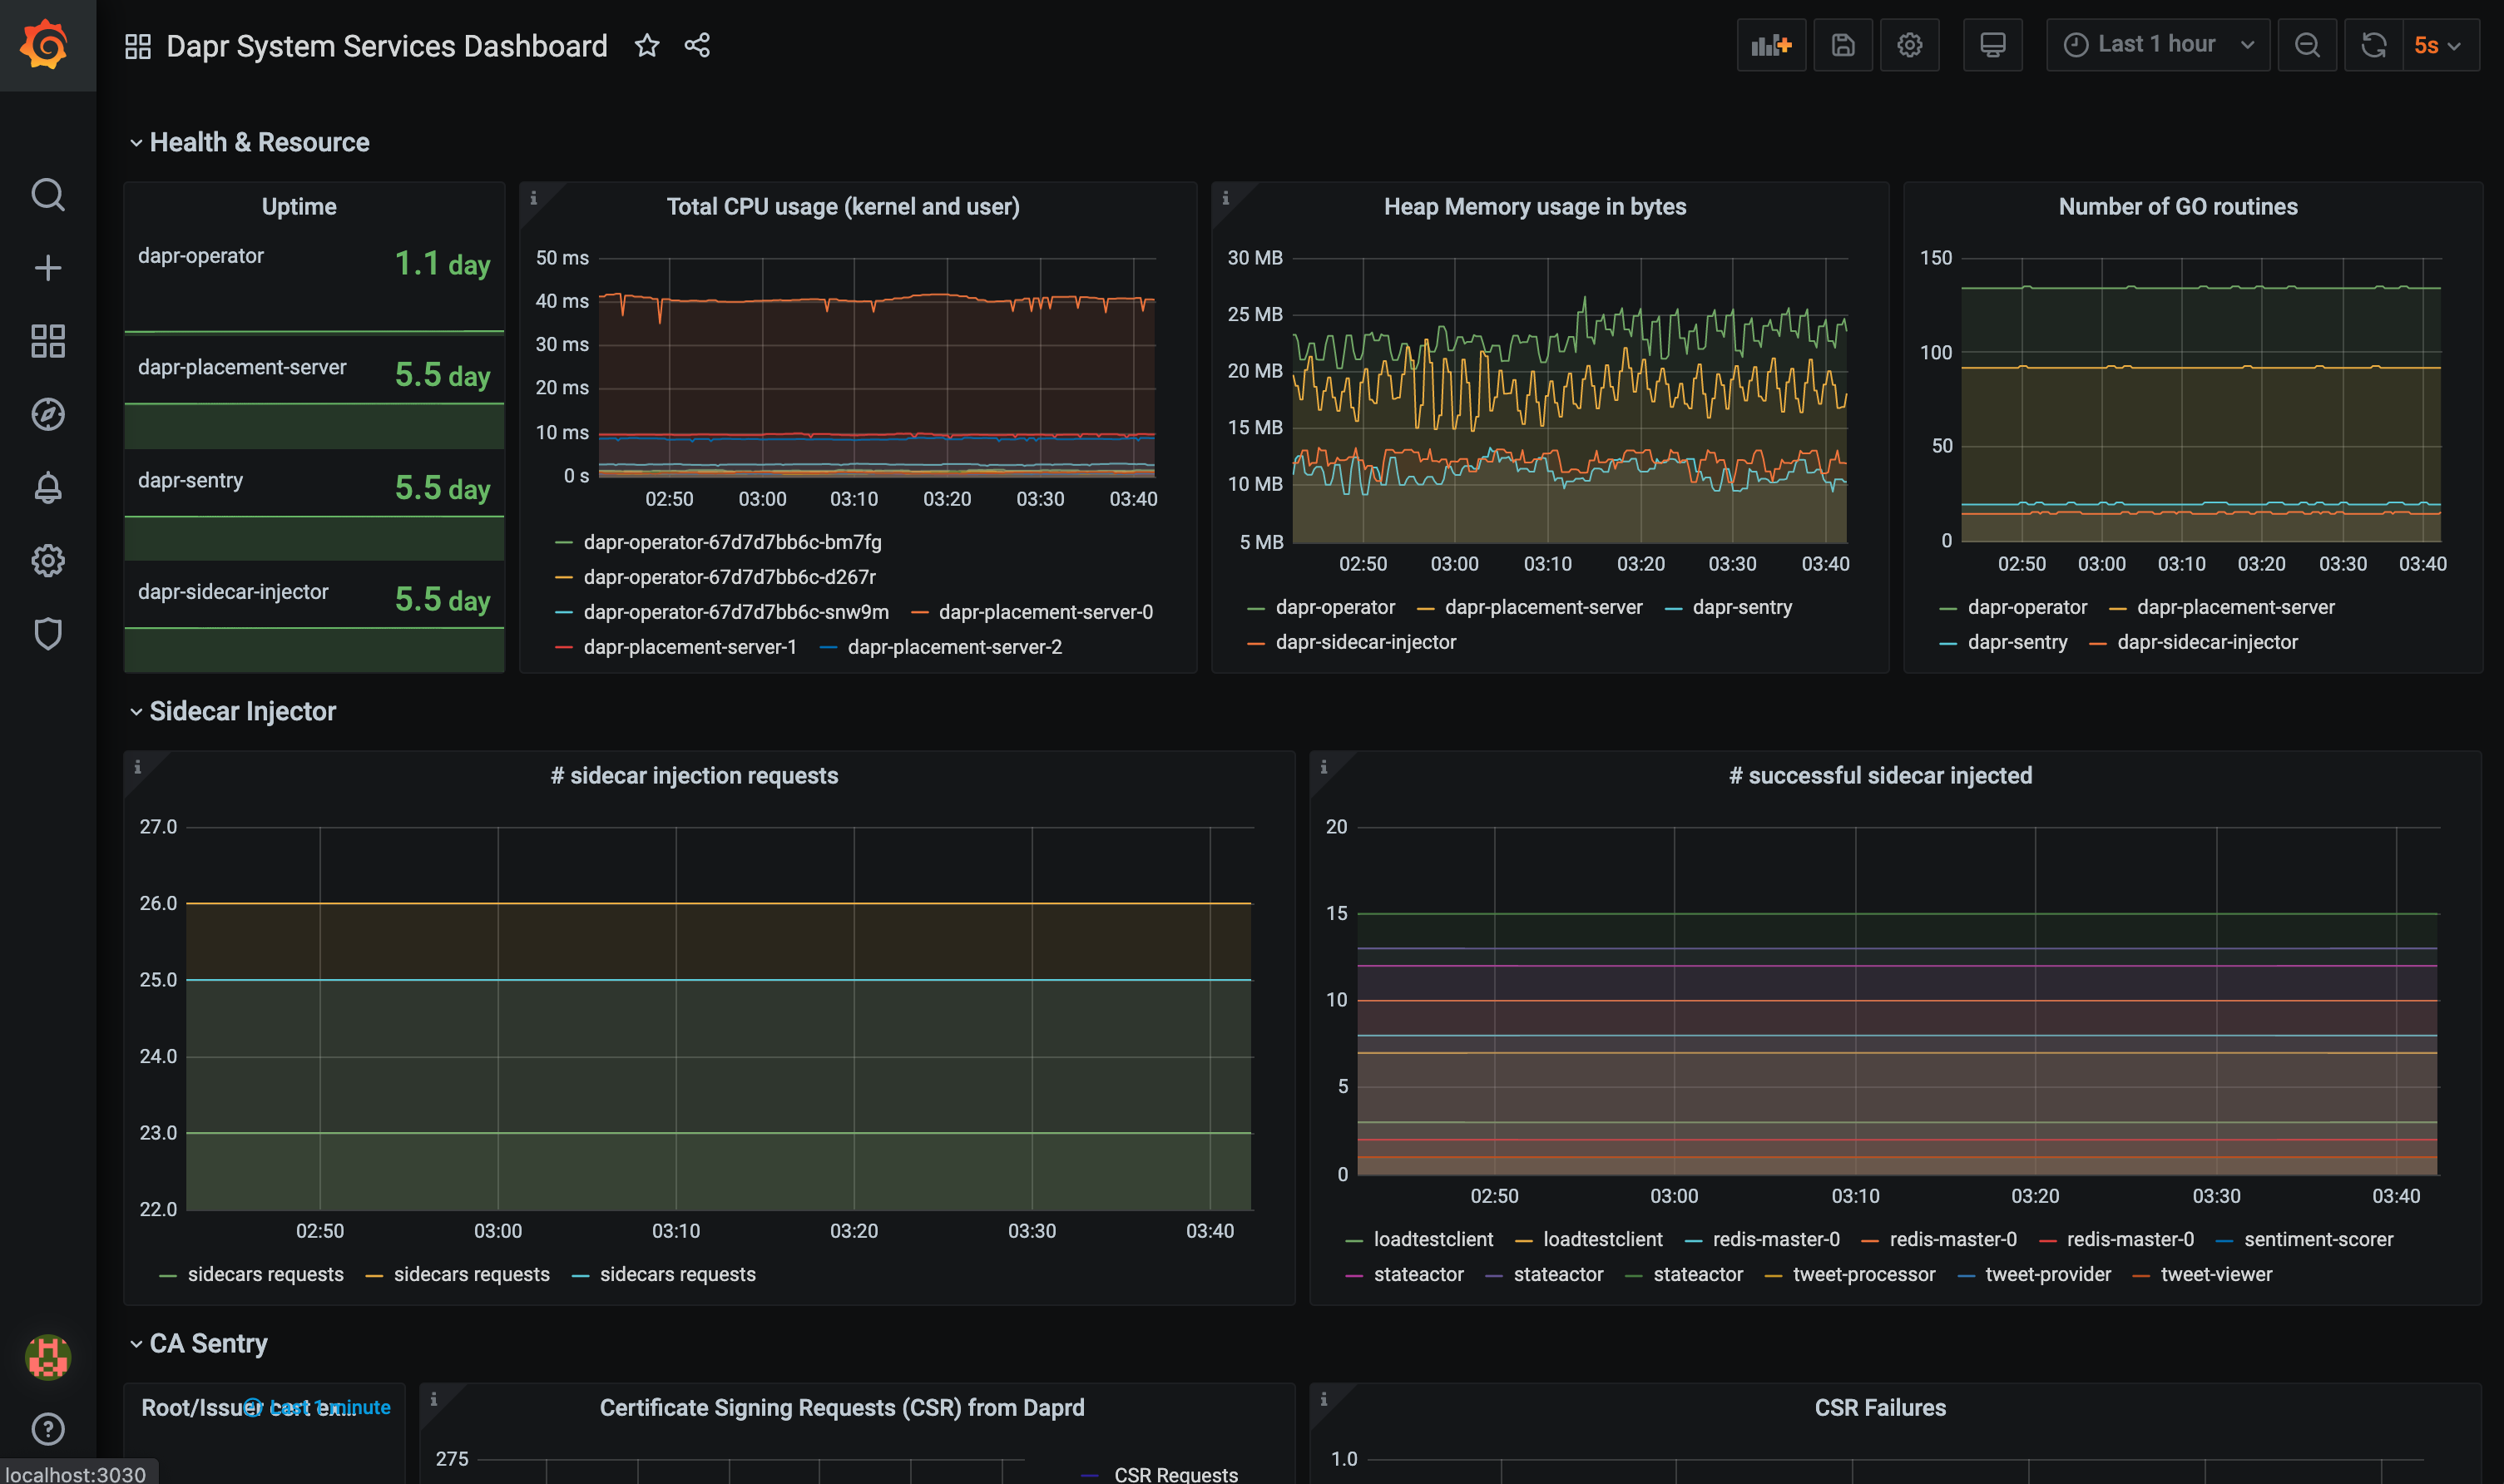
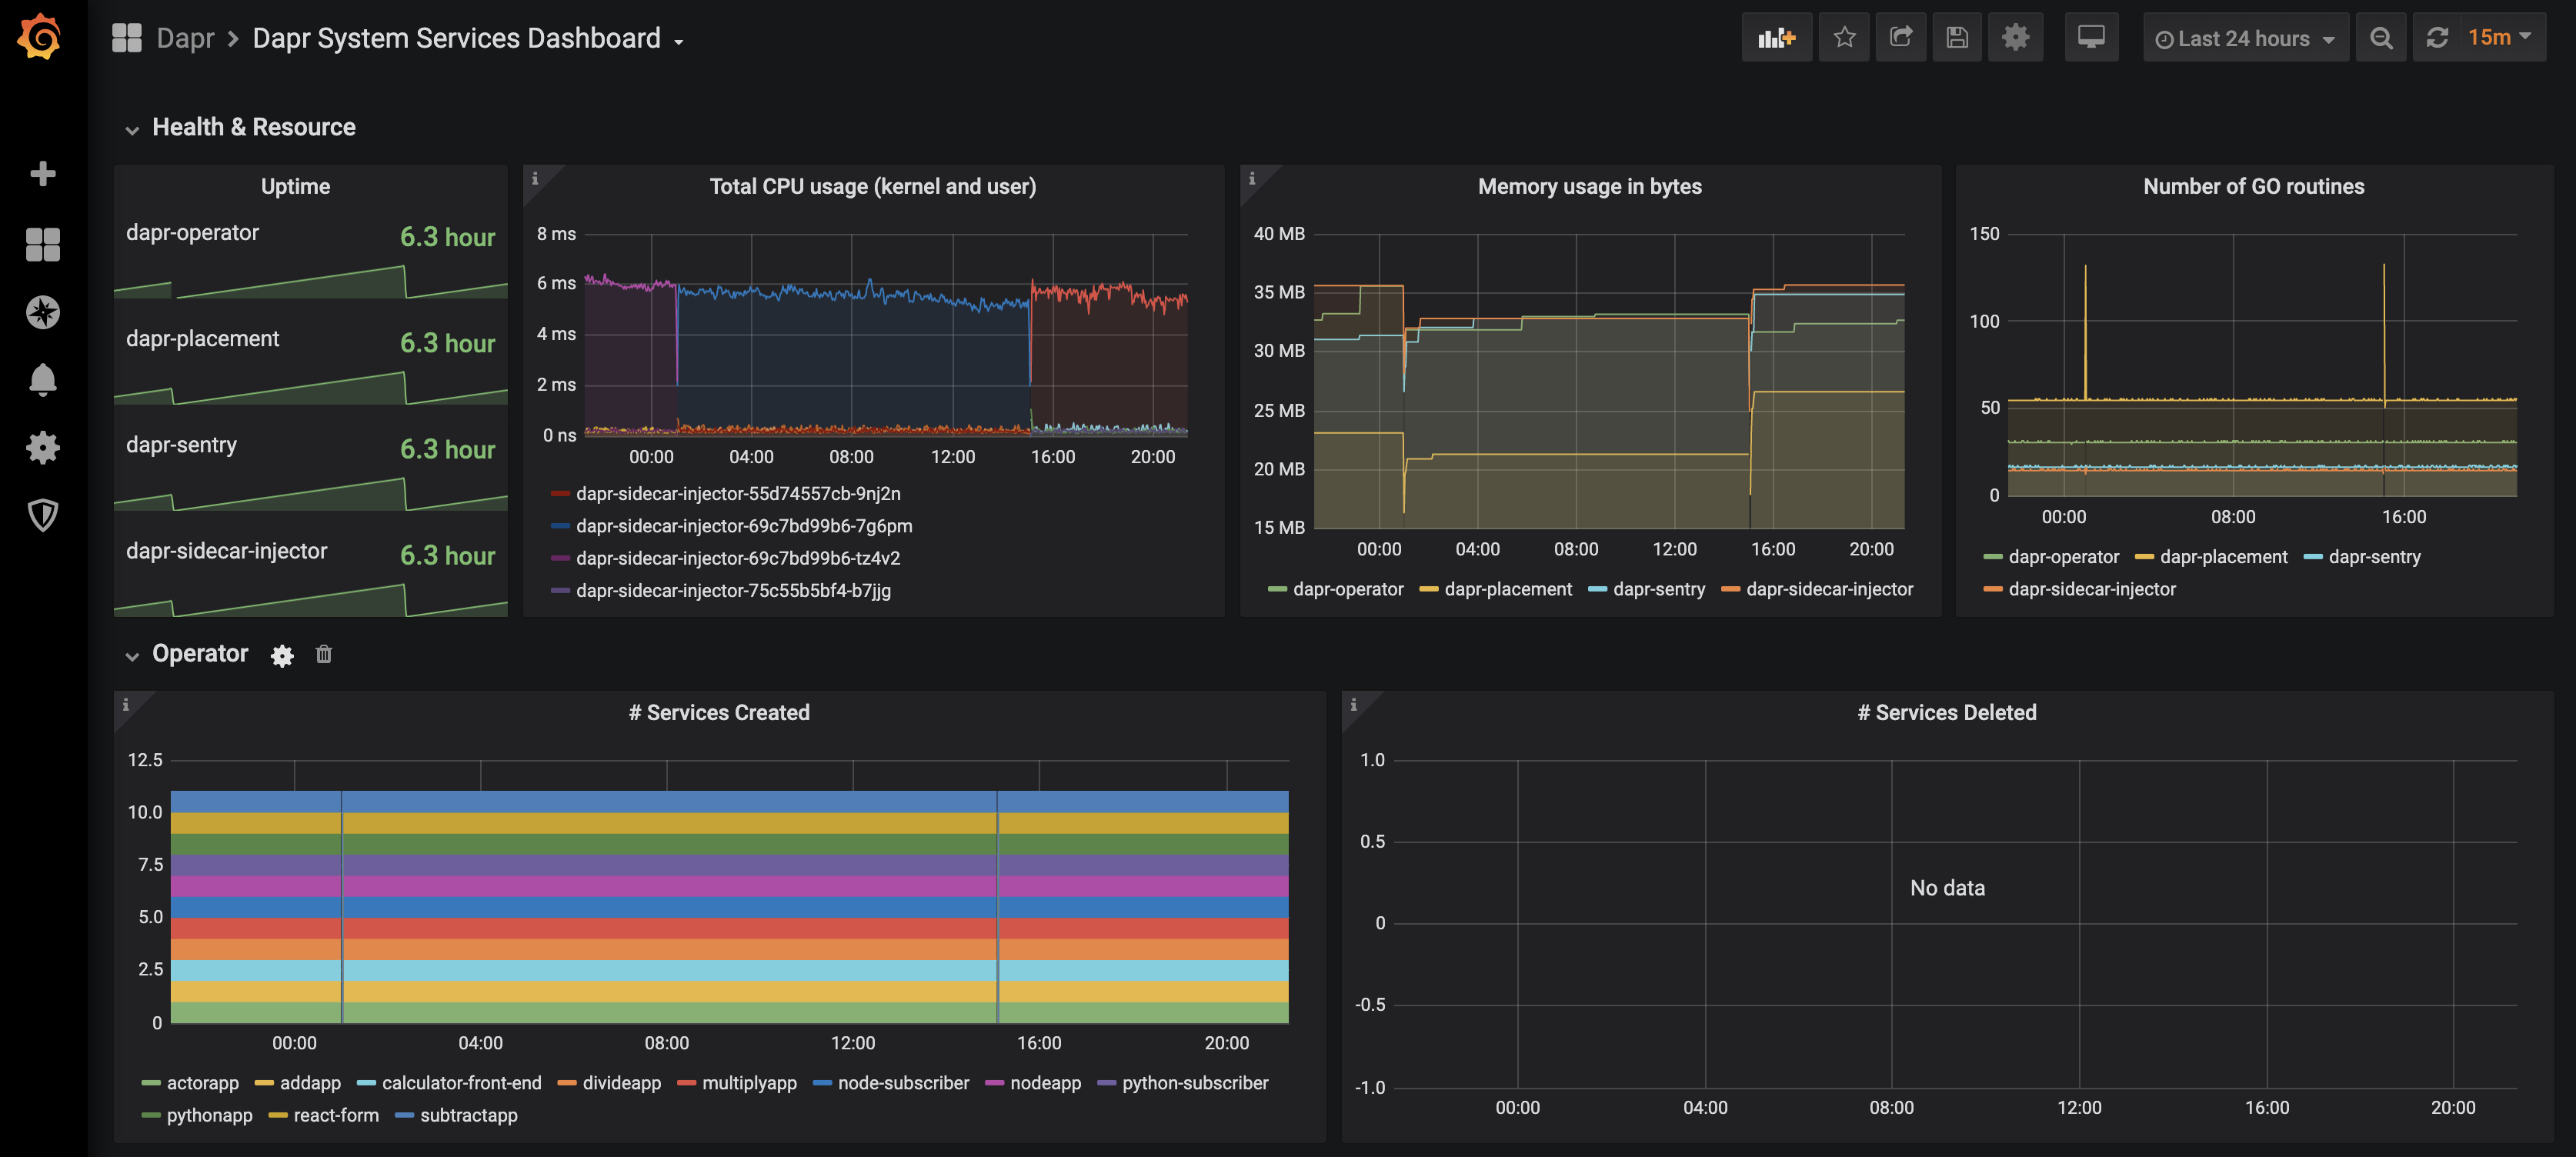
The grafana-system-services-dashboard.json template shows Dapr system component status, dapr-operator, dapr-sidecar-injector, dapr-sentry, and dapr-placement:
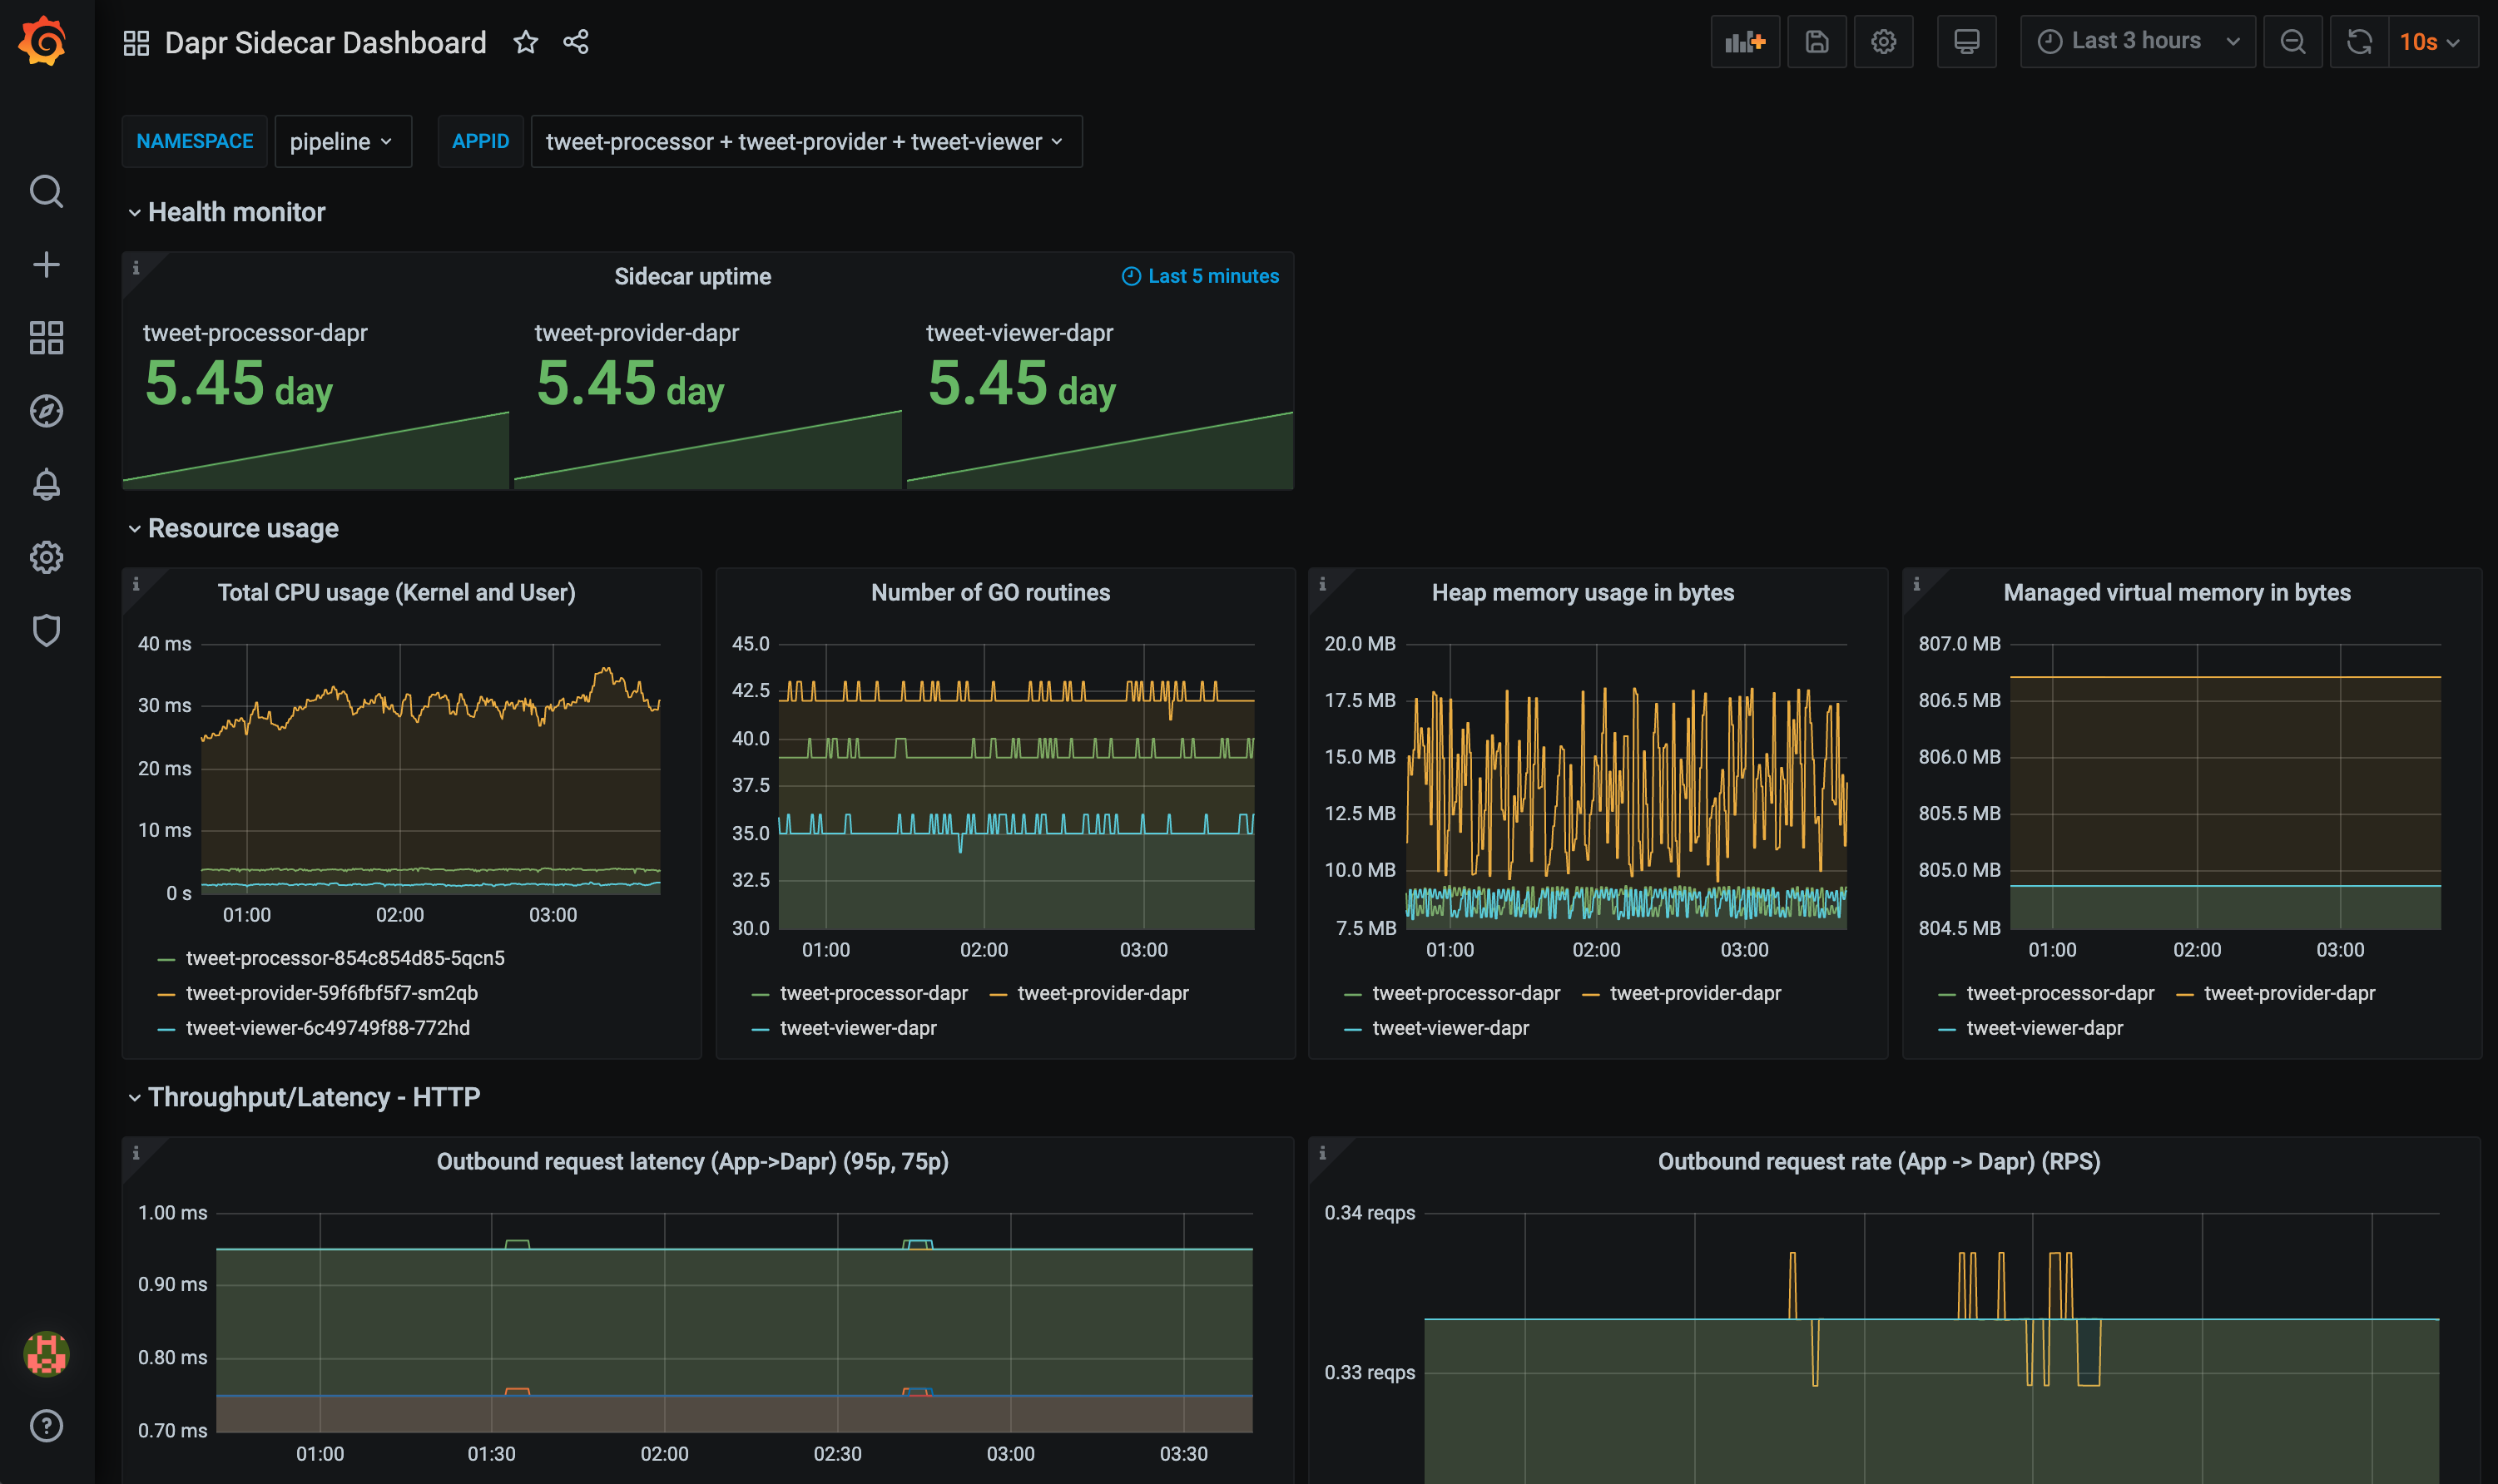
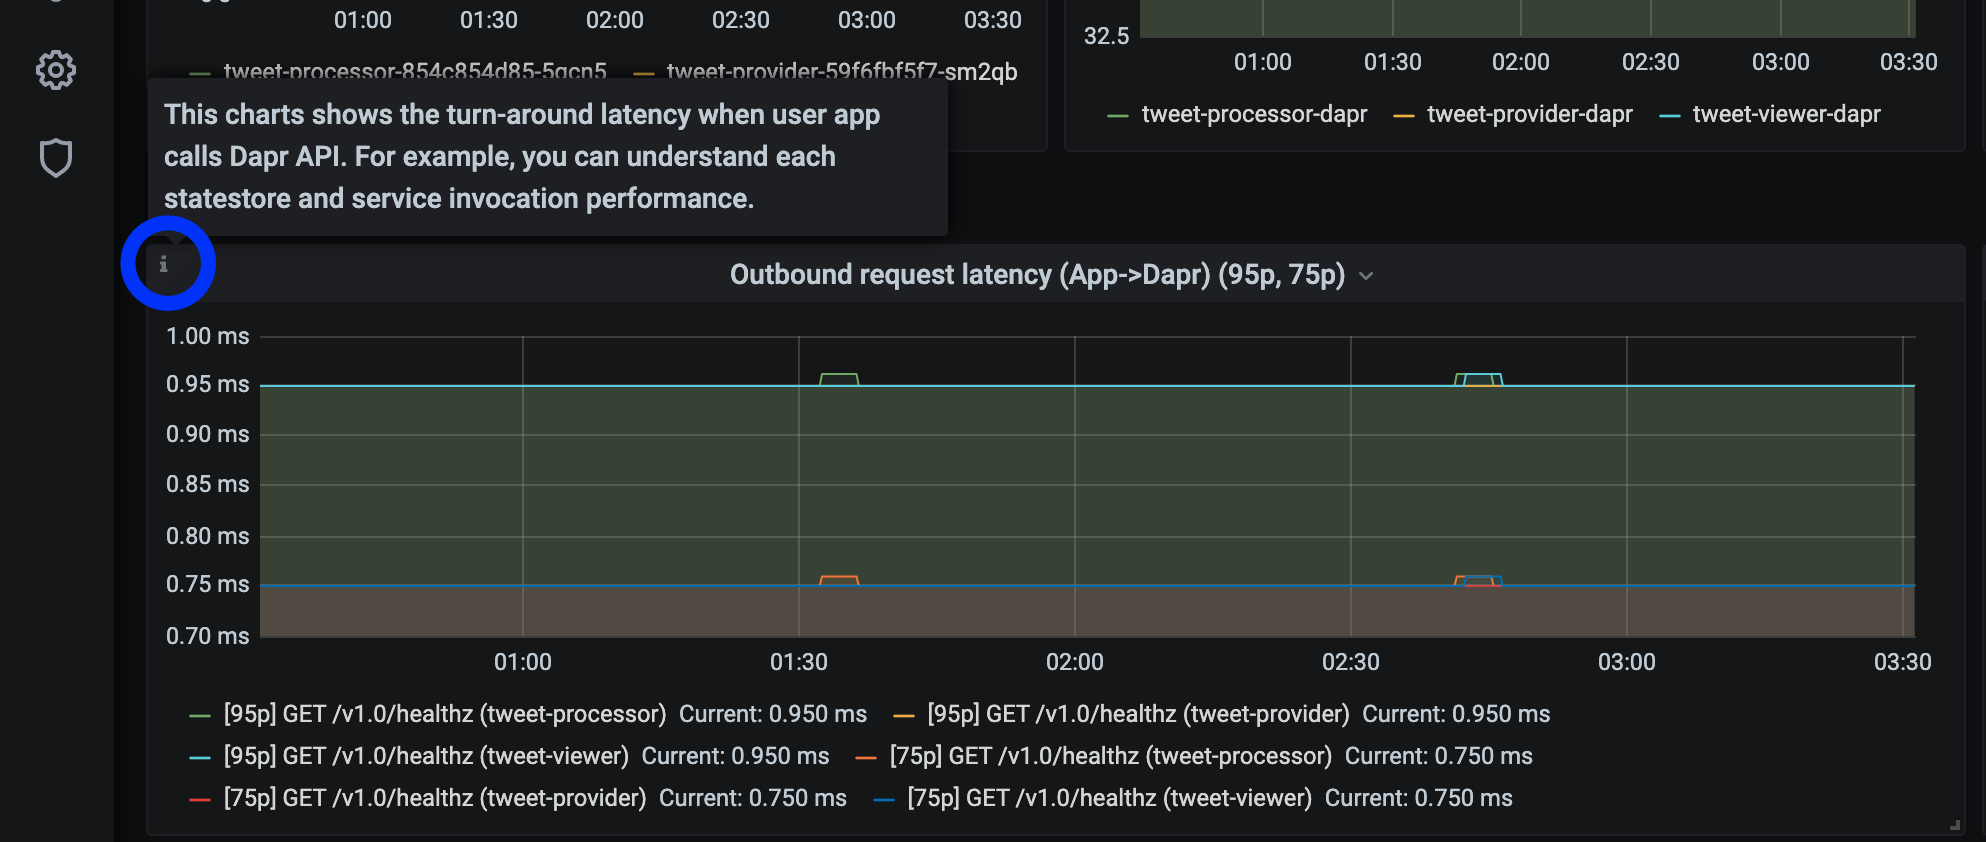
The grafana-sidecar-dashboard.json template shows Dapr sidecar status, including sidecar health/resources, throughput/latency of HTTP and gRPC, Actor, mTLS, etc.:
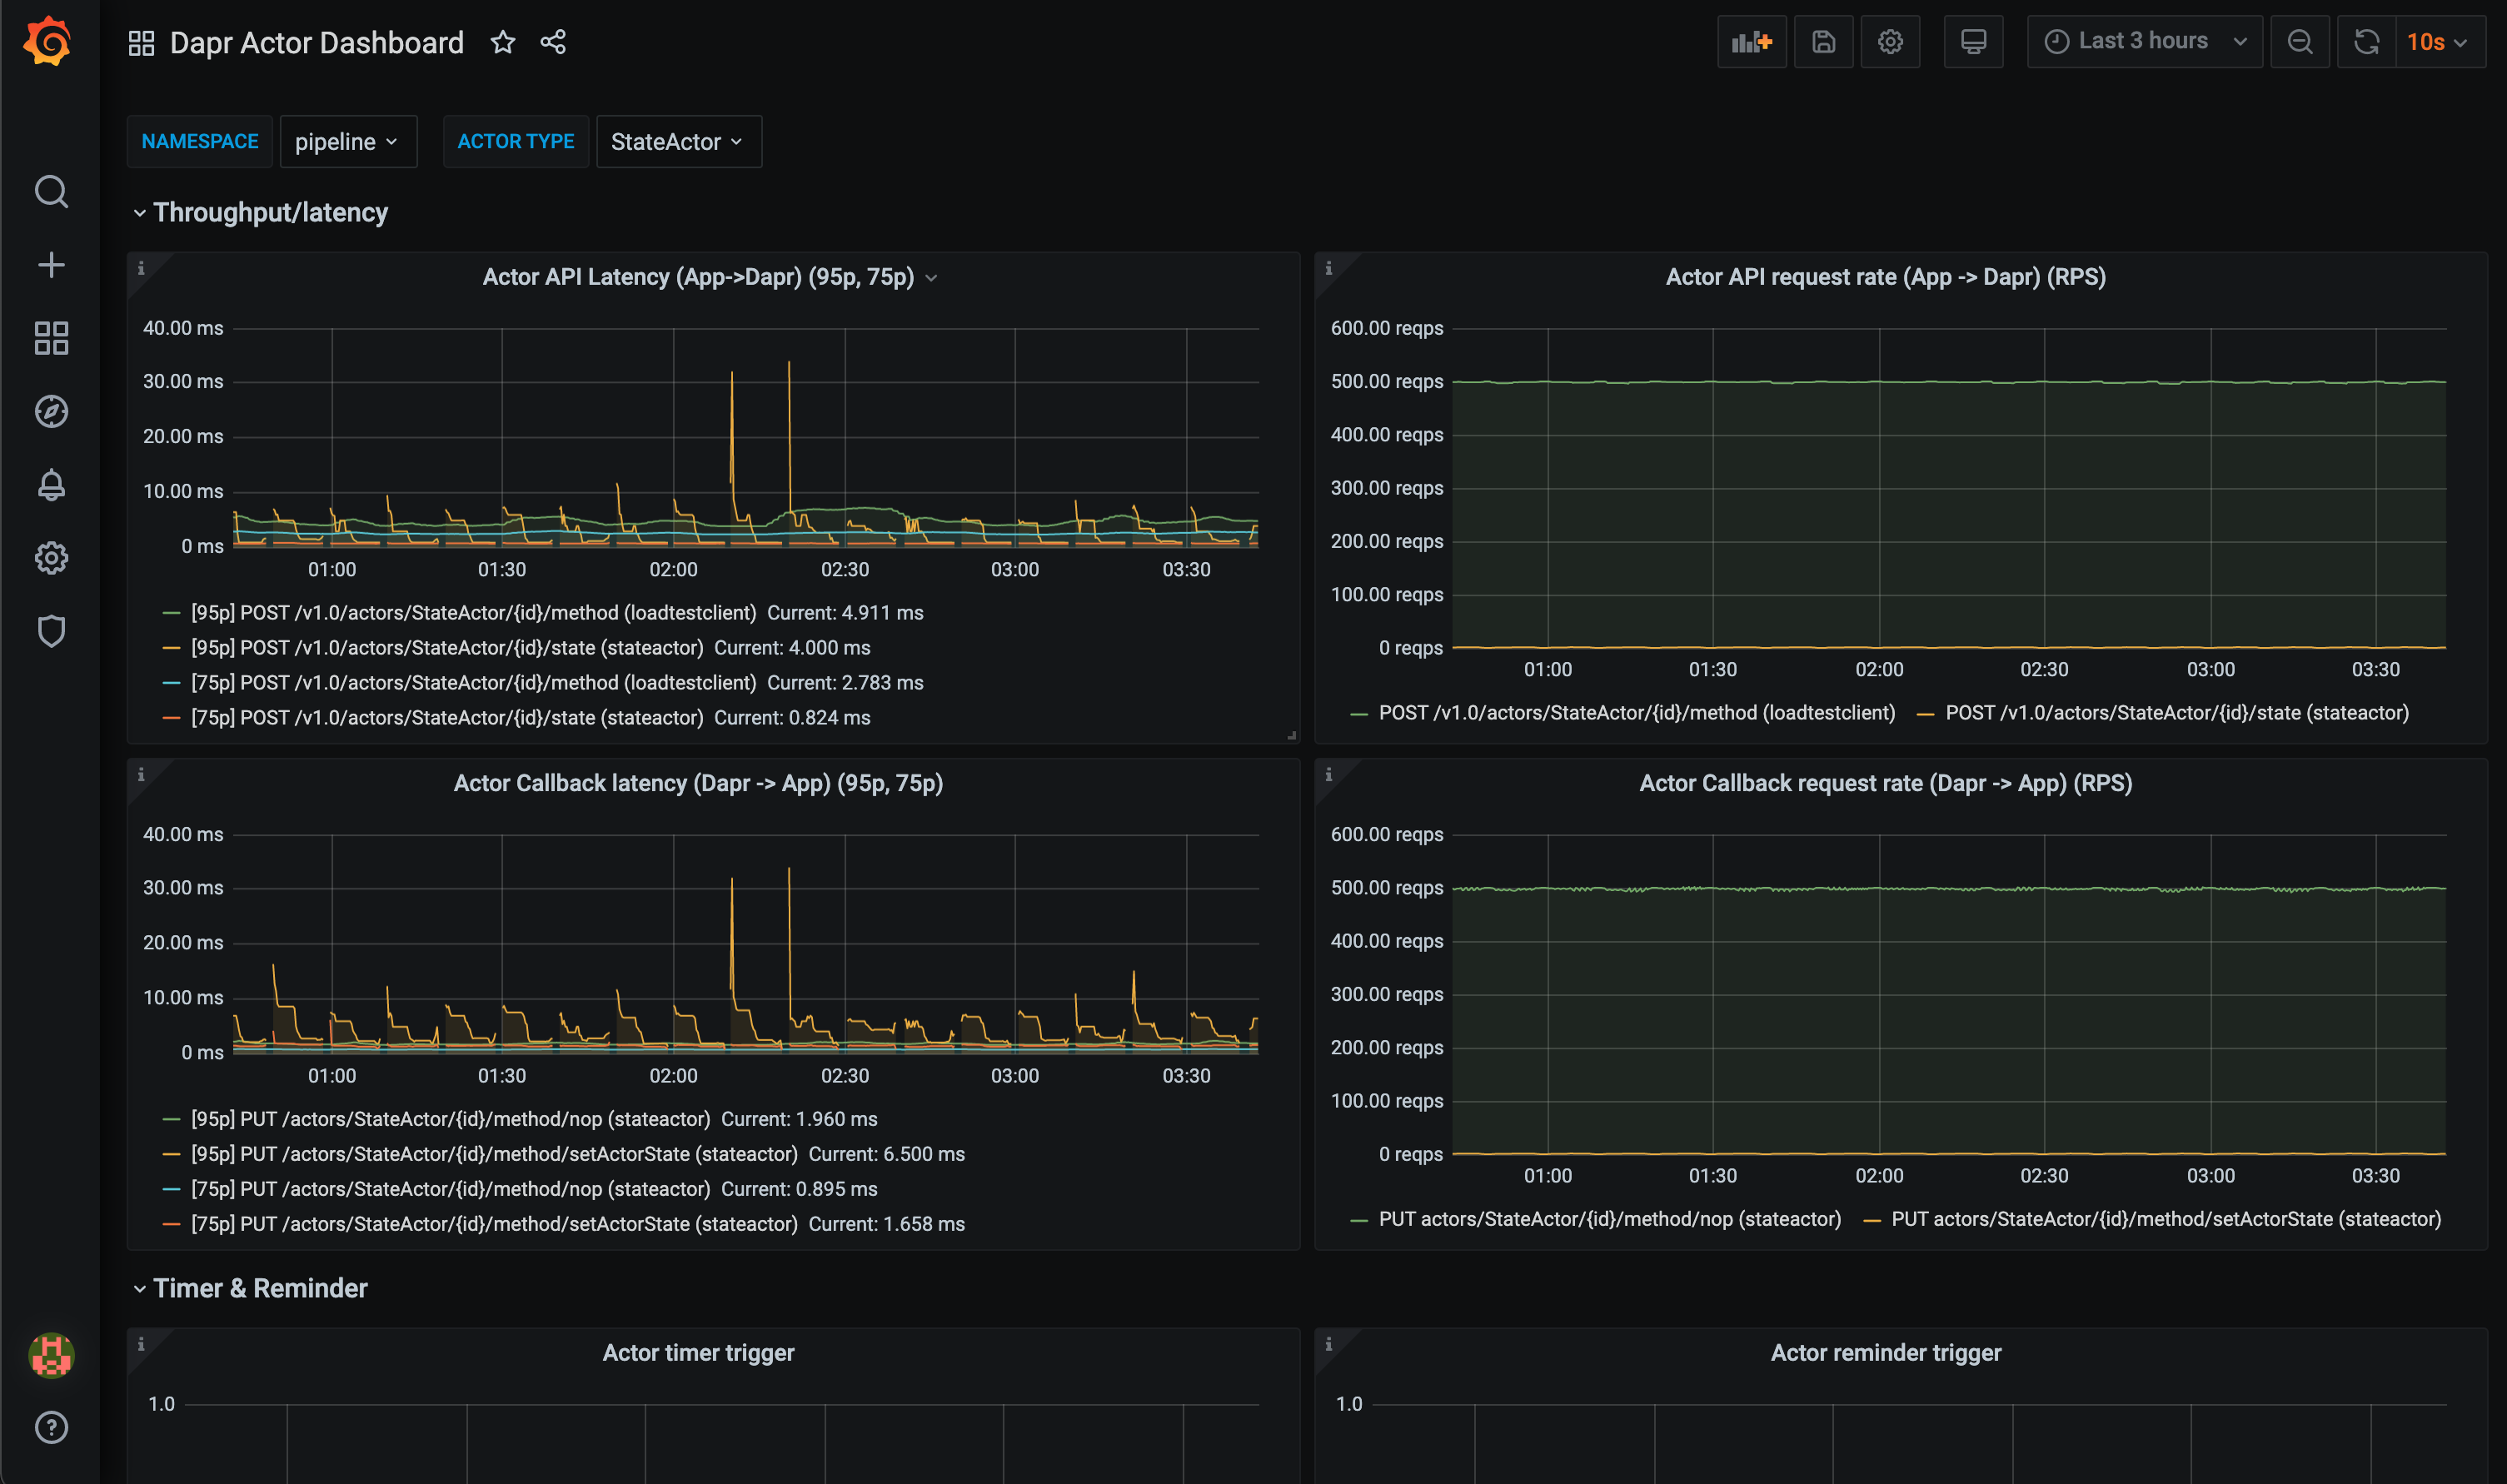
The grafana-actor-dashboard.json template shows Dapr Sidecar status, actor invocation throughput/latency, timer/reminder triggers, and turn-based concurrnecy:
You will get a password similar to cj3m0OfBNx8SLzUlTx91dEECgzRlYJb60D2evof1%. Remove the % character from the password to get cj3m0OfBNx8SLzUlTx91dEECgzRlYJb60D2evof1 as the admin password.
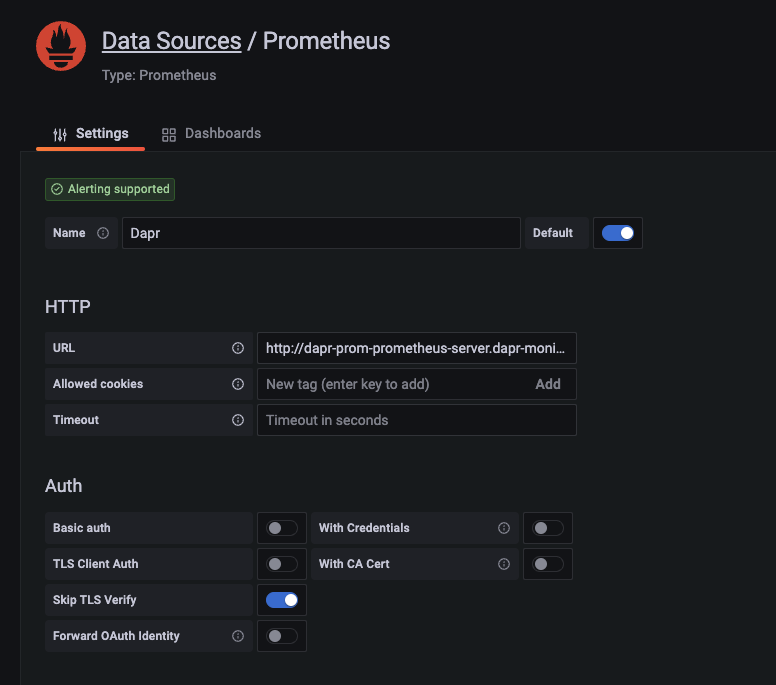
In this guide the server name is dapr-prom-prometheus-server and the namespace is dapr-monitoring, so the HTTP URL will be http://dapr-prom-prometheus-server.dapr-monitoring.
2.4 - How-To: Set-up New Relic to collect and analyze metrics
Set-up New Relic for Dapr metrics
Prerequisites
Perpetually free New Relic account, 100 GB/month of free data ingest, 1 free full access user, unlimited free basic users
Background
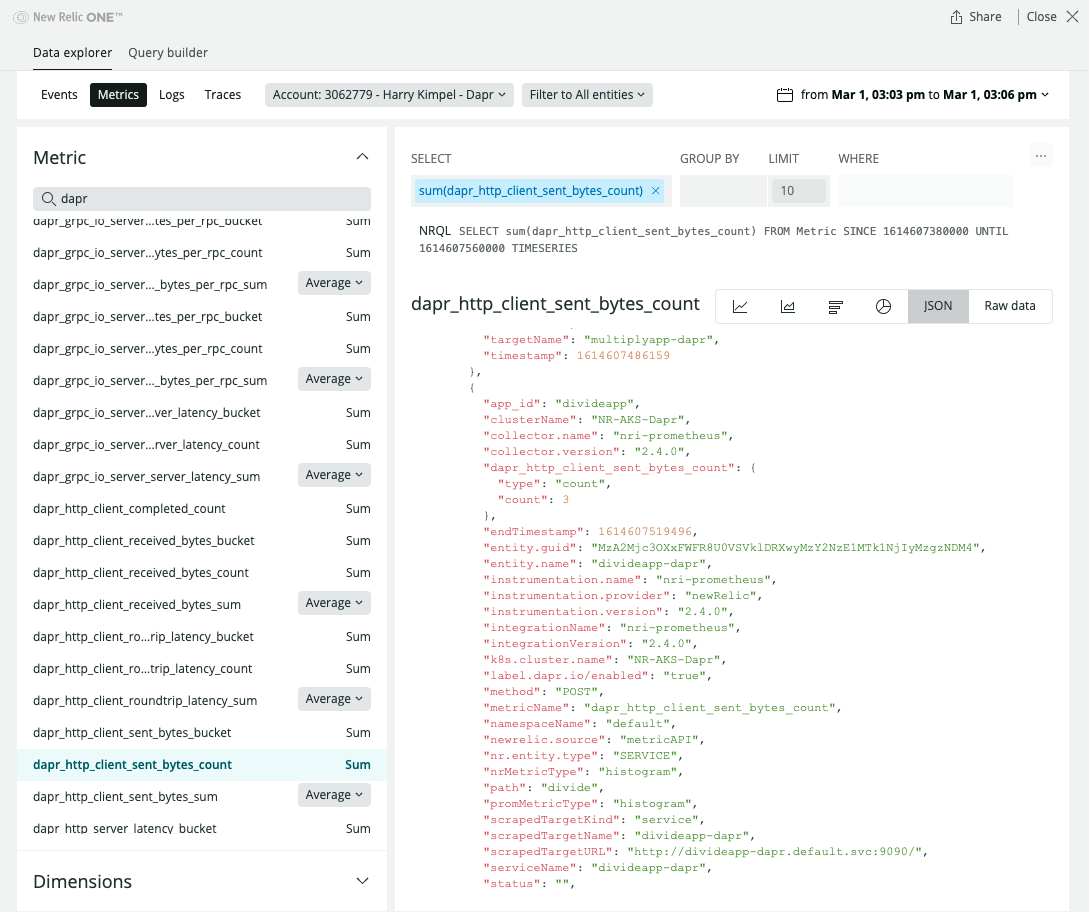
New Relic offers a Prometheus OpenMetrics Integration.
This document explains how to install it in your cluster, either using a Helm chart (recommended).
Installation
Install Helm following the official instructions.
Add the New Relic official Helm chart repository following these instructions
Run the following command to install the New Relic Logging Kubernetes plugin via Helm, replacing the placeholder value YOUR_LICENSE_KEY with your New Relic license key:
How to setup logging for Dapr sidecar, and your application
3.1 - Logs
Understand Dapr logging
Dapr produces structured logs to stdout, either in plain-text or JSON-formatted. By default, all Dapr processes (runtime, or sidecar, and all control plane services) write logs to the console (stdout) in plain-text. To enable JSON-formatted logging, you need to add the --log-as-json command flag when running Dapr processes.
Note
If you want to use a search engine such as Elastic Search or Azure Monitor to search the logs, it is strongly recommended to use JSON-formatted logs which the log collector and search engine can parse using the built-in JSON parser.
time="2022-11-01T17:08:48.303776-07:00"level=info msg="starting Dapr Runtime -- version 1.9.0 -- commit v1.9.0-g5dfcf2e"instance=dapr-pod-xxxx scope=dapr.runtime type=log ver=1.9.0
time="2022-11-01T17:08:48.303913-07:00"level=info msg="log level set to: info"instance=dapr-pod-xxxx scope=dapr.runtime type=log ver=1.9.0
JSON-formatted log examples
{"instance":"dapr-pod-xxxx","level":"info","msg":"starting Dapr Runtime -- version 1.9.0 -- commit v1.9.0-g5dfcf2e","scope":"dapr.runtime","time":"2022-11-01T17:09:45.788005Z","type":"log","ver":"1.9.0"}{"instance":"dapr-pod-xxxx","level":"info","msg":"log level set to: info","scope":"dapr.runtime","time":"2022-11-01T17:09:45.788075Z","type":"log","ver":"1.9.0"}
Log formats
Dapr supports printing either plain-text, the default, or JSON-formatted logs.
To use JSON-formatted logs, you need to add additional configuration options when you install Dapr and when deploy your apps. The recommendation is to use JSON-formatted logs because most log collectors and search engines can parse JSON more easily with built-in parsers.
Enabling JSON logging with the Dapr CLI
When using the Dapr CLI to run an application, pass the --log-as-json option to enable JSON-formatted logs, for example:
The following steps describe how to configure JSON-formatted logs for Kubernetes
Dapr control plane
All services in the Dapr control plane (such as operator, sentry, etc) support a --log-as-json option to enable JSON-formatted logging.
If you’re deploying Dapr to Kubernetes using a Helm chart, you can enable JSON-formatted logs for Dapr system services by passing the --set global.logAsJson=true option; for example:
You can enable JSON-formatted logs in Dapr sidecars by adding the dapr.io/log-as-json: "true" annotation to the deployment, for example:
apiVersion:apps/v1kind:Deploymentmetadata:name:pythonapplabels:app:pythonspec:selector:matchLabels:app:pythontemplate:metadata:labels:app:pythonannotations:dapr.io/enabled:"true"dapr.io/app-id:"pythonapp"# This enables JSON-formatted loggingdapr.io/log-as-json:"true"...
API Logging
API logging enables you to see the API calls your application makes to the Dapr sidecar, to debug issues or monitor the behavior of your application. You can combine both Dapr API logging with Dapr log events.
If you run Dapr in a Kubernetes cluster, Fluentd is a popular container log collector. You can use Fluentd with a JSON parser plugin to parse Dapr JSON-formatted logs. This how-to shows how to configure Fluentd in your cluster.
If you are using Azure Kubernetes Service, you can use the built-in agent to collect logs with Azure Monitor without needing to install Fluentd.
Search engines
If you use Fluentd, we recommend using Elastic Search and Kibana. This how-to shows how to set up Elastic Search and Kibana in your Kubernetes cluster.
By default, the chart creates 3 replicas which must be on different nodes. If your cluster has fewer than 3 nodes, specify a smaller number of replicas. For example, this sets the number of replicas to 1:
Ensure that Fluentd is running as a daemonset. The number of FluentD instances should be the same as the number of cluster nodes. In the example below, there is only one node in the cluster:
$ kubectl get pods -n kube-system -w
NAME                          READY   STATUS    RESTARTS   AGE
coredns-6955765f44-cxjxk      1/1     Running   0          4m41s
coredns-6955765f44-jlskv      1/1     Running   0          4m41s
etcd-m01                      1/1     Running   0          4m48s
fluentd-sdrld                 1/1     Running   0          14s
Note: Elastic Search takes a time to index the logs that Fluentd sends.
Port-forward from localhost to svc/kibana-kibana
$ kubectl port-forward svc/kibana-kibana 5601 -n dapr-monitoring
Forwarding from 127.0.0.1:5601 -> 5601Forwarding from [::1]:5601 -> 5601Handling connection for5601Handling connection for5601
Browse to http://localhost:5601
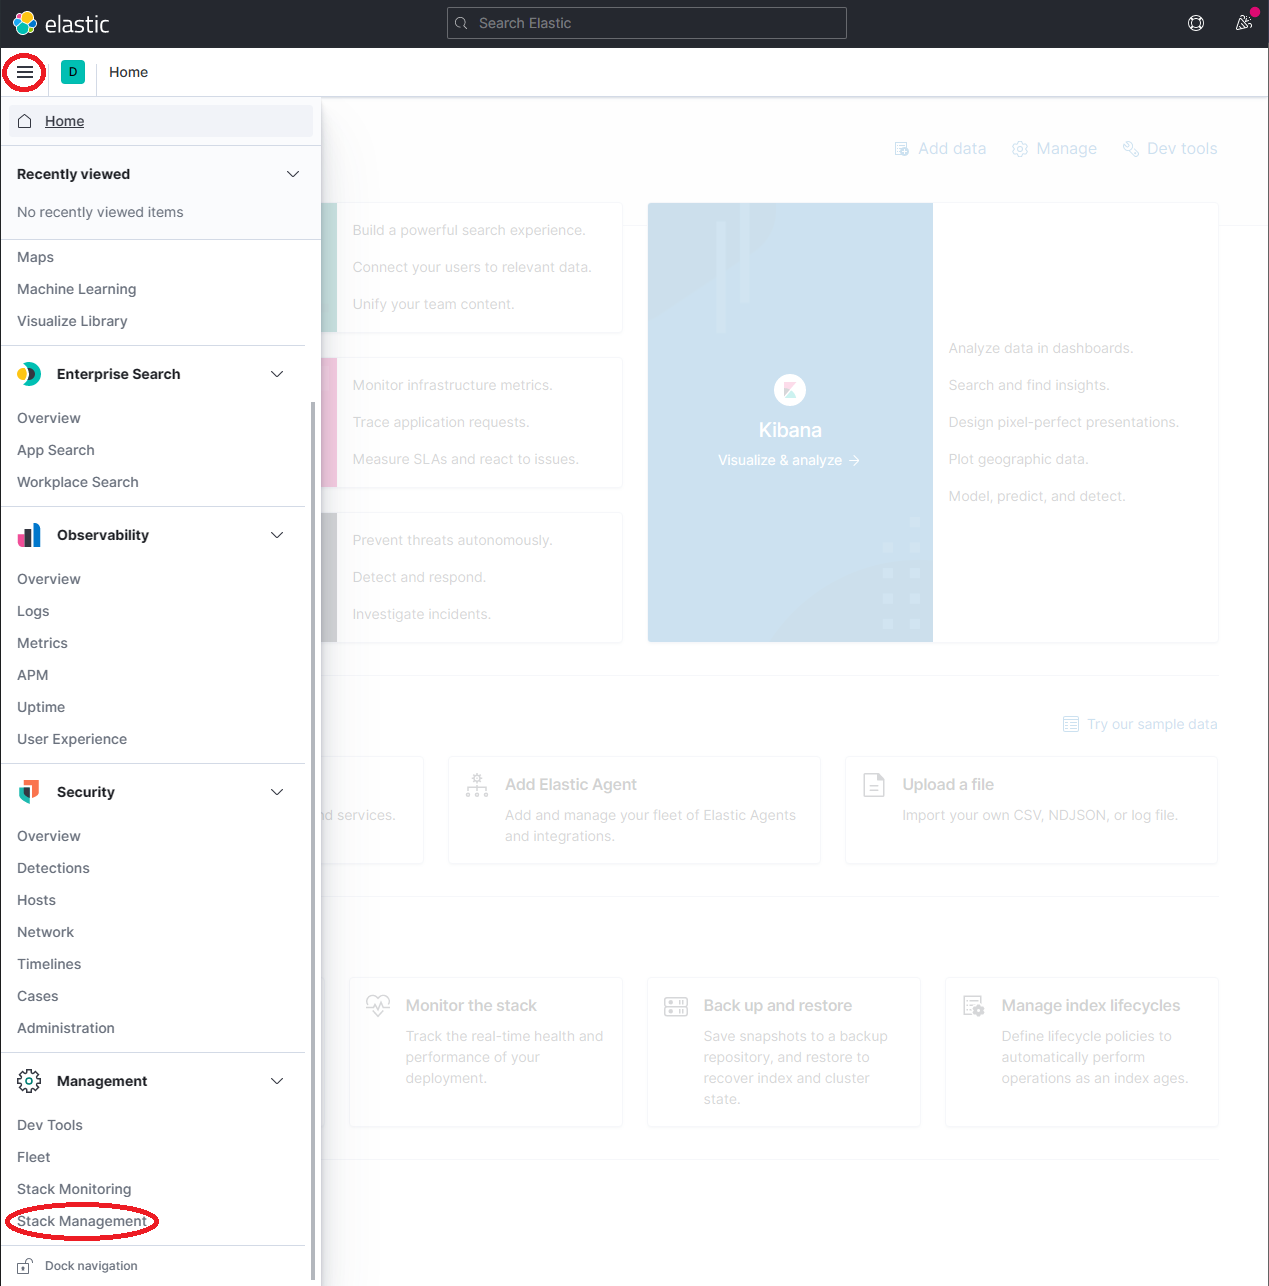
Expand the drop-down menu and click Management → Stack Management
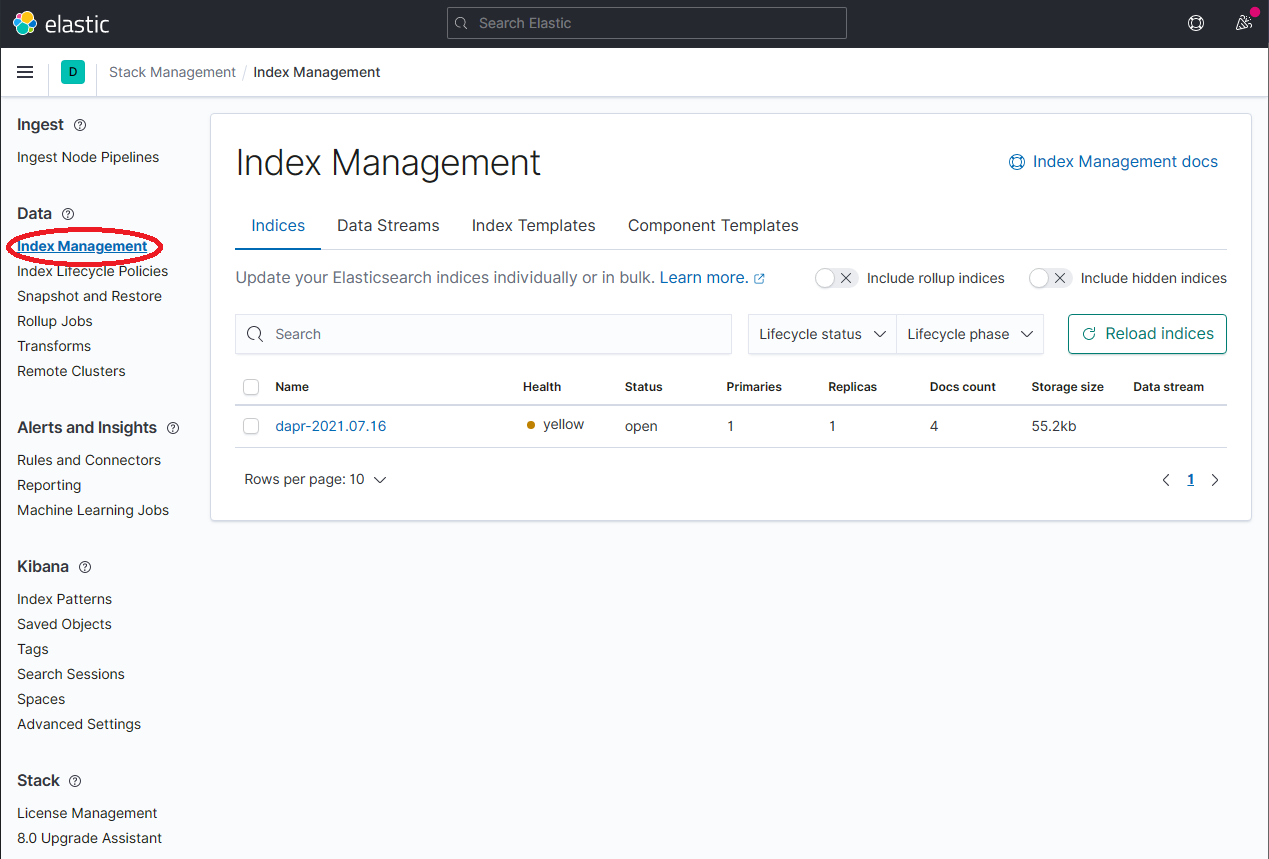
On the Stack Management page, select Data → Index Management and wait until dapr-* is indexed.
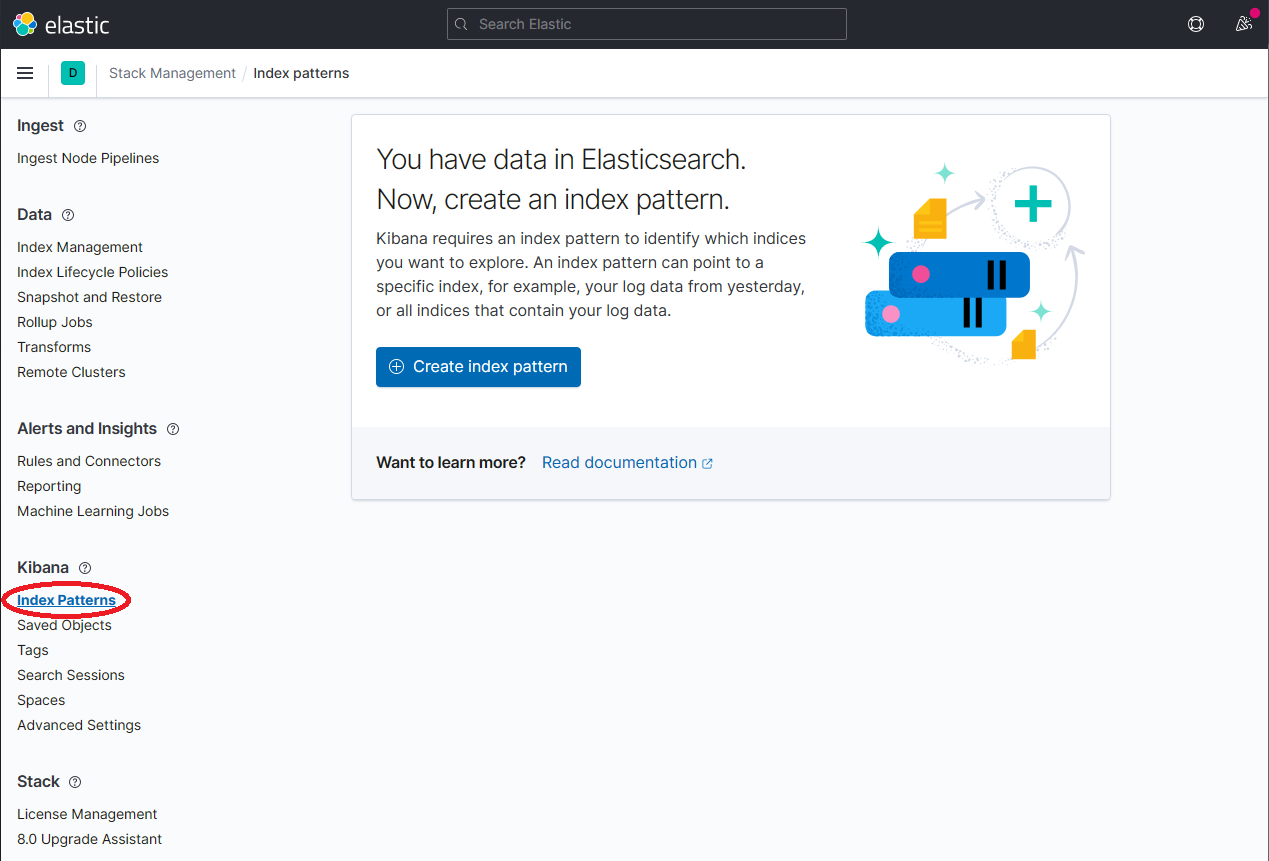
Once dapr-* is indexed, click on Kibana → Index Patterns and then the Create index pattern button.
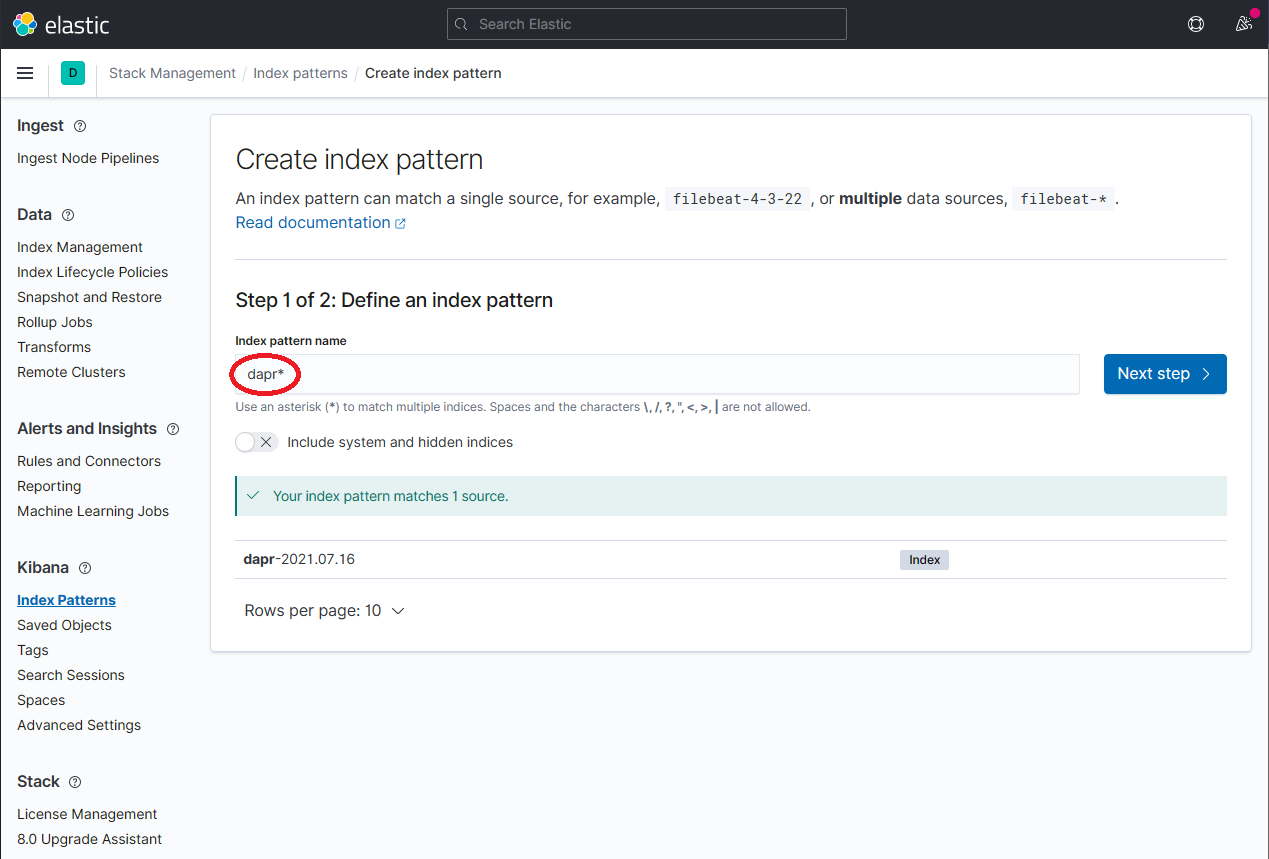
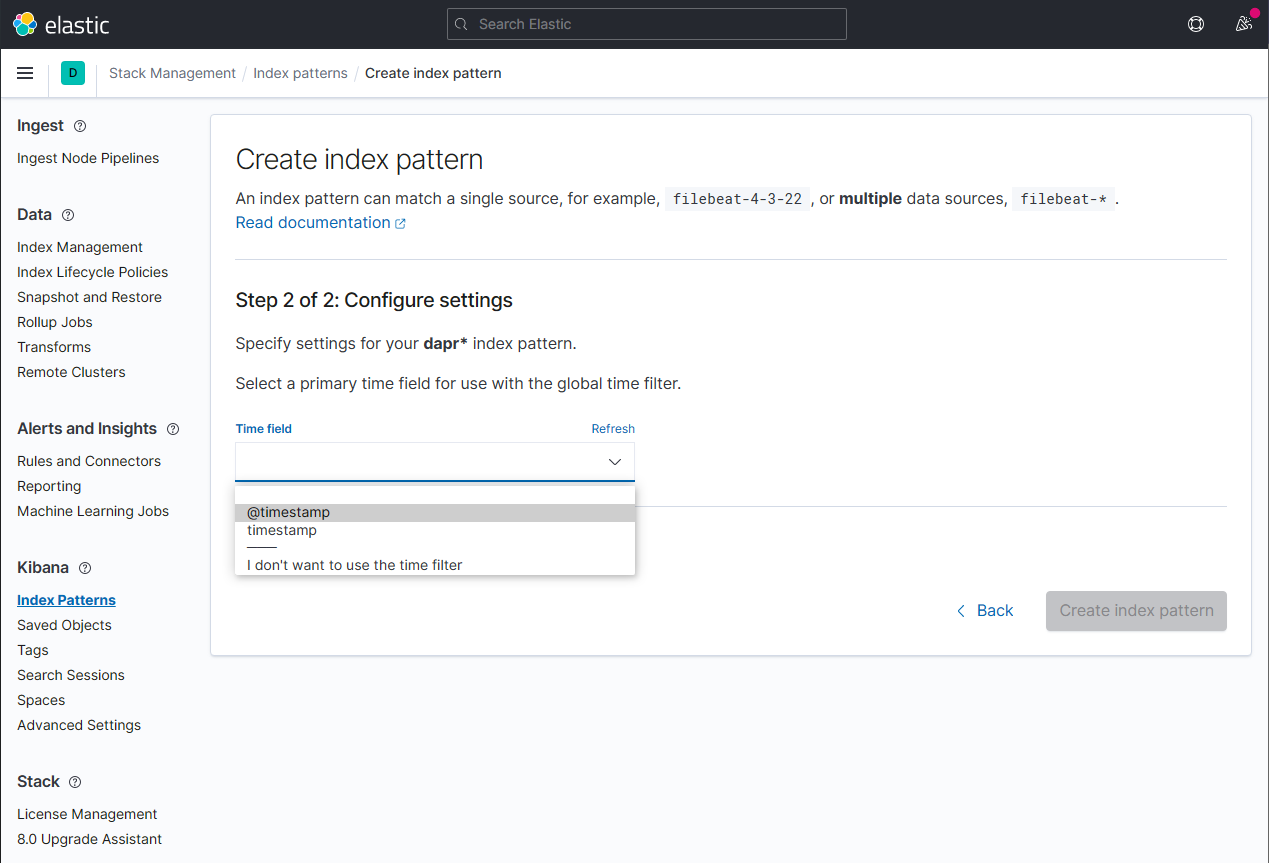
Define a new index pattern by typing dapr* into the Index Pattern name field, then click the Next step button to continue.
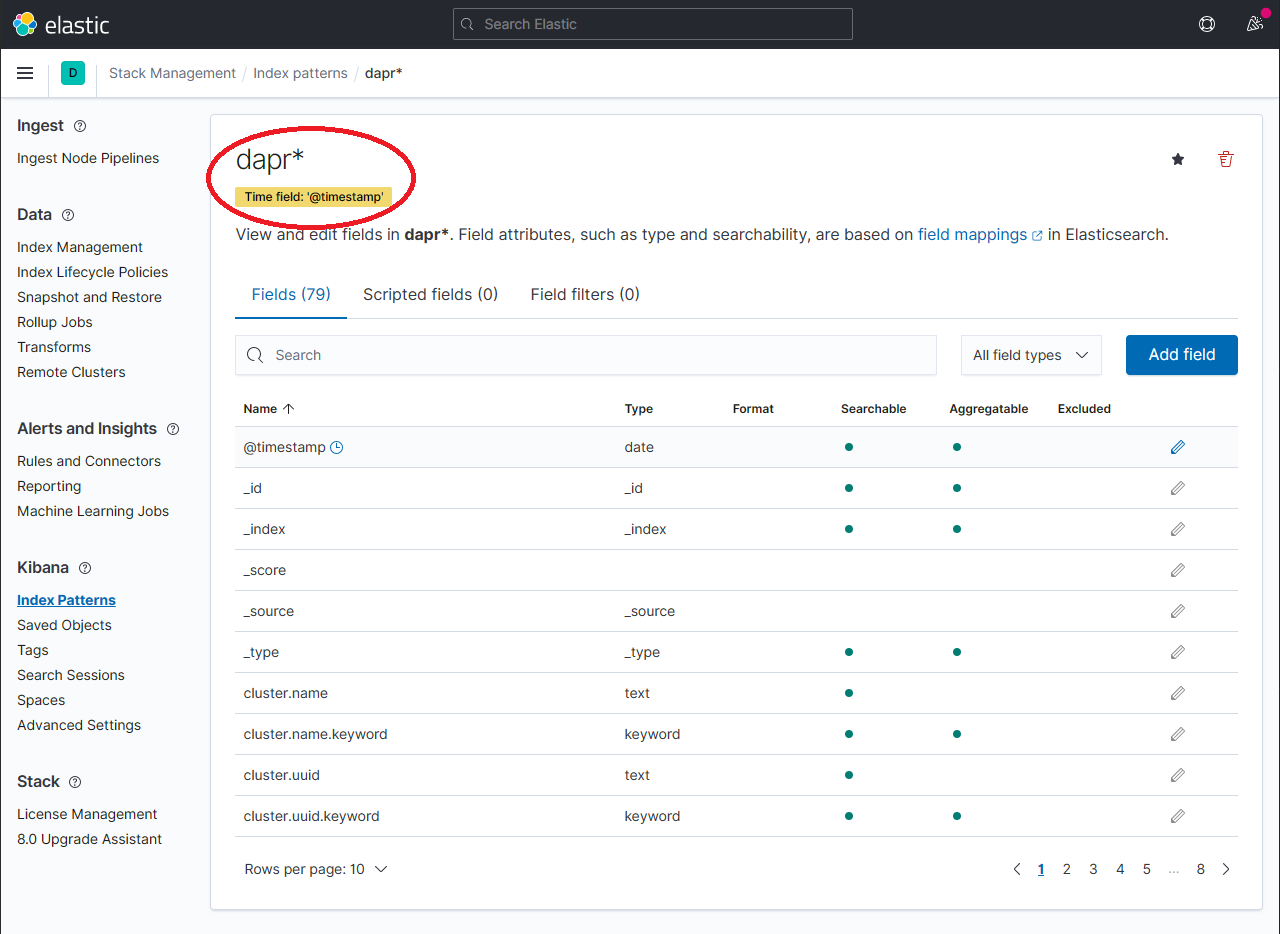
Configure the primary time field to use with the new index pattern by selecting the @timestamp option from the Time field drop-down. Click the Create index pattern button to complete creation of the index pattern.
The newly created index pattern should be shown. Confirm that the fields of interest such as scope, type, app_id, level, etc. are being indexed by using the search box in the Fields tab.
Note: If you cannot find the indexed field, please wait. The time it takes to search across all indexed fields depends on the volume of data and size of the resource that the elastic search is running on.
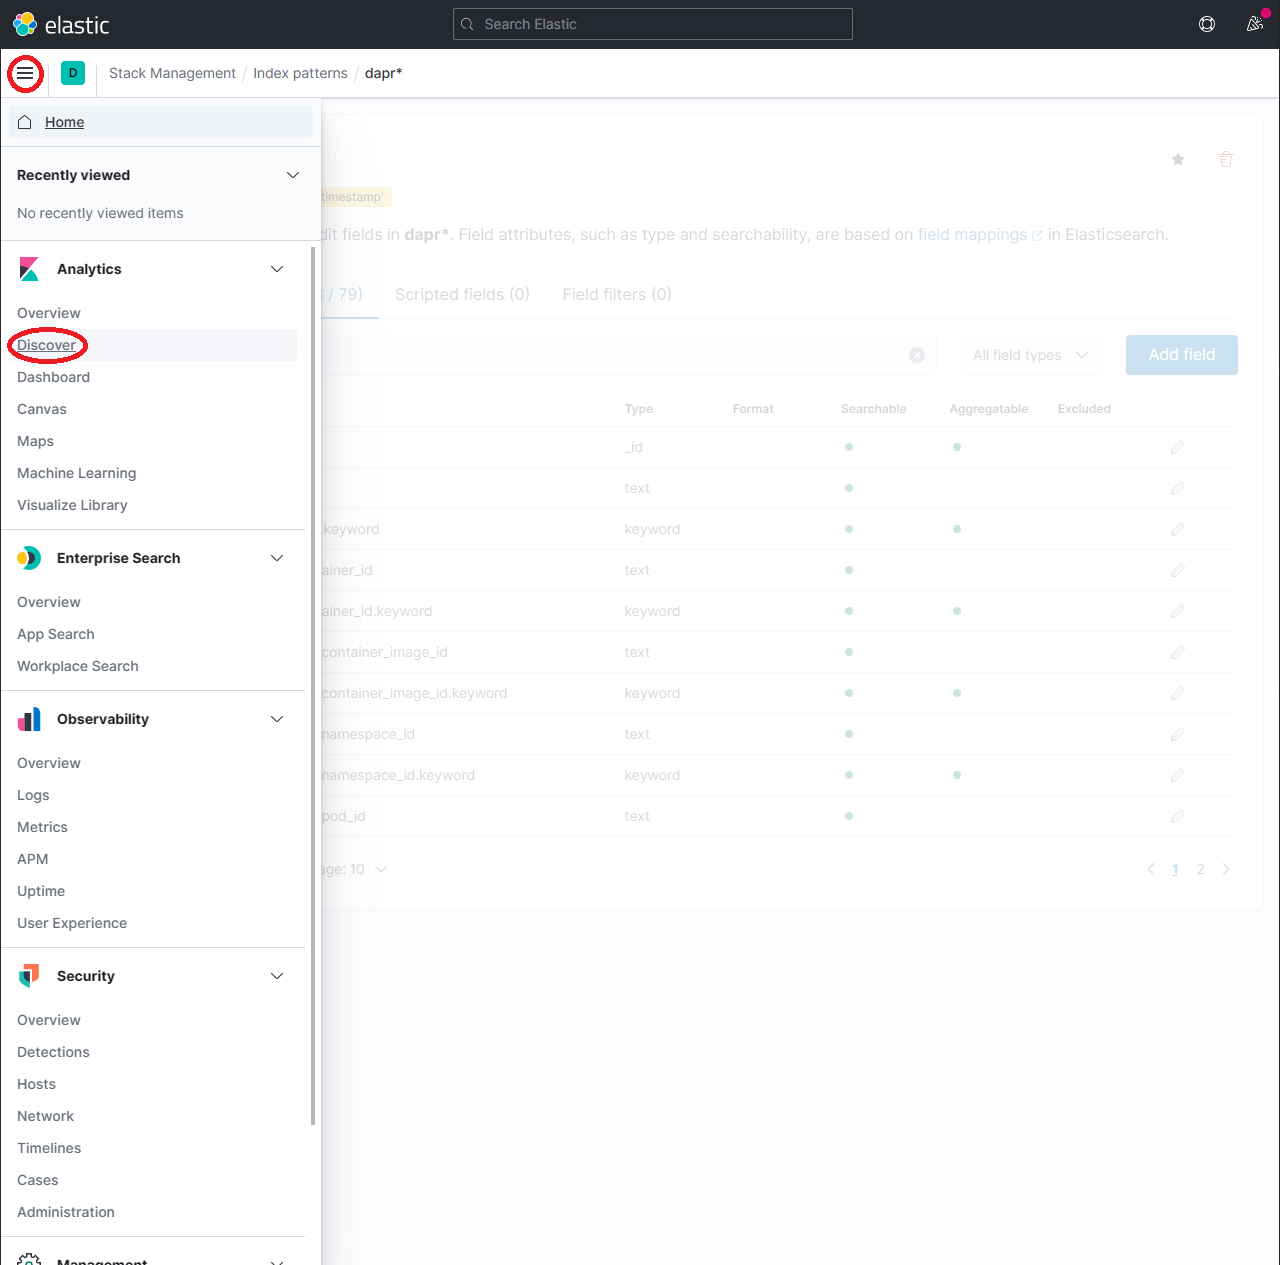
To explore the indexed data, expand the drop-down menu and click Analytics → Discover.
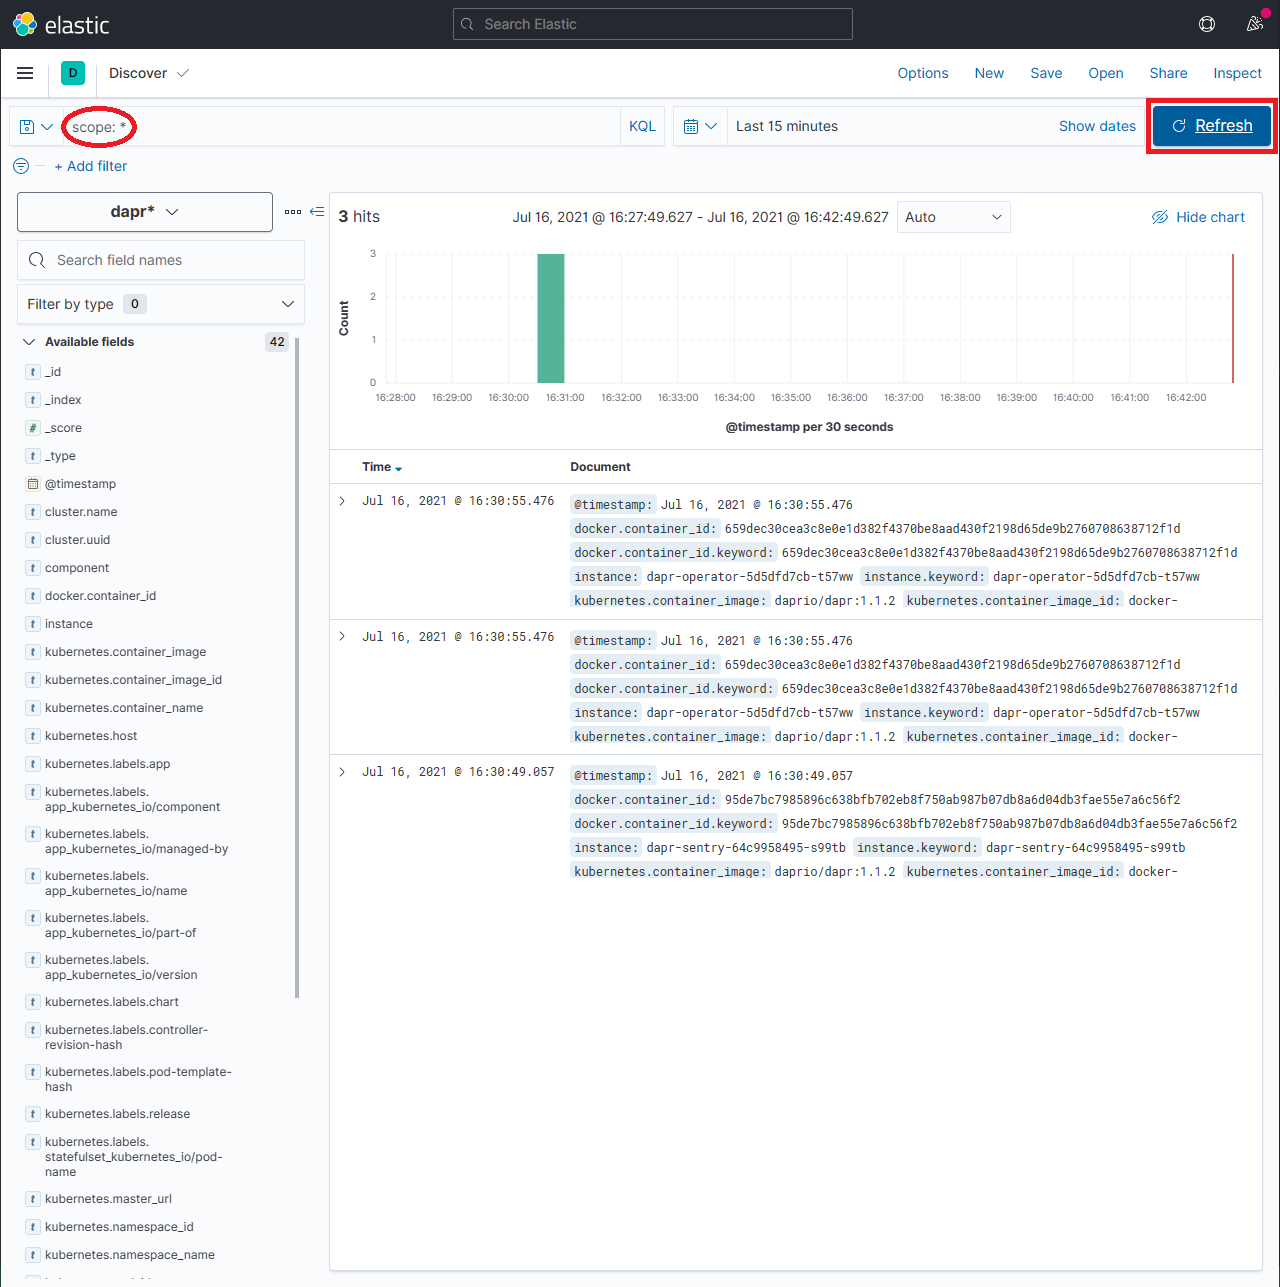
In the search box, type in a query string such as scope:* and click the Refresh button to view the results.
Note: This can take a long time. The time it takes to return all results depends on the volume of data and size of the resource that the elastic search is running on.
Perpetually free New Relic account, 100 GB/month of free data ingest, 1 free full access user, unlimited free basic users
Background
New Relic offers a Fluent Bit output plugin to easily forward your logs to New Relic Logs. This plugin is also provided in a standalone Docker image that can be installed in a Kubernetes cluster in the form of a DaemonSet, which we refer as the Kubernetes plugin.
This document explains how to install it in your cluster, either using a Helm chart (recommended), or manually by applying Kubernetes manifests.
Installation
Install using the Helm chart (recommended)
Install Helm following the official instructions.
Add the New Relic official Helm chart repository following these instructions
Run the following command to install the New Relic Logging Kubernetes plugin via Helm, replacing the placeholder value YOUR_LICENSE_KEY with your New Relic license key:
For EU users, add `–set endpoint=https://log-api.eu.newrelic.com/log/v1 to any of the helm install commands above.
By default, tailing is set to /var/log/containers/*.log. To change this setting, provide your preferred path by adding –set fluentBit.path=DESIRED_PATH to any of the helm install commands above.
Install the Kubernetes manifest
Download the following 3 manifest files into your current working directory:
Once the License key has been added, run the following command in your terminal or command-line interface:
kubectl apply -f .
[OPTIONAL] You can configure how the plugin parses the data by editing the parsers.conf section in the fluent-conf.yml file. For more information, see Fluent Bit’s documentation on Parsers configuration.
By default, tailing is set to /var/log/containers/*.log. To change this setting, replace the default path with your preferred path in the new-relic-fluent-plugin.yml file.