This is the multi-page printable view of this section. Click here to print.
Deploying and configuring Dapr in your environment
- 1: Observability
- 1.1: Tracing
- 1.1.1: Distributed tracing overview
- 1.1.2: W3C trace context overview
- 1.1.3: Configure Dapr to send distributed tracing data
- 1.1.4: Open Telemetry Collector
- 1.1.4.1: Using OpenTelemetry Collector to collect traces
- 1.1.4.2: Using OpenTelemetry Collector to collect traces to send to App Insights
- 1.1.4.3: Using OpenTelemetry Collector to collect traces to send to Jaeger
- 1.1.5: How-To: Set-up New Relic for distributed tracing
- 1.1.6: How-To: Set up Zipkin for distributed tracing
- 1.1.7: How-To: Set up Datadog for distributed tracing
- 1.2: Metrics
- 1.2.1: Configure metrics
- 1.2.2: How-To: Observe metrics with Prometheus
- 1.2.3: How-To: Observe metrics with Grafana
- 1.2.4: How-To: Set-up New Relic to collect and analyze metrics
- 1.2.5: How-To: Set up Azure Monitor to search logs and collect metrics
- 1.3: Logging
- 2: Hosting options for Dapr
- 2.1: Run Dapr in self-hosted mode
- 2.1.1: Overview of Dapr in self-hosted mode
- 2.1.2: How-To: Run Dapr in self-hosted mode with Docker
- 2.1.3: How-To: Run Dapr in self-hosted mode with Podman
- 2.1.4: How-To: Run Dapr in an offline or airgap environment
- 2.1.5: How-To: Run Dapr in self-hosted mode without Docker
- 2.1.6: How-to: Persist Scheduler Jobs
- 2.1.7: Steps to upgrade Dapr in a self-hosted environment
- 2.1.8: Uninstall Dapr in a self-hosted environment
- 2.2: Deploy and run Dapr in Kubernetes mode
- 2.2.1: Overview of Dapr on Kubernetes
- 2.2.2: Kubernetes cluster setup
- 2.2.2.1: Set up a Minikube cluster
- 2.2.2.2: Set up a KiND cluster
- 2.2.2.3: Set up an Azure Kubernetes Service (AKS) cluster
- 2.2.2.4: Set up a Google Kubernetes Engine (GKE) cluster
- 2.2.2.5: Set up an Elastic Kubernetes Service (EKS) cluster
- 2.2.3: Deploy Dapr on a Kubernetes cluster
- 2.2.4: Upgrade Dapr on a Kubernetes cluster
- 2.2.5: Production guidelines on Kubernetes
- 2.2.6: Deploy Dapr per-node or per-cluster with Dapr Shared
- 2.2.7: How-to: Persist Scheduler Jobs
- 2.2.8: Deploy to hybrid Linux/Windows Kubernetes clusters
- 2.2.9: Running Dapr with a Kubernetes Job
- 2.2.10: How-to: Mount Pod volumes to the Dapr sidecar
- 2.3: Run Dapr in a serverless offering
- 2.3.1: Azure Container Apps
- 3: Manage Dapr configuration
- 3.1: Dapr configuration
- 3.2: How-To: Control concurrency and rate limit applications
- 3.3: How-To: Limit the secrets that can be read from secret stores
- 3.4: How-To: Apply access control list configuration for service invocation
- 3.5: How-To: Selectively enable Dapr APIs on the Dapr sidecar
- 3.6: How-To: Configure Dapr to use gRPC
- 3.7: How-To: Handle large HTTP header size
- 3.8: How-To: Handle large http body requests
- 3.9: How-To: Install certificates in the Dapr sidecar
- 3.10: How-To: Enable preview features
- 3.11: How-To: Configure Environment Variables from Secrets for Dapr sidecar
- 4: Managing components in Dapr
- 4.1: Certification lifecycle
- 4.2: Updating components
- 4.3: How-To: Scope components to one or more applications
- 4.4: How-To: Reference secrets in components
- 4.5: State stores components
- 4.6: Pub/Sub brokers
- 4.7: Secret store components
- 4.8: Bindings components
- 4.9: How-To: Register a pluggable component
- 4.10: Configure middleware components
- 5: Securing Dapr deployments
- 5.1: Setup & configure mTLS certificates
- 5.2: Configure endpoint authorization with OAuth
- 5.3: Enable API token authentication in Dapr
- 5.4: Authenticate requests from Dapr using token authentication
- 6: Error recovery using resiliency policies
- 6.1: Overview
- 6.2: Resiliency policies
- 6.2.1: Timeout resiliency policies
- 6.2.2: Retry and back-off resiliency policies
- 6.2.2.1: Retry resiliency policies
- 6.2.2.2: Override default retry resiliency policies
- 6.2.3: Circuit breaker resiliency policies
- 6.2.4: Default resiliency policies
- 6.3: Targets
- 6.4: Health checks
- 6.4.1: App health checks
- 6.4.2: Sidecar health
- 7: Support and versioning
- 7.1: Versioning policy
- 7.2: Supported runtime and SDK releases
- 7.3: Breaking changes and deprecations
- 7.4: Reporting security issues
- 7.5: Preview features
- 7.6: Alpha and Beta APIs
- 8: Performance and scalability statistics of Dapr
- 9: Debugging and Troubleshooting
1 - Observability
The following overview video and demo demonstrates how observability in Dapr works.
More about Dapr Observability
Learn more about how to use Dapr Observability:
- Explore observability via any of the supporting Dapr SDKs.
- Review the Observability API reference documentation.
- Read the general overview of the observability concept in Dapr.
1.1 - Tracing
1.1.1 - Distributed tracing overview
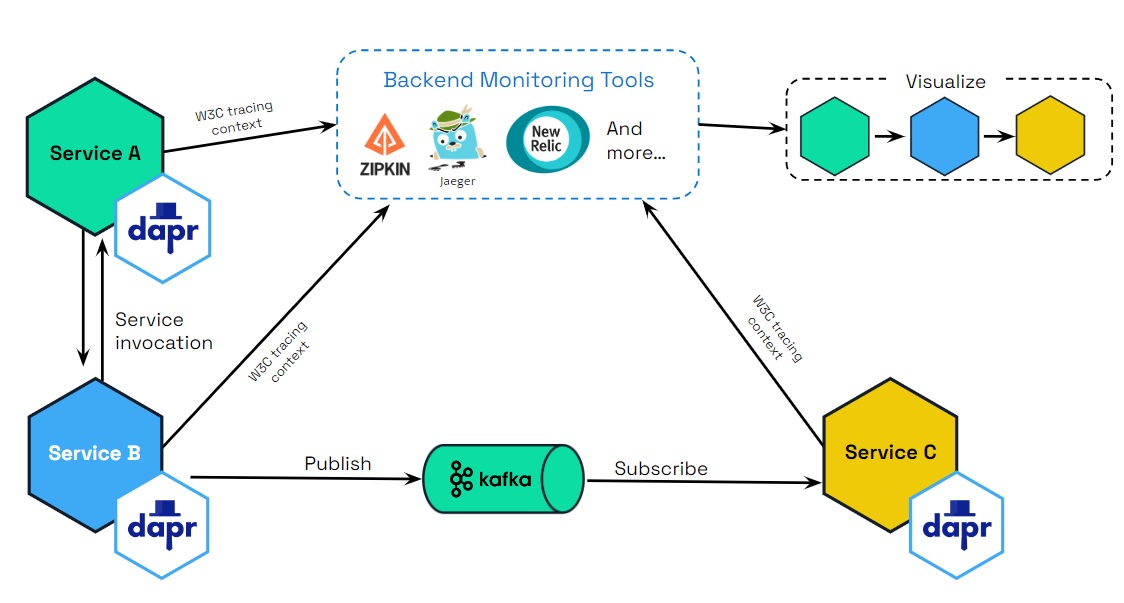
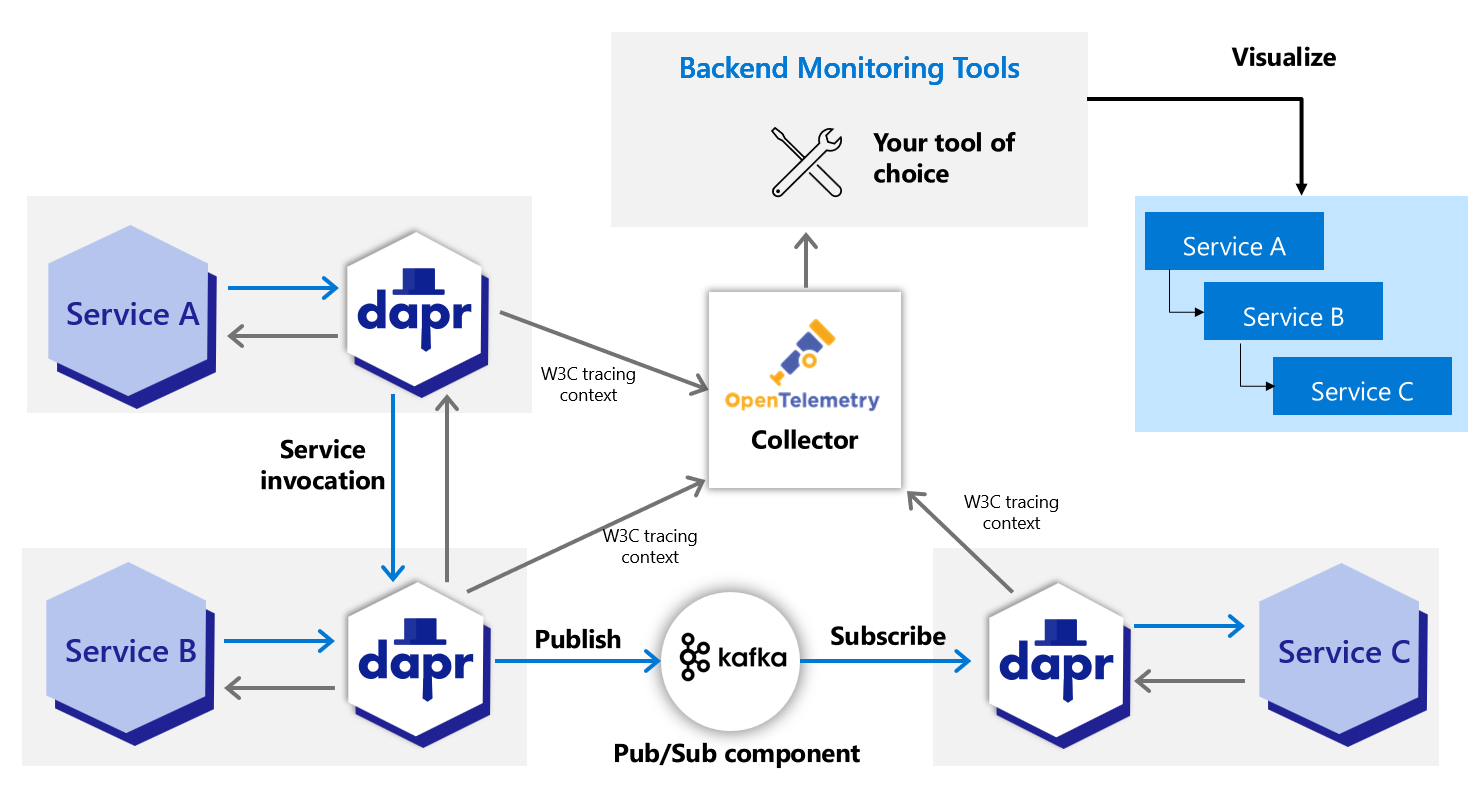
Dapr uses the Open Telemetry (OTEL) and Zipkin protocols for distributed traces. OTEL is the industry standard and is the recommended trace protocol to use.
Most observability tools support OTEL, including:
The following diagram demonstrates how Dapr (using OTEL and Zipkin protocols) integrates with multiple observability tools.
Scenarios
Tracing is used with service invocaton and pub/sub APIs. You can flow trace context between services that uses these APIs. There are two scenarios for how tracing is used:
- Dapr generates the trace context and you propagate the trace context to another service.
- You generate the trace context and Dapr propagates the trace context to a service.
Scenario 1: Dapr generates trace context headers
Propagating sequential service calls
Dapr takes care of creating the trace headers. However, when there are more than two services, you’re responsible for propagating the trace headers between them. Let’s go through the scenarios with examples:
Single service invocation call
For example, service A -> service B.
Dapr generates the trace headers in service A, which are then propagated from service A to service B. No further propagation is needed.
Multiple sequential service invocation calls
For example, service A -> service B -> propagate trace headers to -> service C and so on to further Dapr-enabled services.
Dapr generates the trace headers at the beginning of the request in service A, which are then propagated to service B. You are now responsible for taking the headers and propagating them to service C, since this is specific to your application.
In other words, if the app is calling to Dapr and wants to trace with an existing trace header (span), it must always propagate to Dapr (from service B to service C, in this example). Dapr always propagates trace spans to an application.
Note
No helper methods are exposed in Dapr SDKs to propagate and retrieve trace context. You need to use HTTP/gRPC clients to propagate and retrieve trace headers through HTTP headers and gRPC metadata.Request is from external endpoint
For example, from a gateway service to a Dapr-enabled service A.
An external gateway ingress calls Dapr, which generates the trace headers and calls service A. Service A then calls service B and further Dapr-enabled services.
You must propagate the headers from service A to service B. For example: Ingress -> service A -> propagate trace headers -> service B. This is similar to case 2.
Pub/sub messages
Dapr generates the trace headers in the published message topic. For rawPayload messages, it is possible to specify the traceparent header to propagate the tracing information. These trace headers are propagated to any services listening on that topic.
Propagating multiple different service calls
In the following scenarios, Dapr does some of the work for you, with you then creating or propagating trace headers.
Multiple service calls to different services from single service
When you are calling multiple services from a single service, you need to propagate the trace headers. For example:
service A -> service B
[ .. some code logic ..]
service A -> service C
[ .. some code logic ..]
service A -> service D
[ .. some code logic ..]
In this case:
- When
service Afirst callsservice B, Dapr generates the trace headers inservice A. - The trace headers in
service Aare propagated toservice B. - These trace headers are returned in the response from
service Bas part of response headers. - You then need to propagate the returned trace context to the next services, like
service Candservice D, as Dapr does not know you want to reuse the same header.
Scenario 2: You generate your own trace context headers from non-Daprized applications
Generating your own trace context headers is more unusual and typically not required when calling Dapr.
However, there are scenarios where you could specifically choose to add W3C trace headers into a service call. For example, you have an existing application that does not use Dapr. In this case, Dapr still propagates the trace context headers for you.
If you decide to generate trace headers yourself, there are three ways this can be done:
Standard OpenTelemetry SDK
You can use the industry standard OpenTelemetry SDKs to generate trace headers and pass these trace headers to a Dapr-enabled service. This is the preferred method.
Vendor SDK
You can use a vendor SDK that provides a way to generate W3C trace headers and pass them to a Dapr-enabled service.
W3C trace context
You can handcraft a trace context following W3C trace context specifications and pass them to a Dapr-enabled service.
Read the trace context overview for more background and examples on W3C trace context and headers.
Baggage Support
Dapr supports two distinct mechanisms for propagating W3C Baggage alongside trace context:
Context Baggage (OpenTelemetry)
- Follows OpenTelemetry conventions with decoded values
- Used when working with OpenTelemetry context propagation
- Values are stored and transmitted in their original, unencoded form
- Recommended for OpenTelemetry integrations and when working with application context
Header/Metadata Baggage
- You must URL encode special characters (for example,
%20for spaces,%2Ffor slashes) when setting header/metadata baggage - Values remain percent-encoded in transport as required by the W3C Baggage spec
- Values stay encoded when inspecting raw headers/metadata
- Only OpenTelemetry APIs will decode the values
- Example: Use
serverNode=DF%2028(notserverNode=DF 28) when setting header baggage
- You must URL encode special characters (for example,
For security purposes, context baggage and header baggage are strictly separated and never merged between domains. This ensures that baggage values maintain their intended format and security properties.
Using Baggage with Dapr
You can propagate baggage using either mechanism, depending on your use case.
- In your application code: Set the baggage in the context before making a Dapr API call
- When calling Dapr: Pass the context to any Dapr API call
- Inside Dapr: The Dapr runtime automatically picks up the baggage
- Propagation: Dapr automatically propagates the baggage to downstream services, maintaining the appropriate encoding for each mechanism
Here are examples of both mechanisms:
1. Using Context Baggage (OpenTelemetry)
When using OpenTelemetry SDK:
import 	otelbaggage "go.opentelemetry.io/otel/baggage"

// Set baggage in context (values remain unencoded)
baggage, err = otelbaggage.Parse("userId=cassie,serverNode=DF%2028")
...
ctx := otelbaggage.ContextWithBaggage(t.Context(), baggage)
)

// Pass this context to any Dapr API call
client.InvokeMethodWithContent(ctx, "serviceB", ...)
2. Using Header/Metadata Baggage
When using gRPC metadata:
import "google.golang.org/grpc/metadata"

// Set URL-encoded baggage in context
ctx = metadata.AppendToOutgoingContext(ctx,
    "baggage", "userId=cassie,serverNode=DF%2028",
)

// Pass this context to any Dapr API call
client.InvokeMethodWithContent(ctx, "serviceB", ...)
3. Receiving Baggage in Target Service
In your target service, you can access the propagated baggage:
// Using OpenTelemetry (values are automatically decoded)
import "go.opentelemetry.io/otel/baggage"

bag := baggage.FromContext(ctx)
userID := bag.Member("userId").Value()  // "cassie"
// Using raw gRPC metadata (values remain percent-encoded)
import "google.golang.org/grpc/metadata"

md, _ := metadata.FromIncomingContext(ctx)
if values := md.Get("baggage"); len(values) > 0 {
    // values[0] contains the percent-encoded string you set: "userId=cassie,serverNode=DF%2028"
    // Remember: You must URL encode special characters when setting baggage

    // To decode the values, use OpenTelemetry APIs:
    bag, err := baggage.Parse(values[0])
    ...
    userID := bag.Member("userId").Value()  // "cassie"
}
HTTP Example (URL-encoded):
curl -X POST http://localhost:3500/v1.0/invoke/serviceB/method/hello \
  -H "Content-Type: application/json" \
  -H "baggage: userID=cassie,serverNode=DF%2028" \
  -d '{"message": "Hello service B"}'
gRPC Example (URL-encoded):
ctx = grpcMetadata.AppendToOutgoingContext(ctx,
    "baggage", "userID=cassie,serverNode=DF%2028",
)
Common Use Cases
Baggage is useful for:
- Propagating user IDs or correlation IDs across services
- Passing tenant or environment information
- Maintaining consistent context across service boundaries
- Debugging and troubleshooting distributed transactions
Best Practices
Choose the Right Mechanism
- Use Context Baggage when working with OpenTelemetry
- Use Header Baggage when working directly with HTTP/gRPC
Security Considerations
- Be mindful that baggage is propagated across service boundaries
- Don’t include sensitive information in baggage
- Remember that context and header baggage remain separate
Related Links
1.1.2 - W3C trace context overview
Dapr uses the Open Telemetry protocol, which in turn uses the W3C trace context for distributed tracing for both service invocation and pub/sub messaging. Dapr generates and propagates the trace context information, which can be sent to observability tools for visualization and querying.
Background
Distributed tracing is a methodology implemented by tracing tools to follow, analyze, and debug a transaction across multiple software components.
Typically, a distributed trace traverses more than one service, which requires it to be uniquely identifiable. Trace context propagation passes along this unique identification.
In the past, trace context propagation was implemented individually by each different tracing vendor. In multi-vendor environments, this causes interoperability problems, such as:
- Traces collected by different tracing vendors can’t be correlated, as there is no shared unique identifier.
- Traces crossing boundaries between different tracing vendors can’t be propagated, as there is no forwarded, uniformly agreed set of identification.
- Vendor-specific metadata might be dropped by intermediaries.
- Cloud platform vendors, intermediaries, and service providers cannot guarantee to support trace context propagation, as there is no standard to follow.
Previously, most applications were monitored by a single tracing vendor and stayed within the boundaries of a single platform provider, so these problems didn’t have a significant impact.
Today, an increasing number of applications are distributed and leverage multiple middleware services and cloud platforms. This transformation of modern applications requires a distributed tracing context propagation standard.
The W3C trace context specification defines a universally agreed-upon format for the exchange of trace context propagation data (referred to as trace context). Trace context solves the above problems by providing:
- A unique identifier for individual traces and requests, allowing trace data of multiple providers to be linked together.
- An agreed-upon mechanism to forward vendor-specific trace data and avoid broken traces when multiple tracing tools participate in a single transaction.
- An industry standard that intermediaries, platforms, and hardware providers can support.
This unified approach for propagating trace data improves visibility into the behavior of distributed applications, facilitating problem and performance analysis.
W3C trace context and headers format
W3C trace context
Dapr uses the standard W3C trace context headers.
- For HTTP requests, Dapr uses
traceparentheader. - For gRPC requests, Dapr uses
grpc-trace-binheader.
When a request arrives without a trace ID, Dapr creates a new one. Otherwise, it passes the trace ID along the call chain.
W3C trace headers
These are the specific trace context headers that are generated and propagated by Dapr for HTTP and gRPC.
Copy these headers when propagating a trace context header from an HTTP response to an HTTP request:
Traceparent header
The traceparent header represents the incoming request in a tracing system in a common format, understood by all vendors:
traceparent: 00-0af7651916cd43dd8448eb211c80319c-b7ad6b7169203331-01
Learn more about the traceparent fields details.
Tracestate header
The tracestate header includes the parent in a potentially vendor-specific format:
tracestate: congo=t61rcWkgMzE
Learn more about the tracestate fields details.
Baggage Support
Dapr supports W3C Baggage for propagating key-value pairs alongside trace context through two distinct mechanisms:
Context Baggage (OpenTelemetry)
- Follows OpenTelemetry conventions with decoded values
- Used when propagating baggage through application context
- Values are stored in their original, unencoded form
- Example of how it would be printed with OpenTelemetry APIs:
baggage: userId=cassie,serverNode=DF 28,isVIP=true
HTTP Header Baggage
- You must URL encode special characters (for example,
%20for spaces,%2Ffor slashes) when setting header baggage - Values remain percent-encoded in HTTP headers as required by the W3C Baggage spec
- Values stay encoded when inspecting raw headers in Dapr
- Only OpenTelemetry APIs like
otelbaggage.Parse()will decode the values - Example (note the URL-encoded space
%20):curl -X POST http://localhost:3500/v1.0/invoke/serviceB/method/hello \ -H "Content-Type: application/json" \ -H "baggage: userId=cassie,serverNode=DF%2028,isVIP=true" \ -d '{"message": "Hello service B"}'
- You must URL encode special characters (for example,
For security purposes, context baggage and header baggage are strictly separated and never merged between domains. This ensures that baggage values maintain their intended format and security properties in each domain.
Multiple baggage headers are supported and will be combined according to the W3C specification. Dapr automatically propagates baggage across service calls while maintaining the appropriate encoding for each domain.
In the gRPC API calls, trace context is passed through grpc-trace-bin header.
Baggage Support
Dapr supports W3C Baggage for propagating key-value pairs alongside trace context through two distinct mechanisms:
Context Baggage (OpenTelemetry)
- Follows OpenTelemetry conventions with decoded values
- Used when propagating baggage through gRPC context
- Values are stored in their original, unencoded form
- Example of how it would be printed with OpenTelemetry APIs:
baggage: userId=cassie,serverNode=DF 28,isVIP=true
gRPC Metadata Baggage
- You must URL encode special characters (for example,
%20for spaces,%2Ffor slashes) when setting metadata baggage - Values remain percent-encoded in gRPC metadata
- Example (note the URL-encoded space
%20):baggage: userId=cassie,serverNode=DF%2028,isVIP=true
- You must URL encode special characters (for example,
For security purposes, context baggage and metadata baggage are strictly separated and never merged between domains. This ensures that baggage values maintain their intended format and security properties in each domain.
Multiple baggage metadata entries are supported and will be combined according to the W3C specification. Dapr automatically propagates baggage across service calls while maintaining the appropriate encoding for each domain.
Related Links
1.1.3 - Configure Dapr to send distributed tracing data
Note
It is recommended to run Dapr with tracing enabled for any production scenario. You can configure Dapr to send tracing and telemetry data to many observability tools based on your environment, whether it is running in the cloud or on-premises.Configuration
The tracing section under the Configuration spec contains the following properties:
spec:
  tracing:
    samplingRate: "1"
    otel:
      endpointAddress: "myendpoint.cluster.local:4317"
    zipkin:
      endpointAddress: "https://..."
The following table lists the properties for tracing:
| Property | Type | Description |
|---|---|---|
samplingRate | string | Set sampling rate for tracing to be enabled or disabled. |
stdout | bool | True write more verbose information to the traces |
otel.endpointAddress | string | Set the Open Telemetry (OTEL) target hostname and optionally port. If this is used, you do not need to specify the ‘zipkin’ section. |
otel.isSecure | bool | Is the connection to the endpoint address encrypted. |
otel.protocol | string | Set to http or grpc protocol. |
zipkin.endpointAddress | string | Set the Zipkin server URL. If this is used, you do not need to specify the otel section. |
To enable tracing, use a configuration file (in self hosted mode) or a Kubernetes configuration object (in Kubernetes mode). For example, the following configuration object changes the sample rate to 1 (every span is sampled), and sends trace using OTEL protocol to the OTEL server at localhost:4317
apiVersion: dapr.io/v1alpha1
kind: Configuration
metadata:
  name: tracing
spec:
  tracing:
    samplingRate: "1"
    otel:
      endpointAddress: "localhost:4317"
      isSecure: false
      protocol: grpc
Sampling rate
Dapr uses probabilistic sampling. The sample rate defines the probability a tracing span will be sampled and can have a value between 0 and 1 (inclusive). The default sample rate is 0.0001 (i.e. 1 in 10,000 spans is sampled).
Changing samplingRate to 0 disables tracing altogether.
Environment variables
The OpenTelemetry (otel) endpoint can also be configured via an environment variables. The presence of the OTEL_EXPORTER_OTLP_ENDPOINT environment variable turns on tracing for the sidecar.
| Environment Variable | Description |
|---|---|
OTEL_EXPORTER_OTLP_ENDPOINT | Sets the Open Telemetry (OTEL) server hostname and optionally port, turns on tracing |
OTEL_EXPORTER_OTLP_INSECURE | Sets the connection to the endpoint as unencrypted (true/false) |
OTEL_EXPORTER_OTLP_PROTOCOL | Transport protocol (grpc, http/protobuf, http/json) |
Next steps
Learn how to set up tracing with one of the following tools:
1.1.4 - Open Telemetry Collector
1.1.4.1 - Using OpenTelemetry Collector to collect traces
Dapr directly writes traces using the OpenTelemetry (OTLP) protocol as the recommended method. For observability tools that support the OTLP directly, it is recommended to use the OpenTelemetry Collector, as it allows your application to quickly offload data and includes features, such as retries, batching, and encryption. For more information, read the Open Telemetry Collector documentation.
Dapr can also write traces using the Zipkin protocol. Prior to supporting the OTLP protocol, the Zipkin protocol was used with the OpenTelemetry Collector to send traces to observability tools such as AWS X-Ray, Google Cloud Operations Suite, and Azure Monitor. Both protocol approaches are valid, however the OpenTelemetry protocol is the recommended choice.
Prerequisites
- Install Dapr on Kubernetes
- Verify your trace backends are already set up to receive traces
- Review your OTEL Collector exporter’s required parameters:
Set up OTEL Collector to push to your trace backend
Check out the
open-telemetry-collector-generic.yaml.Replace the
<your-exporter-here>section with the correct settings for your trace exporter.- Refer to the OTEL Collector links in the prerequisites section to determine the correct settings.
Apply the configuration with:
kubectl apply -f open-telemetry-collector-generic.yaml
Set up Dapr to send traces to OTEL Collector
Set up a Dapr configuration file to turn on tracing and deploy a tracing exporter component that uses the OpenTelemetry Collector.
Use this
collector-config.yamlfile to create your own configuration.Apply the configuration with:
kubectl apply -f collector-config.yaml
Deploy your app with tracing
Apply the appconfig configuration by adding a dapr.io/config annotation to the container that you want to participate in the distributed tracing, as shown in the following example:
apiVersion: apps/v1
kind: Deployment
metadata:
  ...
spec:
  ...
  template:
    metadata:
      ...
      annotations:
        dapr.io/enabled: "true"
        dapr.io/app-id: "MyApp"
        dapr.io/app-port: "8080"
        dapr.io/config: "appconfig"
Note
If you are using one of the Dapr tutorials, such as distributed calculator, theappconfig configuration is already configured, so no additional settings are needed.You can register multiple tracing exporters at the same time, and the tracing logs are forwarded to all registered exporters.
That’s it! There’s no need to include any SDKs or instrument your application code. Dapr automatically handles the distributed tracing for you.
View traces
Deploy and run some applications. Wait for the trace to propagate to your tracing backend and view them there.
Related links
- Try out the observability quickstart
- Learn how to set tracing configuration options
1.1.4.2 - Using OpenTelemetry Collector to collect traces to send to App Insights
Dapr integrates with OpenTelemetry (OTEL) Collector using the OpenTelemetry protocol (OTLP). This guide walks through an example using Dapr to push traces to Azure Application Insights, using the OpenTelemetry Collector.
Prerequisites
- Install Dapr on Kubernetes
- Create an Application Insights resource and make note of your Application Insights connection string.
Set up OTEL Collector to push to your App Insights instance
To push traces to your Application Insights instance, install the OpenTelemetry Collector on your Kubernetes cluster.
Download and inspect the
open-telemetry-collector-appinsights.yamlfile.Replace the
<CONNECTION_STRING>placeholder with your App Insights connection string.Deploy the OpenTelemetry Collector into the same namespace where your Dapr-enabled applications are running:
kubectl apply -f open-telemetry-collector-appinsights.yaml
Set up Dapr to send traces to the OpenTelemetry Collector
Create a Dapr configuration file to enable tracing and send traces to the OpenTelemetry Collector via OTLP.
Download and inspect the
collector-config-otel.yaml. Update thenamespaceandotel.endpointAddressvalues to align with the namespace where your Dapr-enabled applications and OpenTelemetry Collector are deployed.Apply the configuration with:
kubectl apply -f collector-config-otel.yaml
Deploy your app with tracing
Apply the tracing configuration by adding a dapr.io/config annotation to the Dapr applications that you want to include in distributed tracing, as shown in the following example:
apiVersion: apps/v1
kind: Deployment
metadata:
  ...
spec:
  ...
  template:
    metadata:
      ...
      annotations:
        dapr.io/enabled: "true"
        dapr.io/app-id: "MyApp"
        dapr.io/app-port: "8080"
        dapr.io/config: "tracing"
Note
If you are using one of the Dapr tutorials, such as distributed calculator, you will need to update theappconfig configuration to tracing.You can register multiple tracing exporters at the same time, and the tracing logs are forwarded to all registered exporters.
That’s it! There’s no need to include any SDKs or instrument your application code. Dapr automatically handles the distributed tracing for you.
View traces
Deploy and run some applications. After a few minutes, you should see tracing logs appearing in your App Insights resource. You can also use the Application Map to examine the topology of your services, as shown below:
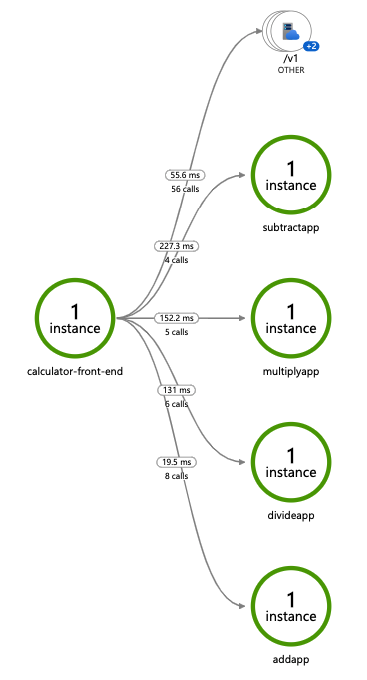
Note
Only operations going through Dapr API exposed by Dapr sidecar (for example, service invocation or event publishing) are displayed in Application Map topology.Related links
- Try out the observability quickstart
- Learn how to set tracing configuration options
1.1.4.3 - Using OpenTelemetry Collector to collect traces to send to Jaeger
While Dapr supports writing traces using OpenTelemetry (OTLP) and Zipkin protocols, Zipkin support for Jaeger has been deprecated in favor of OTLP. Although Jaeger supports OTLP directly, the recommended approach for production is to use the OpenTelemetry Collector to collect traces from Dapr and send them to Jaeger, allowing your application to quickly offload data and take advantage of features like retries, batching, and encryption. For more information, read the Open Telemetry Collector documentation.
Configure Jaeger in self-hosted mode
Local setup
The simplest way to start Jaeger is to run the pre-built, all-in-one Jaeger image published to DockerHub and expose the OTLP port:
docker run -d --name jaeger \
  -p 4317:4317  \
  -p 16686:16686 \
  jaegertracing/all-in-one:1.49
Next, create the following config.yaml file locally:
Note: Because you are using the Open Telemetry protocol to talk to Jaeger, you need to fill out the
otelsection of the tracing configuration and set theendpointAddressto the address of the Jaeger container.
apiVersion: dapr.io/v1alpha1
kind: Configuration
metadata:
  name: tracing
  namespace: default
spec:
  tracing:
    samplingRate: "1"
    stdout: true
    otel:
      endpointAddress: "localhost:4317"
      isSecure: false
      protocol: grpc
To launch the application referring to the new YAML configuration file, use
the --config option. For example:
dapr run --app-id myapp --app-port 3000 node app.js --config config.yaml
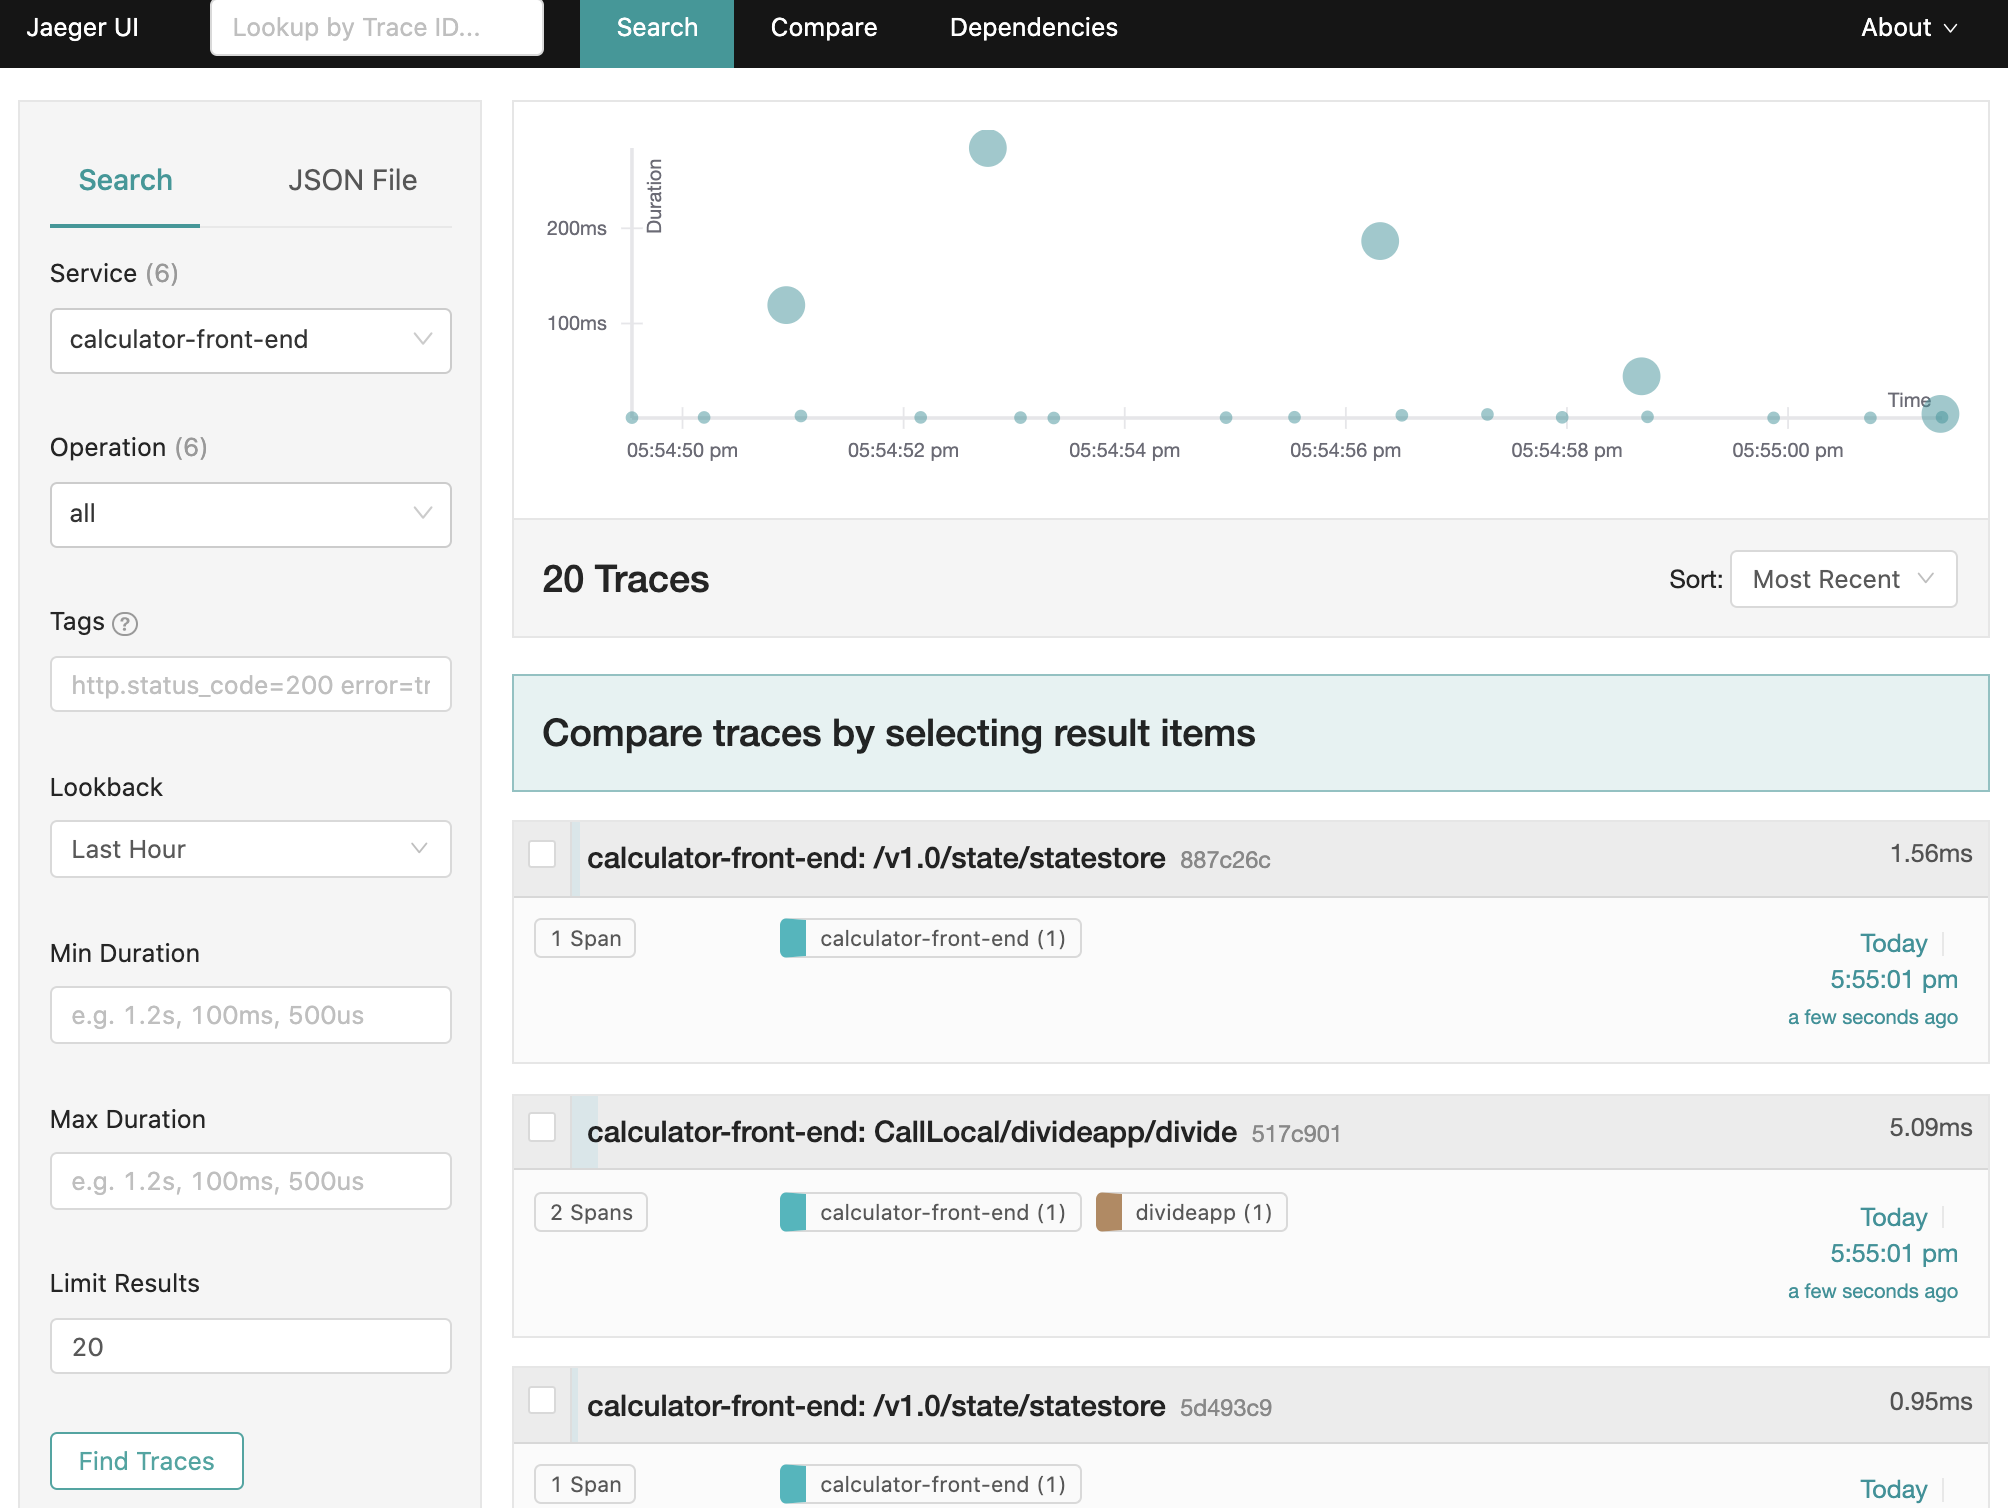
View traces
To view traces in your browser, go to http://localhost:16686 to see the Jaeger UI.
Configure Jaeger on Kubernetes with the OpenTelemetry Collector
The following steps show you how to configure Dapr to send distributed tracing data to the OpenTelemetry Collector which, in turn, sends the traces to Jaeger.
Prerequisites
- Install Dapr on Kubernetes
- Set up Jaeger using the Jaeger Kubernetes Operator
Set up OpenTelemetry Collector to push to Jaeger
To push traces to your Jaeger instance, install the OpenTelemetry Collector on your Kubernetes cluster.
Download and inspect the
open-telemetry-collector-jaeger.yamlfile.In the data section of the
otel-collector-confConfigMap, update theotlp/jaeger.endpointvalue to reflect the endpoint of your Jaeger collector Kubernetes service object.Deploy the OpenTelemetry Collector into the same namespace where your Dapr-enabled applications are running:
kubectl apply -f open-telemetry-collector-jaeger.yaml
Set up Dapr to send traces to OpenTelemetryCollector
Create a Dapr configuration file to enable tracing and export the sidecar traces to the OpenTelemetry Collector.
Use the
collector-config-otel.yamlfile to create your own Dapr configuration.Update the
namespaceandotel.endpointAddressvalues to align with the namespace where your Dapr-enabled applications and OpenTelemetry Collector are deployed.Apply the configuration with:
kubectl apply -f collector-config.yaml
Deploy your app with tracing enabled
Apply the tracing Dapr configuration by adding a dapr.io/config annotation to the application deployment that you want to enable distributed tracing for, as shown in the following example:
apiVersion: apps/v1
kind: Deployment
metadata:
  ...
spec:
  ...
  template:
    metadata:
      ...
      annotations:
        dapr.io/enabled: "true"
        dapr.io/app-id: "MyApp"
        dapr.io/app-port: "8080"
        dapr.io/config: "tracing"
You can register multiple tracing exporters at the same time, and the tracing logs are forwarded to all registered exporters.
That’s it! There’s no need to include the OpenTelemetry SDK or instrument your application code. Dapr automatically handles the distributed tracing for you.
View traces
To view Dapr sidecar traces, port-forward the Jaeger Service and open the UI:
kubectl port-forward svc/jaeger-query 16686 -n observability
In your browser, go to http://localhost:16686 and you will see the Jaeger UI.
References
1.1.5 - How-To: Set-up New Relic for distributed tracing
Prerequisites
- Perpetually free New Relic account, 100 GB/month of free data ingest, 1 free full access user, unlimited free basic users
Configure Dapr tracing
Dapr natively captures metrics and traces that can be send directly to New Relic. The easiest way to export these is by configuring Dapr to send the traces to New Relic’s Trace API using the Zipkin trace format.
In order for the integration to send data to New Relic Telemetry Data Platform, you need a New Relic Insights Insert API key.
apiVersion: dapr.io/v1alpha1
kind: Configuration
metadata:
  name: appconfig
  namespace: default
spec:
  tracing:
    samplingRate: "1"
    zipkin:
      endpointAddress: "https://trace-api.newrelic.com/trace/v1?Api-Key=<NR-INSIGHTS-INSERT-API-KEY>&Data-Format=zipkin&Data-Format-Version=2"
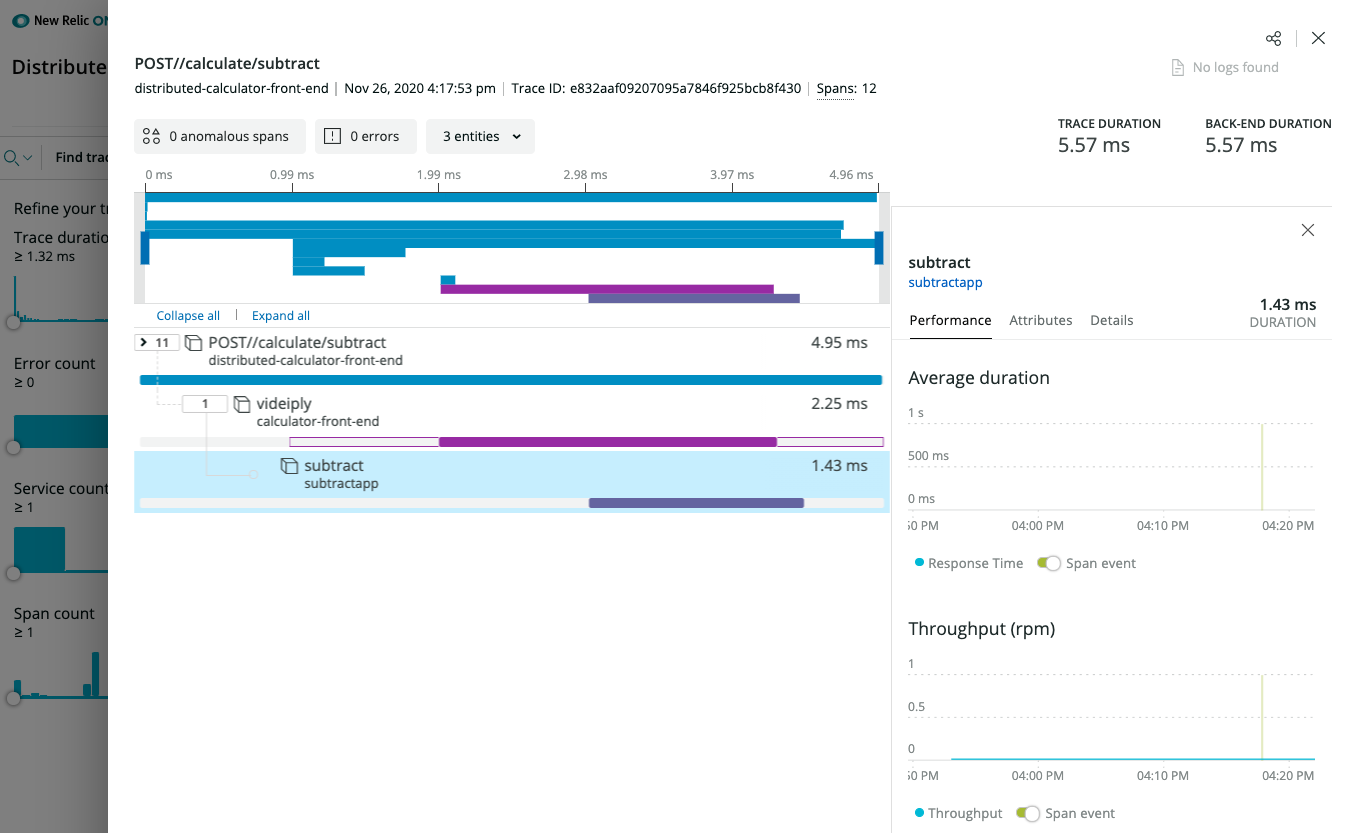
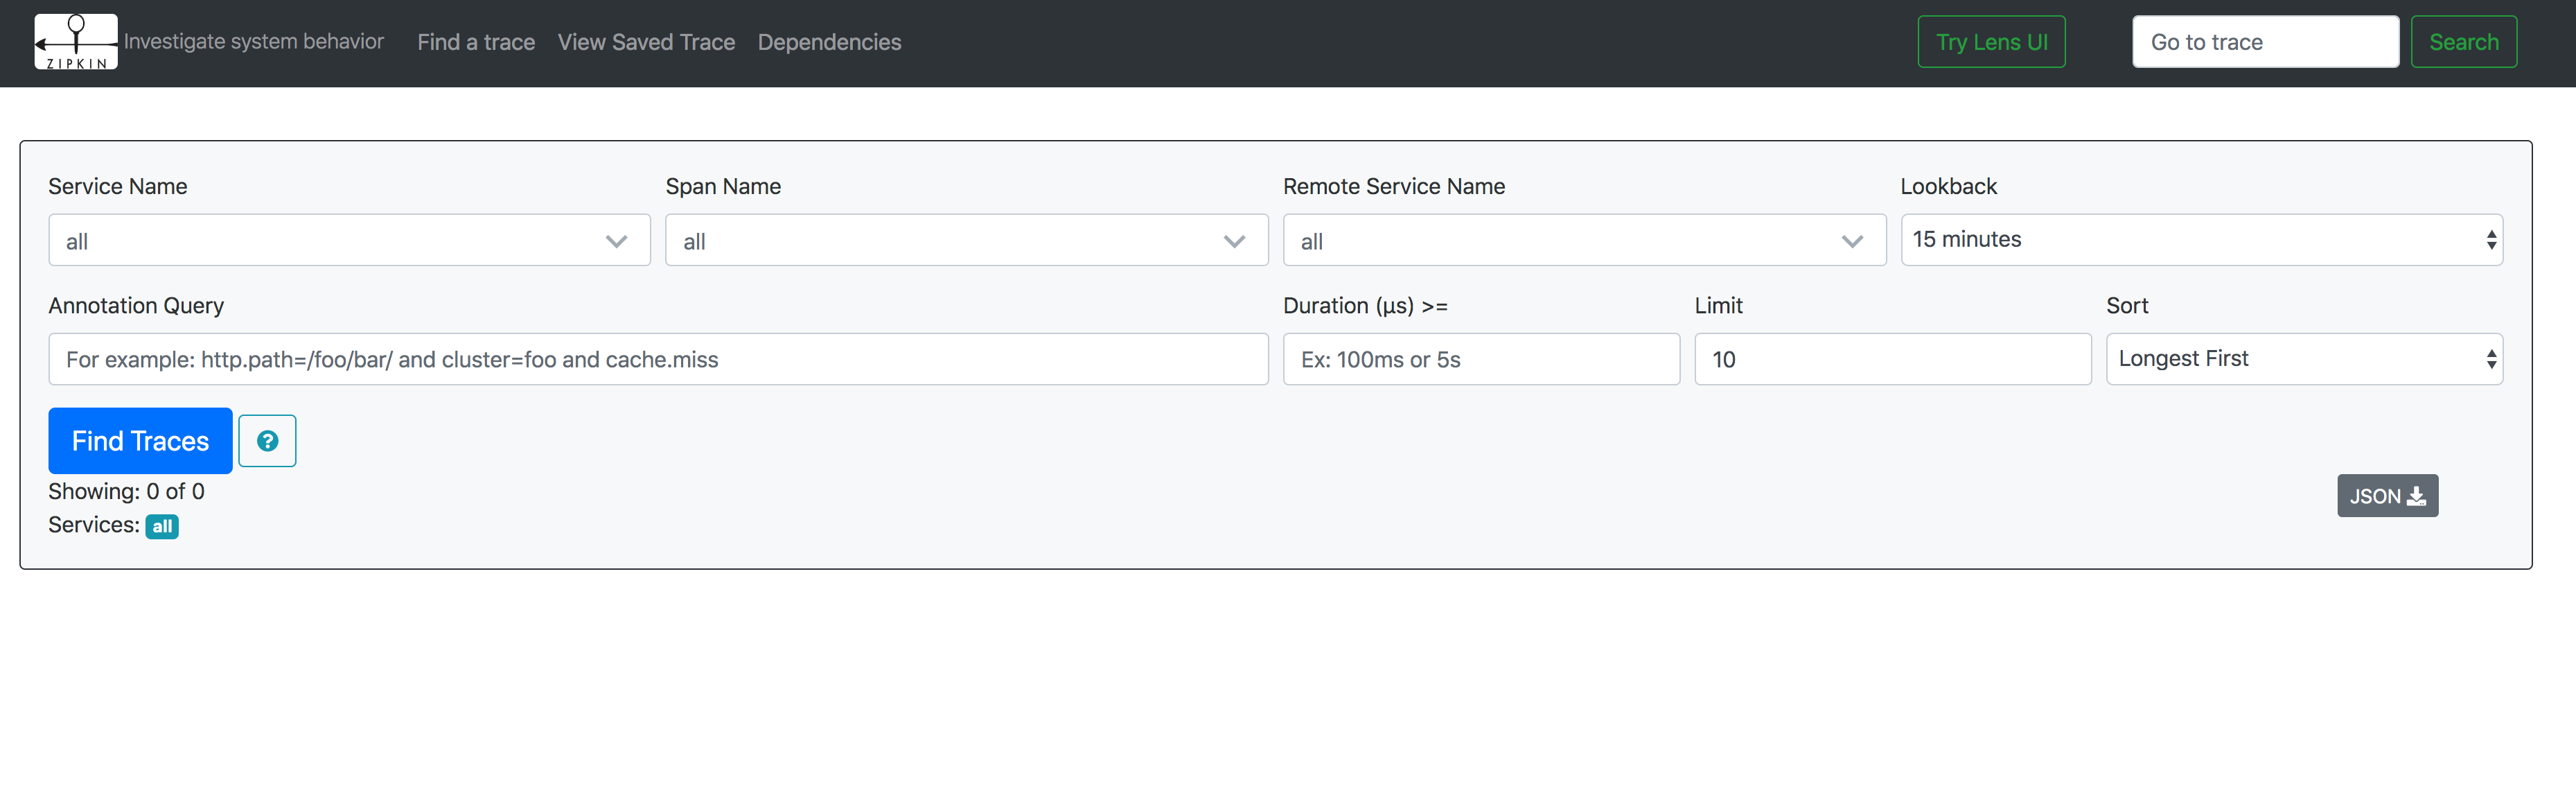
Viewing Traces
New Relic Distributed Tracing overview
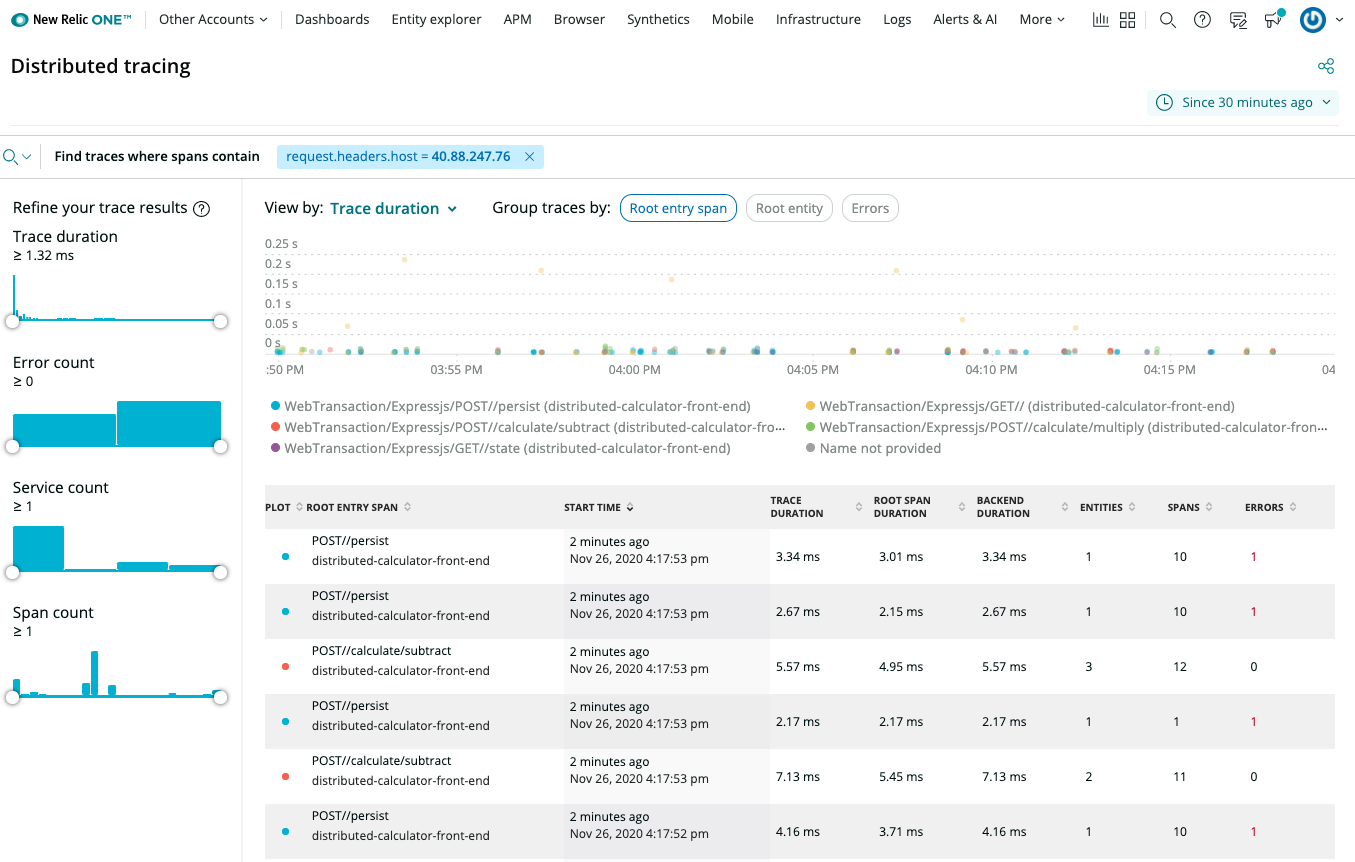
New Relic Distributed Tracing details
(optional) New Relic Instrumentation
In order for the integrations to send data to New Relic Telemetry Data Platform, you either need a New Relic license key or New Relic Insights Insert API key.
OpenTelemetry instrumentation
Leverage the different language specific OpenTelemetry implementations, for example New Relic Telemetry SDK and OpenTelemetry support for .NET. In this case, use the OpenTelemetry Trace Exporter. See example here.
New Relic Language agent
Similarly to the OpenTelemetry instrumentation, you can also leverage a New Relic language agent. As an example, the New Relic agent instrumentation for .NET Core is part of the Dockerfile. See example here.
(optional) Enable New Relic Kubernetes integration
In case Dapr and your applications run in the context of a Kubernetes environment, you can enable additional metrics and logs.
The easiest way to install the New Relic Kubernetes integration is to use the automated installer to generate a manifest. It bundles not just the integration DaemonSets, but also other New Relic Kubernetes configurations, like Kubernetes events, Prometheus OpenMetrics, and New Relic log monitoring.
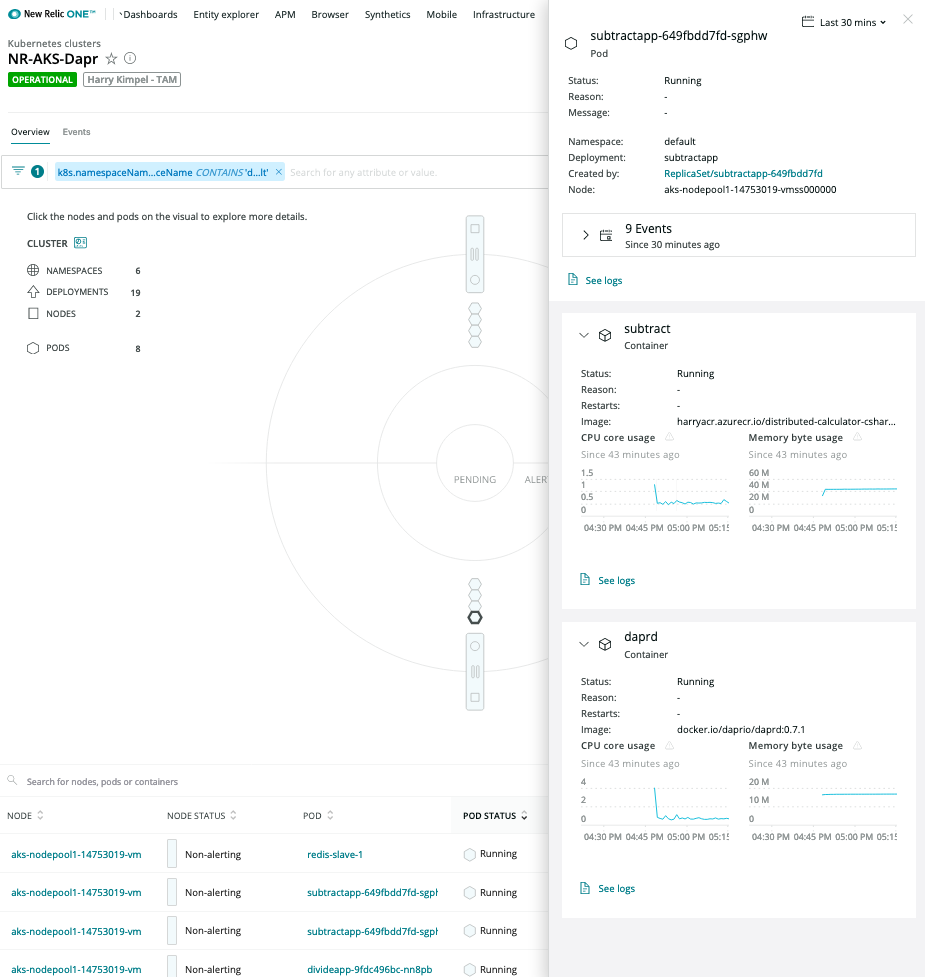
New Relic Kubernetes Cluster Explorer
The New Relic Kubernetes Cluster Explorer provides a unique visualization of the entire data and deployments of the data collected by the Kubernetes integration.
It is a good starting point to observe all your data and dig deeper into any performance issues or incidents happening inside of the application or microservices.
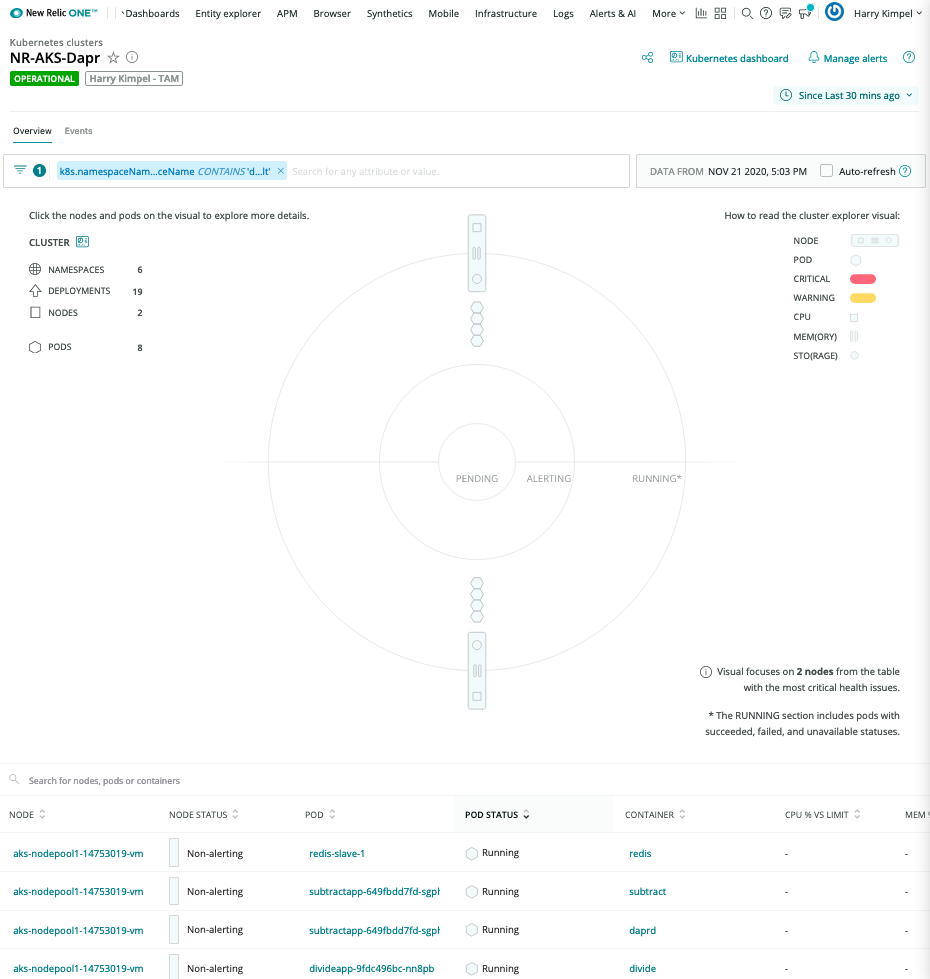
Automated correlation is part of the visualization capabilities of New Relic.
Pod-level details
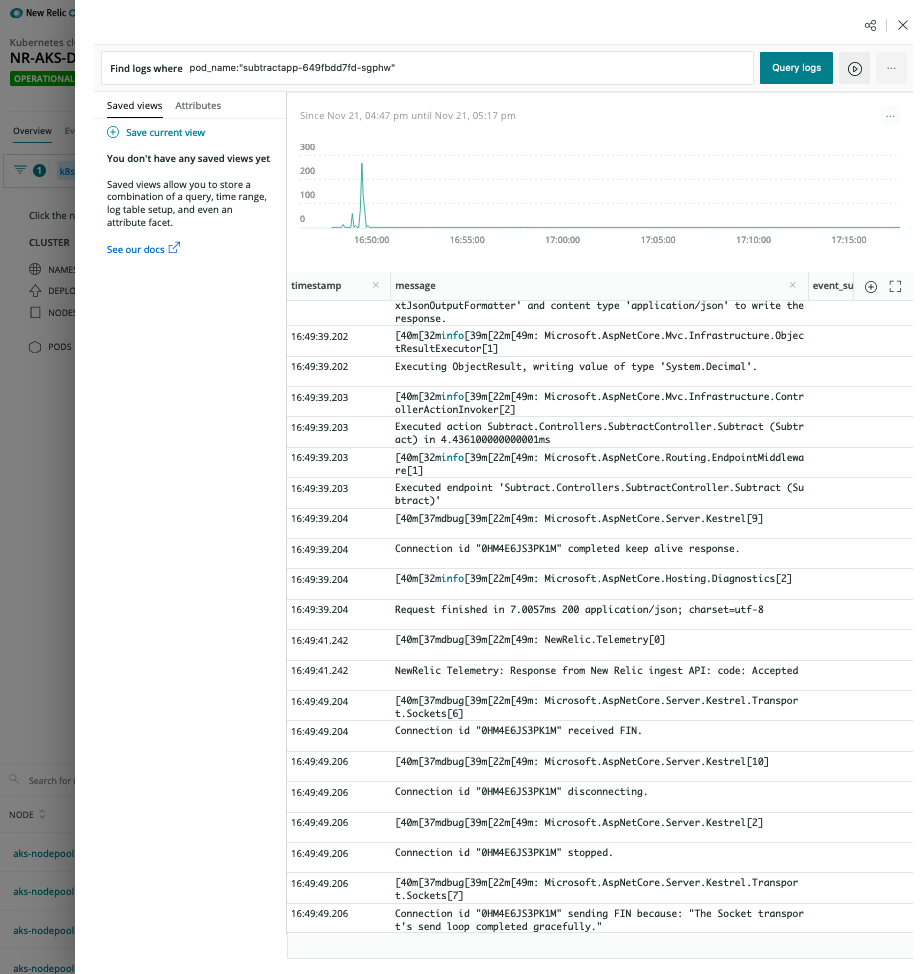
Logs in Context
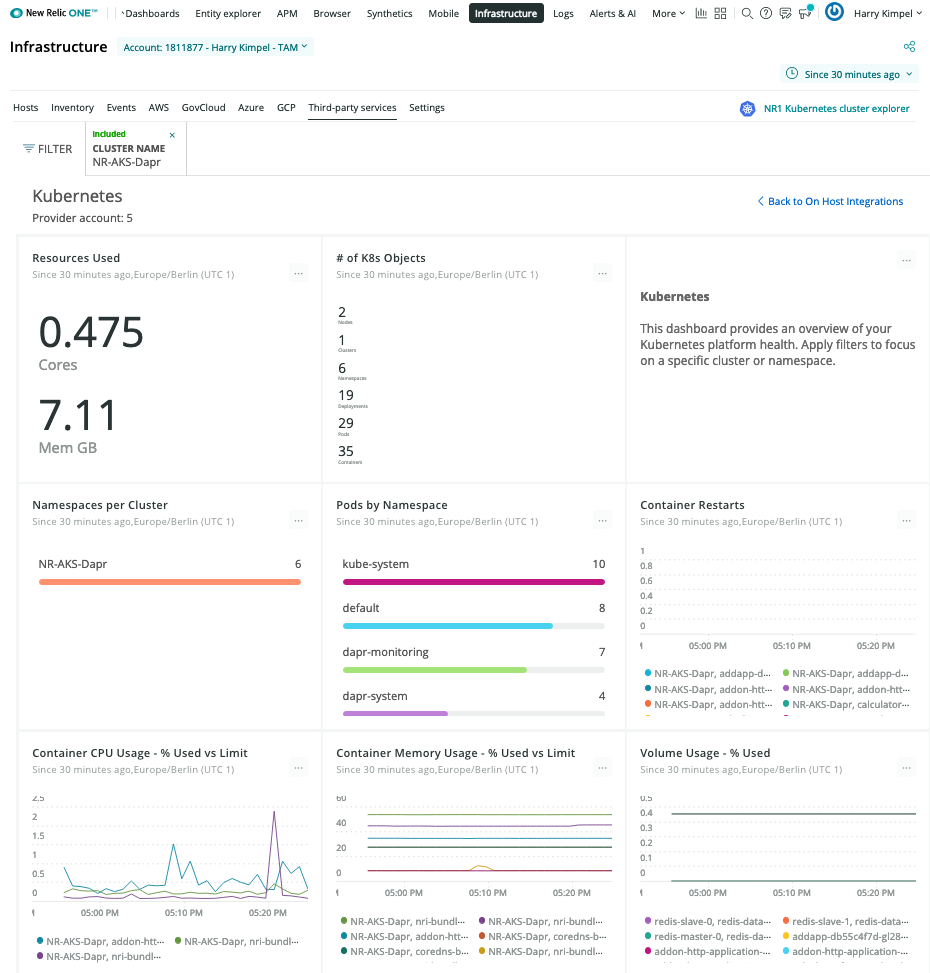
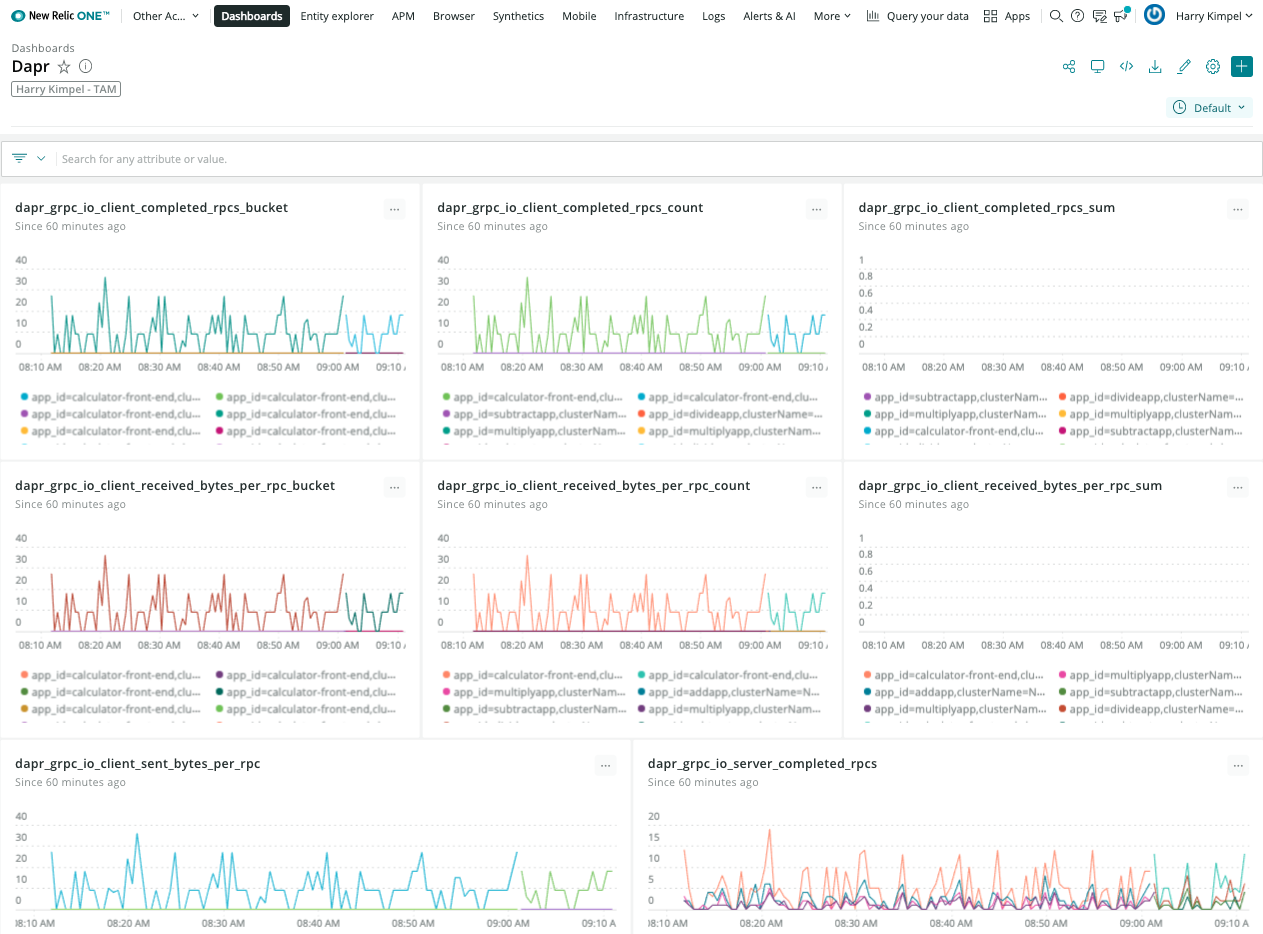
New Relic Dashboards
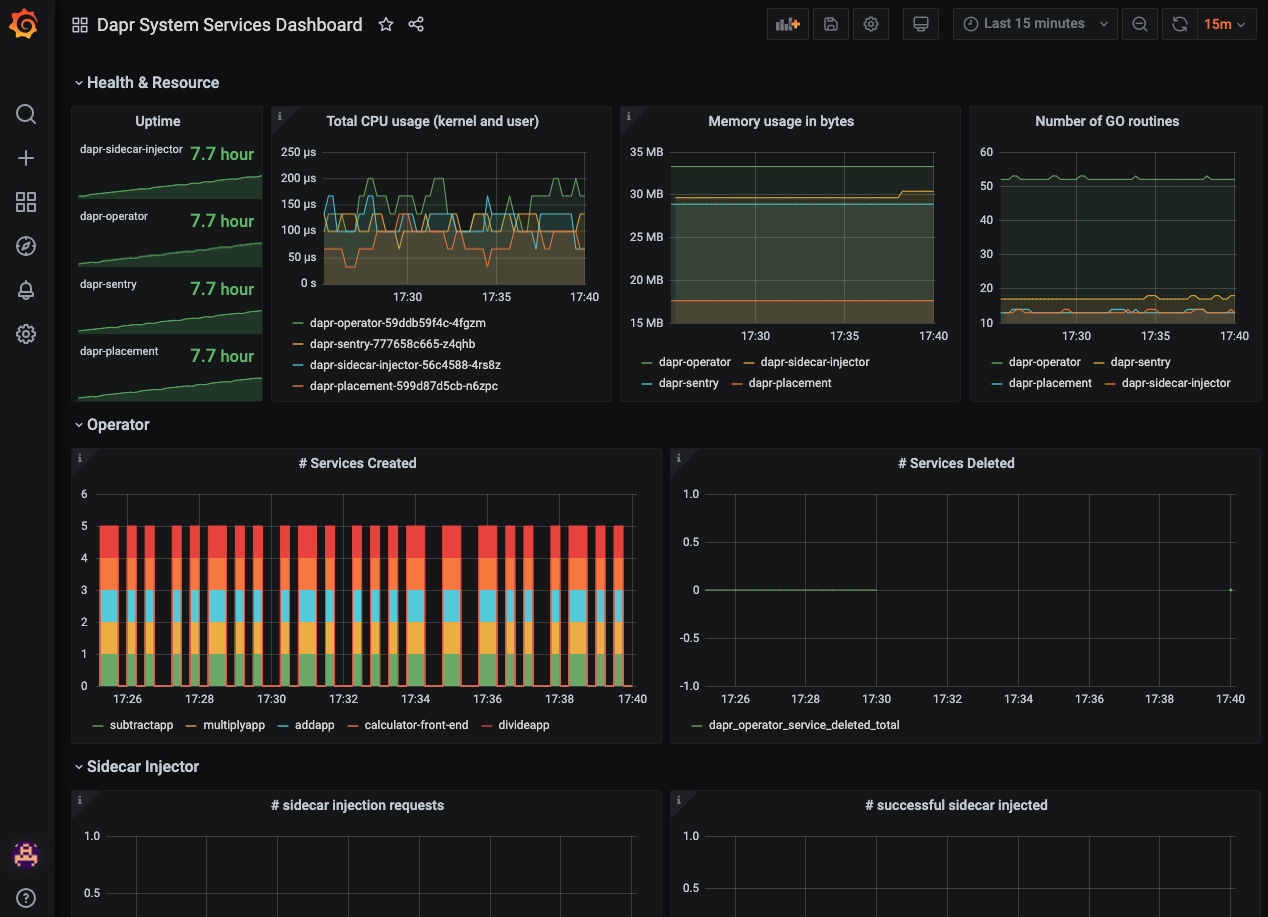
Kubernetes Overview
Dapr System Services
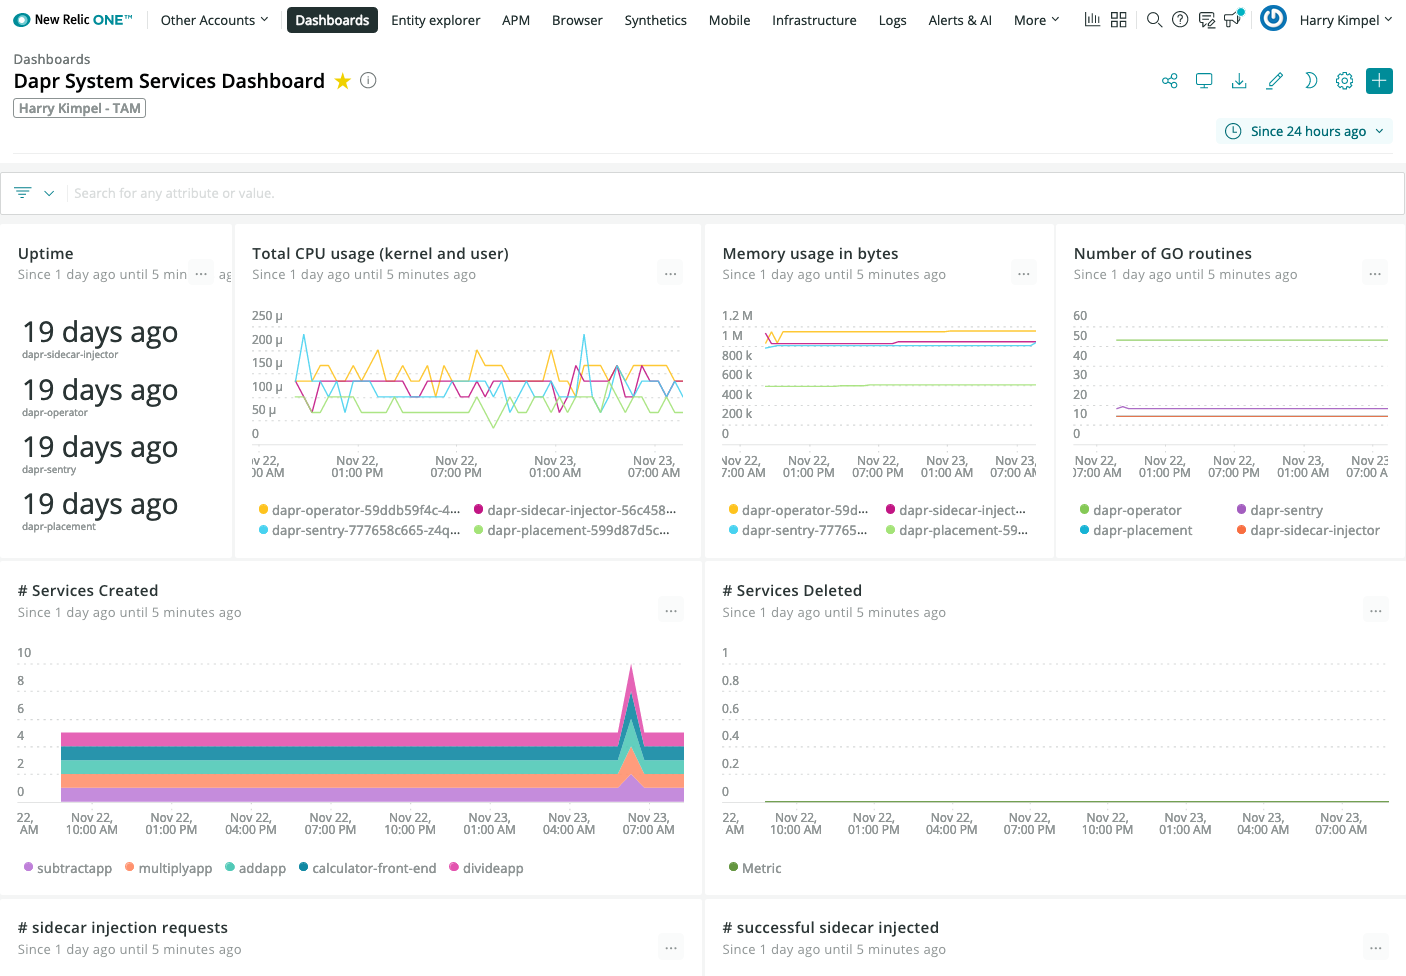
Dapr Metrics
New Relic Grafana integration
New Relic teamed up with Grafana Labs so you can use the Telemetry Data Platform as a data source for Prometheus metrics and see them in your existing dashboards, seamlessly tapping into the reliability, scale, and security provided by New Relic.
Grafana dashboard templates to monitor Dapr system services and sidecars can easily be used without any changes. New Relic provides a native endpoint for Prometheus metrics into Grafana. A datasource can easily be set-up:
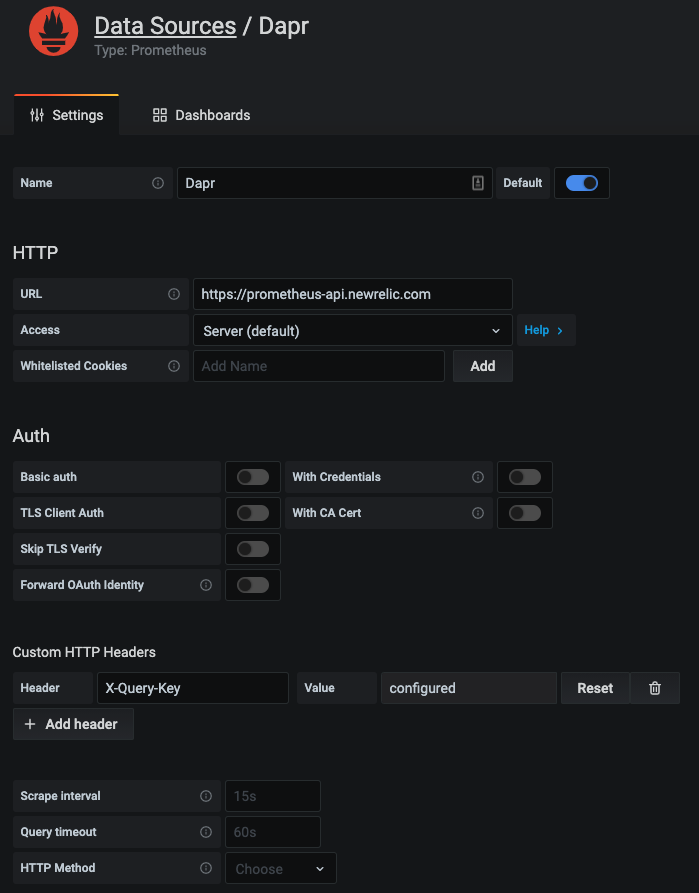
And the exact same dashboard templates from Dapr can be imported to visualize Dapr system services and sidecars.
New Relic Alerts
All the data that is collected from Dapr, Kubernetes or any services that run on top of can be used to set-up alerts and notifications into the preferred channel of your choice. See Alerts and Applied Intelligence.
Related Links/References
1.1.6 - How-To: Set up Zipkin for distributed tracing
Configure self hosted mode
For self hosted mode, on running dapr init:
- The following YAML file is created by default in
$HOME/.dapr/config.yaml(on Linux/Mac) or%USERPROFILE%\.dapr\config.yaml(on Windows) and it is referenced by default ondapr runcalls unless otherwise overridden `:
- config.yaml
apiVersion: dapr.io/v1alpha1
kind: Configuration
metadata:
  name: daprConfig
  namespace: default
spec:
  tracing:
    samplingRate: "1"
    zipkin:
      endpointAddress: "http://localhost:9411/api/v2/spans"
- The openzipkin/zipkin docker container is launched on running
dapr initor it can be launched with the following code.
Launch Zipkin using Docker:
docker run -d -p 9411:9411 openzipkin/zipkin
- The applications launched with
dapr runby default reference the config file in$HOME/.dapr/config.yamlor%USERPROFILE%\.dapr\config.yamland can be overridden with the Dapr CLI using the--configparam:
dapr run --app-id mynode --app-port 3000 node app.js
Viewing Traces
To view traces, in your browser go to http://localhost:9411 and you will see the Zipkin UI.
Configure Kubernetes
The following steps shows you how to configure Dapr to send distributed tracing data to Zipkin running as a container in your Kubernetes cluster, and how to view them.
Setup
First, deploy Zipkin:
kubectl create deployment zipkin --image openzipkin/zipkin
Create a Kubernetes service for the Zipkin pod:
kubectl expose deployment zipkin --type ClusterIP --port 9411
Next, create the following YAML file locally:
- tracing.yaml configuration
apiVersion: dapr.io/v1alpha1
kind: Configuration
metadata:
  name: tracing
  namespace: default
spec:
  tracing:
    samplingRate: "1"
    zipkin:
      endpointAddress: "http://zipkin.default.svc.cluster.local:9411/api/v2/spans"
Now, deploy the the Dapr configuration file:
kubectl apply -f tracing.yaml
In order to enable this configuration for your Dapr sidecar, add the following annotation to your pod spec template:
annotations:
  dapr.io/config: "tracing"
That’s it! Your sidecar is now configured to send traces to Zipkin.
Viewing Tracing Data
To view traces, connect to the Zipkin service and open the UI:
kubectl port-forward svc/zipkin 9411:9411
In your browser, go to http://localhost:9411 and you will see the Zipkin UI.
References
1.1.7 - How-To: Set up Datadog for distributed tracing
Dapr captures metrics and traces that can be sent directly to Datadog through the OpenTelemetry Collector Datadog exporter.
Configure Dapr tracing with the OpenTelemetry Collector and Datadog
Using the OpenTelemetry Collector Datadog exporter, you can configure Dapr to create traces for each application in your Kubernetes cluster and collect them in Datadog.
Before you begin, set up the OpenTelemetry Collector.
Add your Datadog API key to the
./deploy/opentelemetry-collector-generic-datadog.yamlfile in thedatadogexporter configuration section:data: otel-collector-config: ... exporters: ... datadog: api: key: <YOUR_API_KEY>Apply the
opentelemetry-collectorconfiguration by running the following command.kubectl apply -f ./deploy/open-telemetry-collector-generic-datadog.yamlSet up a Dapr configuration file that will turn on tracing and deploy a tracing exporter component that uses the OpenTelemetry Collector.
kubectl apply -f ./deploy/collector-config.yamlApply the
appconfigconfiguration by adding adapr.io/configannotation to the container that you want to participate in the distributed tracing.annotations: dapr.io/config: "appconfig"Create and configure the application. Once running, telemetry data is sent to Datadog and visible in Datadog APM.
Related Links/References
1.2 - Metrics
1.2.1 - Configure metrics
By default, each Dapr system process emits Go runtime/process metrics and has their own Dapr metrics.
Prometheus endpoint
The Dapr sidecar exposes a Prometheus-compatible metrics endpoint that you can scrape to gain a greater understanding of how Dapr is behaving.
Configuring metrics using the CLI
The metrics application endpoint is enabled by default. You can disable it by passing the command line argument --enable-metrics=false.
The default metrics port is 9090. You can override this by passing the command line argument --metrics-port to daprd.
Configuring metrics in Kubernetes
You can also enable/disable the metrics for a specific application by setting the dapr.io/enable-metrics: "false" annotation on your application deployment. With the metrics exporter disabled, daprd does not open the metrics listening port.
The following Kubernetes deployment example shows how metrics are explicitly enabled with the port specified as “9090”.
apiVersion: apps/v1
kind: Deployment
metadata:
  name: nodeapp
  labels:
    app: node
spec:
  replicas: 1
  selector:
    matchLabels:
      app: node
  template:
    metadata:
      labels:
        app: node
      annotations:
        dapr.io/enabled: "true"
        dapr.io/app-id: "nodeapp"
        dapr.io/app-port: "3000"
        dapr.io/enable-metrics: "true"
        dapr.io/metrics-port: "9090"
    spec:
      containers:
      - name: node
        image: dapriosamples/hello-k8s-node:latest
        ports:
        - containerPort: 3000
        imagePullPolicy: Always
Configuring metrics using application configuration
You can also enable metrics via application configuration. To disable the metrics collection in the Dapr sidecars by default, set spec.metrics.enabled to false.
apiVersion: dapr.io/v1alpha1
kind: Configuration
metadata:
  name: tracing
  namespace: default
spec:
  metrics:
    enabled: false
Configuring metrics for error codes
You can enable additional metrics for Dapr API error codes by setting spec.metrics.recordErrorCodes to true. Dapr APIs which communicate back to their caller may return standardized error codes. A new metric called error_code_total is recorded, which allows monitoring of error codes triggered by application, code, and category. See the errorcodes package for specific codes and categories.
Example configuration:
apiVersion: dapr.io/v1alpha1
kind: Configuration
metadata:
  name: tracing
  namespace: default
spec:
  metrics:
    enabled: true
    recordErrorCodes: true
Example metric:
{
  "app_id": "publisher-app",
  "category": "state",
  "dapr_io_enabled": "true",
  "error_code": "ERR_STATE_STORE_NOT_CONFIGURED",
  "instance": "10.244.1.64:9090",
  "job": "kubernetes-service-endpoints",
  "namespace": "my-app",
  "node": "my-node",
  "service": "publisher-app-dapr"
}
Optimizing HTTP metrics reporting with path matching
When invoking Dapr using HTTP, metrics are created for each requested method by default. This can result in a high number of metrics, known as high cardinality, which can impact memory usage and CPU.
Path matching allows you to manage and control the cardinality of HTTP metrics in Dapr. This is an aggregation of metrics, so rather than having a metric for each event, you can reduce the number of metrics events and report an overall number. Learn more about how to set the cardinality in configuration.
This configuration is opt-in and is enabled via the Dapr configuration spec.metrics.http.pathMatching. When defined, it enables path matching, which standardizes specified paths for both metrics paths. This reduces the number of unique metrics paths, making metrics more manageable and reducing resource consumption in a controlled way.
When spec.metrics.http.pathMatching is combined with the increasedCardinality flag set to false, non-matched paths are transformed into a catch-all bucket to control and limit cardinality, preventing unbounded path growth. Conversely, when increasedCardinality is true (the default), non-matched paths are passed through as they normally would be, allowing for potentially higher cardinality but preserving the original path data.
Examples of Path Matching in HTTP Metrics
The following examples demonstrate how to use the Path Matching API in Dapr for managing HTTP metrics. On each example, the metrics are collected from 5 HTTP requests to the /orders endpoint with different order IDs. By adjusting cardinality and utilizing path matching, you can fine-tune metric granularity to balance detail and resource efficiency.
These examples illustrate the cardinality of the metrics, highlighting that high cardinality configurations result in many entries, which correspond to higher memory usage for handling metrics. For simplicity, the following example focuses on a single metric: dapr_http_server_request_count.
Low cardinality with path matching (Recommendation)
Configuration:
http:
  increasedCardinality: false
  pathMatching:
    - /orders/{orderID}
Metrics generated:
# matched paths
dapr_http_server_request_count{app_id="order-service",method="GET",path="/orders/{orderID}",status="200"} 5
# unmatched paths
dapr_http_server_request_count{app_id="order-service",method="GET",path="",status="200"} 1
With low cardinality and path matching configured, you get the best of both worlds by grouping the metrics for the important endpoints without compromising the cardinality. This approach helps avoid high memory usage and potential security issues.
Low cardinality without path matching
Configuration:
http:
  increasedCardinality: false
Metrics generated:
dapr_http_server_request_count{app_id="order-service",method="GET", path="",status="200"} 5
In low cardinality mode, the path, which is the main source of unbounded cardinality, is dropped. This results in metrics that primarily indicate the number of requests made to the service for a given HTTP method, but without any information about the paths invoked.
High cardinality with path matching
Configuration:
http:
  increasedCardinality: true
  pathMatching:
    - /orders/{orderID}
Metrics generated:
dapr_http_server_request_count{app_id="order-service",method="GET",path="/orders/{orderID}",status="200"} 5
This example results from the same HTTP requests as the example above, but with path matching configured for the path /orders/{orderID}. By using path matching, you achieve reduced cardinality by grouping the metrics based on the matched path.
High Cardinality without path matching
Configuration:
http:
  increasedCardinality: true
Metrics generated:
dapr_http_server_request_count{app_id="order-service",method="GET",path="/orders/1",status="200"} 1
dapr_http_server_request_count{app_id="order-service",method="GET",path="/orders/2",status="200"} 1
dapr_http_server_request_count{app_id="order-service",method="GET",path="/orders/3",status="200"} 1
dapr_http_server_request_count{app_id="order-service",method="GET",path="/orders/4",status="200"} 1
dapr_http_server_request_count{app_id="order-service",method="GET",path="/orders/5",status="200"} 1
For each request, a new metric is created with the request path. This process continues for every request made to a new order ID, resulting in unbounded cardinality since the IDs are ever-growing.
HTTP metrics exclude verbs
The excludeVerbs option allows you to exclude specific HTTP verbs from being reported in the metrics. This can be useful in high-performance applications where memory savings are critical.
Examples of excluding HTTP verbs in metrics
The following examples demonstrate how to exclude HTTP verbs in Dapr for managing HTTP metrics.
Default - Include HTTP verbs
Configuration:
http:
  excludeVerbs: false
Metrics generated:
dapr_http_server_request_count{app_id="order-service",method="GET",path="/orders",status="200"} 1
dapr_http_server_request_count{app_id="order-service",method="POST",path="/orders",status="200"} 1
In this example, the HTTP method is included in the metrics, resulting in a separate metric for each request to the /orders endpoint.
Exclude HTTP verbs
Configuration:
http:
  excludeVerbs: true
Metrics generated:
dapr_http_server_request_count{app_id="order-service",method="",path="/orders",status="200"} 2
In this example, the HTTP method is excluded from the metrics, resulting in a single metric for all requests to the /orders endpoint.
Configuring custom latency histogram buckets
Dapr uses cumulative histogram metrics to group latency values into buckets, where each bucket contains:
- A count of the number of requests with that latency
- All the requests with lower latency
Using the default latency bucket configurations
By default, Dapr groups request latency metrics into the following buckets:
1, 2, 3, 4, 5, 6, 8, 10, 13, 16, 20, 25, 30, 40, 50, 65, 80, 100, 130, 160, 200, 250, 300, 400, 500, 650, 800, 1000, 2000, 5000, 10000, 20000, 50000, 100000
Grouping latency values in a cumulative fashion allows buckets to be used or dropped as needed for increased or decreased granularity of data. For example, if a request takes 3ms, it’s counted in the 3ms bucket, the 4ms bucket, the 5ms bucket, and so on. Similarly, if a request takes 10ms, it’s counted in the 10ms bucket, the 13ms bucket, the 16ms bucket, and so on. After these two requests have completed, the 3ms bucket has a count of 1 and the 10ms bucket has a count of 2, since both the 3ms and 10ms requests are included here.
This shows up as follows:
| 1 | 2 | 3 | 4 | 5 | 6 | 8 | 10 | 13 | 16 | 20 | 25 | 30 | 40 | 50 | 65 | 80 | 100 | 130 | 160 | ….. | 100000 |
|---|---|---|---|---|---|---|---|---|---|---|---|---|---|---|---|---|---|---|---|---|---|
| 0 | 0 | 1 | 1 | 1 | 1 | 1 | 2 | 2 | 2 | 2 | 2 | 2 | 2 | 2 | 2 | 2 | 2 | 2 | 2 | ….. | 2 |
The default number of buckets works well for most use cases, but can be adjusted as needed. Each request creates 34 different metrics, leaving this value to grow considerably for a large number of applications. More accurate latency percentiles can be achieved by increasing the number of buckets. However, a higher number of buckets increases the amount of memory used to store the metrics, potentially negatively impacting your monitoring system.
It is recommended to keep the number of latency buckets set to the default value, unless you are seeing unwanted memory pressure in your monitoring system. Configuring the number of buckets allows you to choose applications where:
- You want to see more detail with a higher number of buckets
- Broader values are sufficient by reducing the buckets
Take note of the default latency values your applications are producing before configuring the number buckets.
Customizing latency buckets to your scenario
Tailor the latency buckets to your needs, by modifying the spec.metrics.latencyDistributionBuckets field in the Dapr configuration spec for your application(s).
For example, if you aren’t interested in extremely low latency values (1-10ms), you can group them in a single 10ms bucket. Similarly, you can group the high values in a single bucket (1000-5000ms), while keeping more detail in the middle range of values that you are most interested in.
The following Configuration spec example replaces the default 34 buckets with 11 buckets, giving a higher level of granularity in the middle range of values:
apiVersion: dapr.io/v1alpha1
kind: Configuration
metadata:
  name: custom-metrics
spec:
    metrics:
        enabled: true
        latencyDistributionBuckets: [10, 25, 40, 50, 70, 100, 150, 200, 500, 1000, 5000]
Transform metrics with regular expressions
You can set regular expressions for every metric exposed by the Dapr sidecar to “transform” their values. See a list of all Dapr metrics.
The name of the rule must match the name of the metric that is transformed. The following example shows how to apply a regular expression for the label method in the metric dapr_runtime_service_invocation_req_sent_total:
apiVersion: dapr.io/v1alpha1
kind: Configuration
metadata:
  name: daprConfig
spec:
  metrics:
    enabled: true
    http:
      increasedCardinality: true
    rules:
      - name: dapr_runtime_service_invocation_req_sent_total
        labels:
        - name: method
          regex:
            "orders/": "orders/.+"
When this configuration is applied, a recorded metric with the method label of orders/a746dhsk293972nz is replaced with orders/.
Using regular expressions to reduce metrics cardinality is considered legacy. We encourage all users to set spec.metrics.http.increasedCardinality to false instead, which is simpler to configure and offers better performance.
References
1.2.2 - How-To: Observe metrics with Prometheus
Setup Prometheus Locally
To run Prometheus on your local machine, you can either install and run it as a process or run it as a Docker container.
Install
Note
You don’t need to install Prometheus if you plan to run it as a Docker container. Please refer to the Container instructions.To install Prometheus, follow the steps outlined here for your OS.
Configure
Now you’ve installed Prometheus, you need to create a configuration.
Below is an example Prometheus configuration, save this to a file i.e. /tmp/prometheus.yml or C:\Temp\prometheus.yml
global:
  scrape_interval:     15s # By default, scrape targets every 15 seconds.

# A scrape configuration containing exactly one endpoint to scrape:
# Here it's Prometheus itself.
scrape_configs:
  - job_name: 'dapr'

    # Override the global default and scrape targets from this job every 5 seconds.
    scrape_interval: 5s

    static_configs:
      - targets: ['localhost:9090'] # Replace with Dapr metrics port if not default
Run as Process
Run Prometheus with your configuration to start it collecting metrics from the specified targets.
./prometheus --config.file=/tmp/prometheus.yml --web.listen-address=:8080
We change the port so it doesn’t conflict with Dapr’s own metrics endpoint.
If you are not currently running a Dapr application, the target will show as offline. In order to start collecting metrics you must start Dapr with the metrics port matching the one provided as the target in the configuration.
Once Prometheus is running, you’ll be able to visit its dashboard by visiting http://localhost:8080.
Run as Container
To run Prometheus as a Docker container on your local machine, first ensure you have Docker installed and running.
Then you can run Prometheus as a Docker container using:
docker run \
    --net=host \
    -v /tmp/prometheus.yml:/etc/prometheus/prometheus.yml \
    prom/prometheus --config.file=/etc/prometheus/prometheus.yml --web.listen-address=:8080
--net=host ensures that the Prometheus instance will be able to connect to any Dapr instances running on the host machine. If you plan to run your Dapr apps in containers as well, you’ll need to run them on a shared Docker network and update the configuration with the correct target address.
Once Prometheus is running, you’ll be able to visit its dashboard by visiting http://localhost:8080.
Setup Prometheus on Kubernetes
Prerequisites
Install Prometheus
- First create namespace that can be used to deploy the Grafana and Prometheus monitoring tools
kubectl create namespace dapr-monitoring
- Install Prometheus
helm repo add prometheus-community https://prometheus-community.github.io/helm-charts
helm repo update
helm install dapr-prom prometheus-community/prometheus -n dapr-monitoring
If you are Minikube user or want to disable persistent volume for development purposes, you can disable it by using the following command.
helm install dapr-prom prometheus-community/prometheus -n dapr-monitoring
 --set alertmanager.persistence.enabled=false --set pushgateway.persistentVolume.enabled=false --set server.persistentVolume.enabled=false
For automatic discovery of Dapr targets (Service Discovery), use:
helm install dapr-prom prometheus-community/prometheus -f values.yaml -n dapr-monitoring --create-namespace
values.yaml File
alertmanager:
  persistence:
    enabled: false
pushgateway:
  persistentVolume:
    enabled: false
server:
  persistentVolume:
    enabled: false

# Adds additional scrape configurations to prometheus.yml
# Uses service discovery to find Dapr and Dapr sidecar targets
extraScrapeConfigs: |-
  - job_name: dapr-sidecars
    kubernetes_sd_configs:
      - role: pod
    relabel_configs:
      - action: keep
        regex: "true"
        source_labels:
          - __meta_kubernetes_pod_annotation_dapr_io_enabled
      - action: keep
        regex: "true"
        source_labels:
          - __meta_kubernetes_pod_annotation_dapr_io_enable_metrics
      - action: replace
        replacement: ${1}
        source_labels:
          - __meta_kubernetes_namespace
        target_label: namespace
      - action: replace
        replacement: ${1}
        source_labels:
          - __meta_kubernetes_pod_name
        target_label: pod
      - action: replace
        regex: (.*);daprd
        replacement: ${1}-dapr
        source_labels:
          - __meta_kubernetes_pod_annotation_dapr_io_app_id
          - __meta_kubernetes_pod_container_name
        target_label: service
      - action: replace
        replacement: ${1}:9090
        source_labels:
          - __meta_kubernetes_pod_ip
        target_label: __address__

  - job_name: dapr
    kubernetes_sd_configs:
      - role: pod
    relabel_configs:
      - action: keep
        regex: dapr
        source_labels:
          - __meta_kubernetes_pod_label_app_kubernetes_io_name
      - action: keep
        regex: dapr
        source_labels:
          - __meta_kubernetes_pod_label_app_kubernetes_io_part_of
      - action: replace
        replacement: ${1}
        source_labels:
          - __meta_kubernetes_pod_label_app
        target_label: app
      - action: replace
        replacement: ${1}
        source_labels:
          - __meta_kubernetes_namespace
        target_label: namespace
      - action: replace
        replacement: ${1}
        source_labels:
          - __meta_kubernetes_pod_name
        target_label: pod
      - action: replace
        replacement: ${1}:9090
        source_labels:
          - __meta_kubernetes_pod_ip
        target_label: __address__
- Validation
Ensure Prometheus is running in your cluster.
kubectl get pods -n dapr-monitoring
Expected output:
NAME                                                READY   STATUS    RESTARTS   AGE
dapr-prom-kube-state-metrics-9849d6cc6-t94p8        1/1     Running   0          4m58s
dapr-prom-prometheus-alertmanager-749cc46f6-9b5t8   2/2     Running   0          4m58s
dapr-prom-prometheus-node-exporter-5jh8p            1/1     Running   0          4m58s
dapr-prom-prometheus-node-exporter-88gbg            1/1     Running   0          4m58s
dapr-prom-prometheus-node-exporter-bjp9f            1/1     Running   0          4m58s
dapr-prom-prometheus-pushgateway-688665d597-h4xx2   1/1     Running   0          4m58s
dapr-prom-prometheus-server-694fd8d7c-q5d59         2/2     Running   0          4m58s
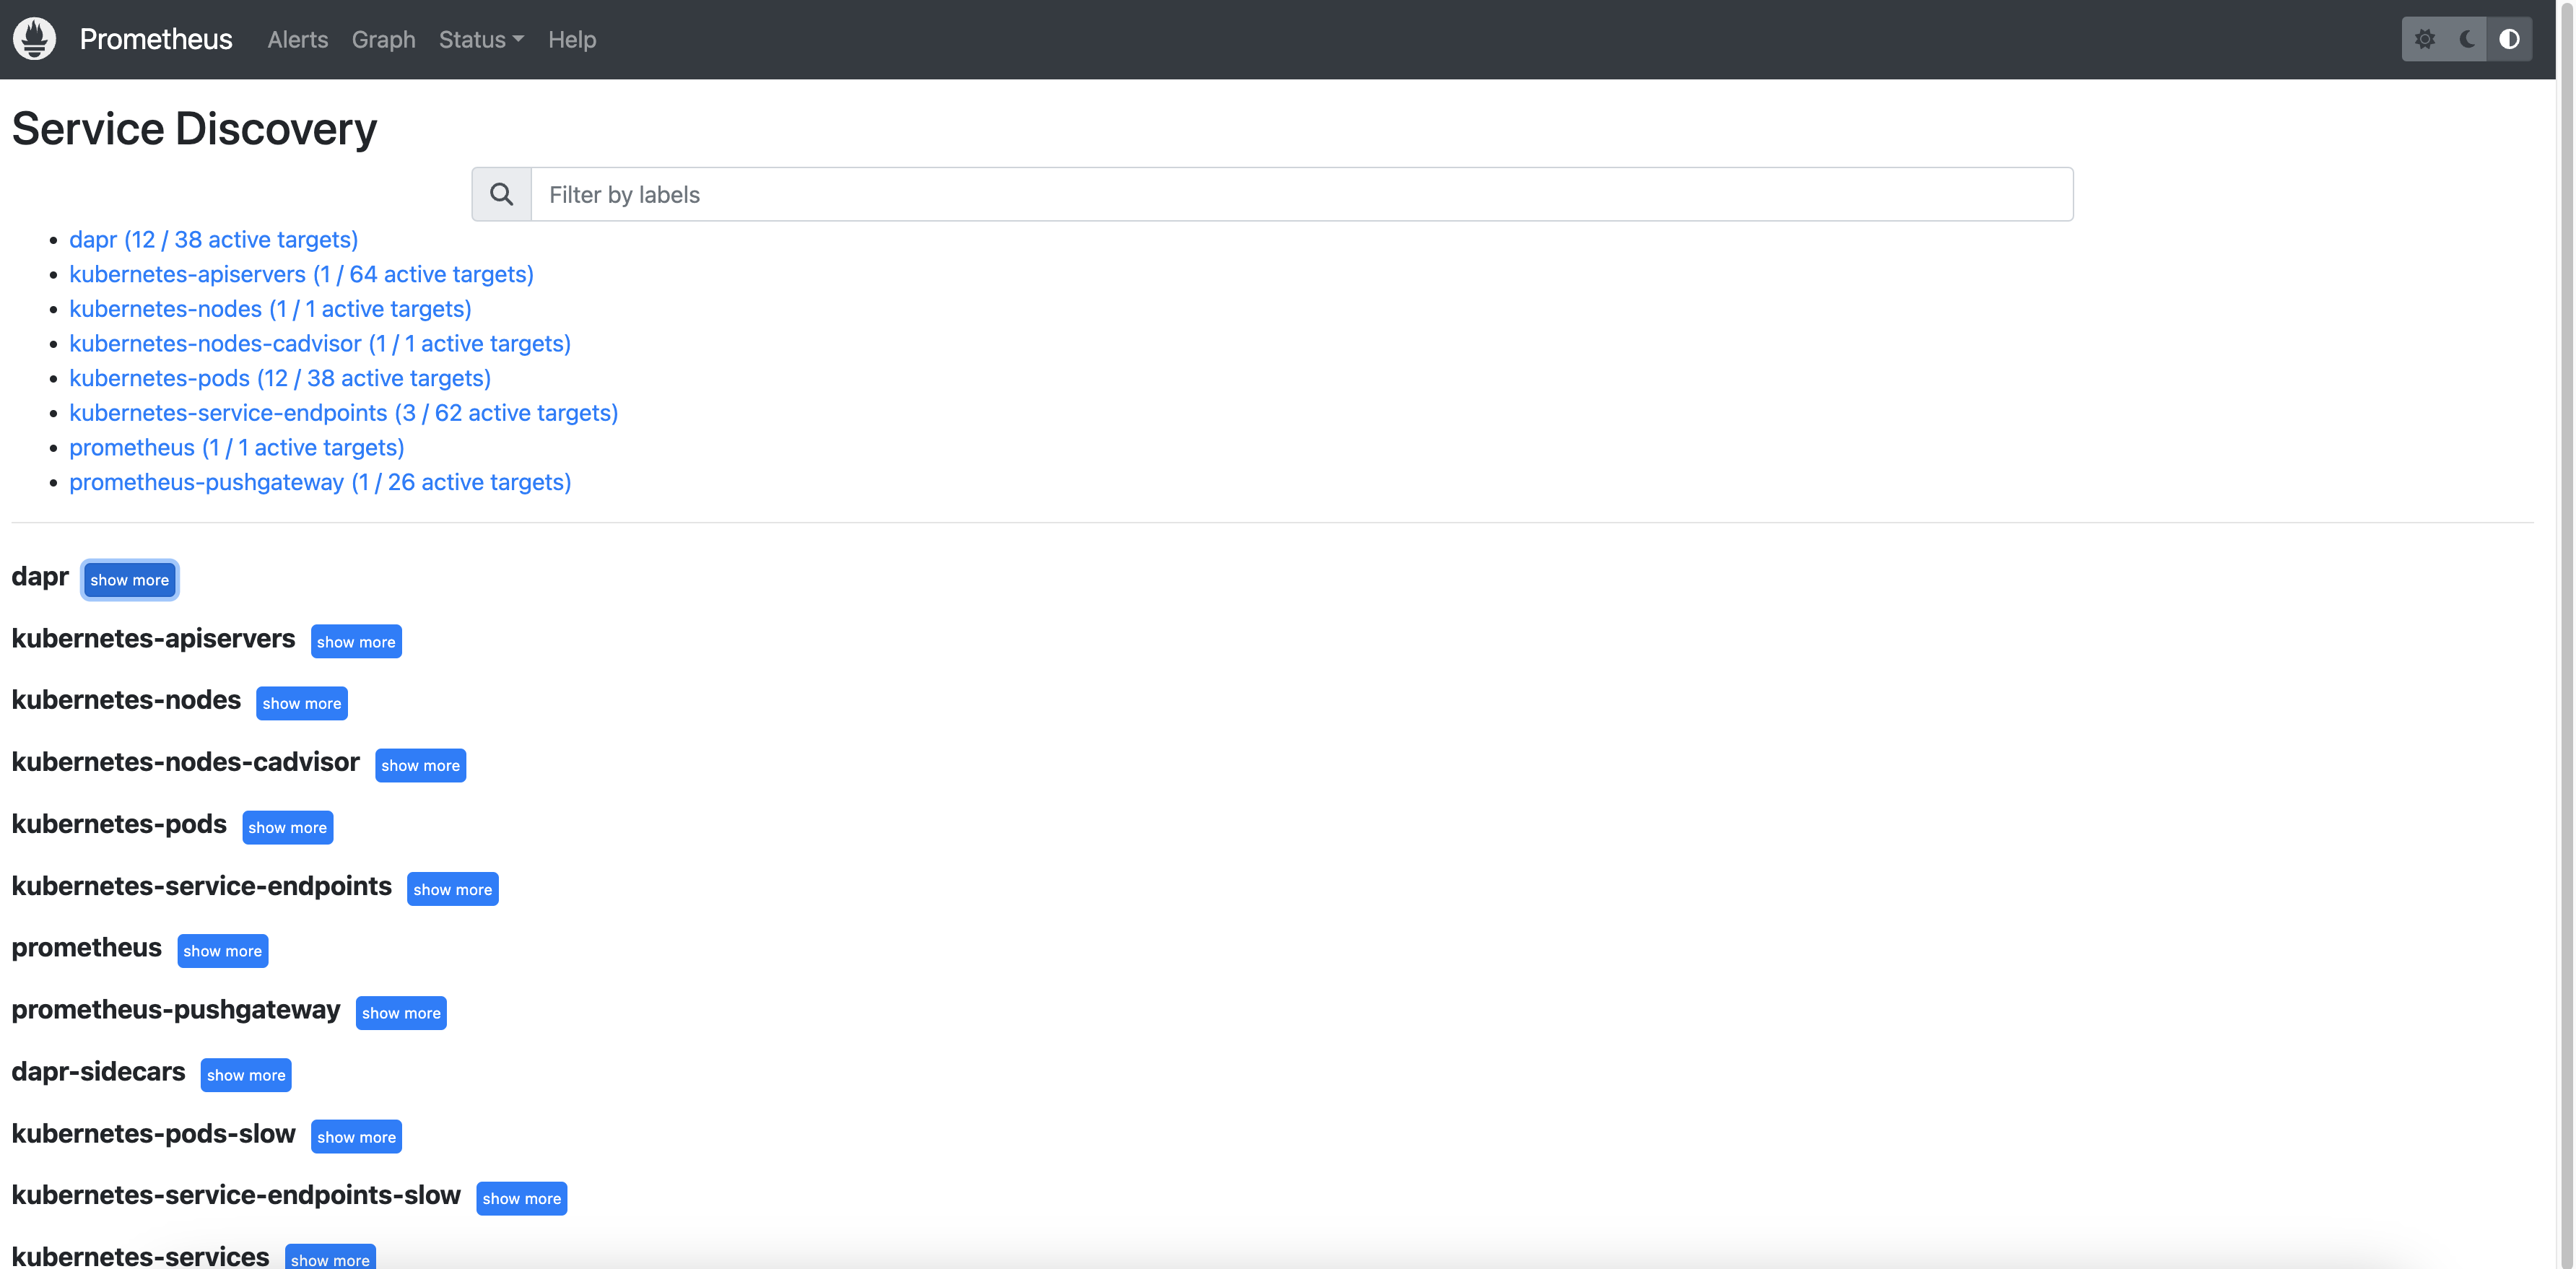
Access the Prometheus Dashboard
To view the Prometheus dashboard and check service discovery:
kubectl port-forward svc/dapr-prom-prometheus-server 9090:80 -n dapr-monitoring
Open a browser and visit http://localhost:9090. Navigate to Status > Service Discovery to verify that the Dapr targets are discovered correctly.
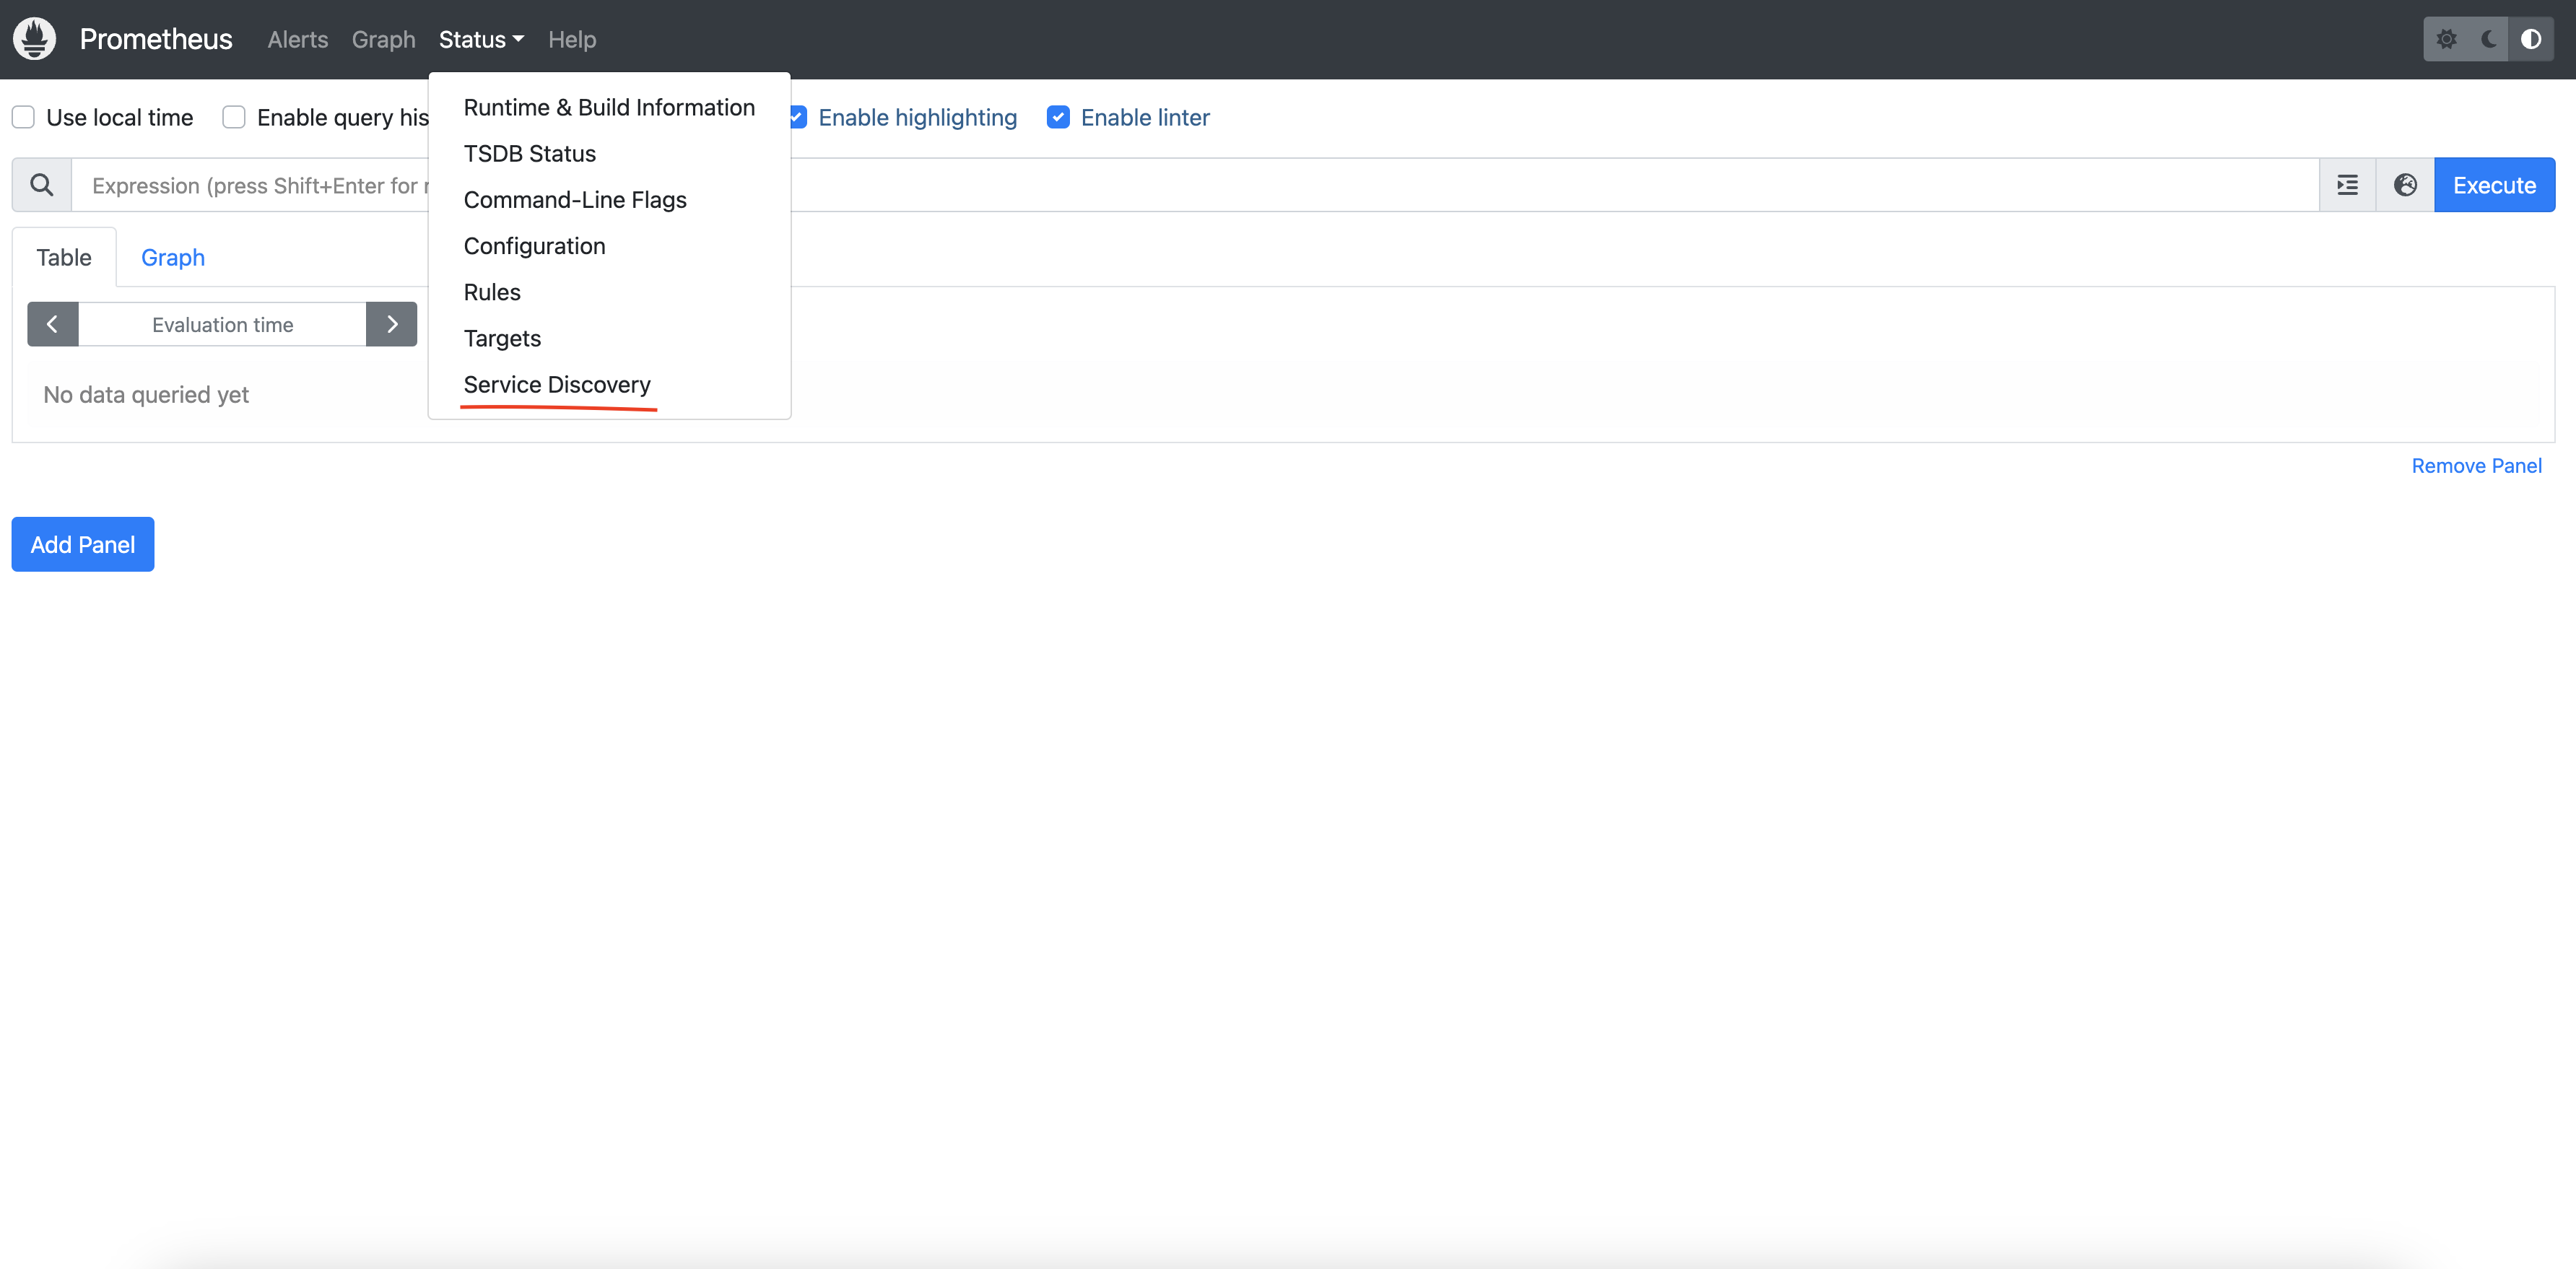
You can see the job_name and its discovered targets.
Example
References
1.2.3 - How-To: Observe metrics with Grafana
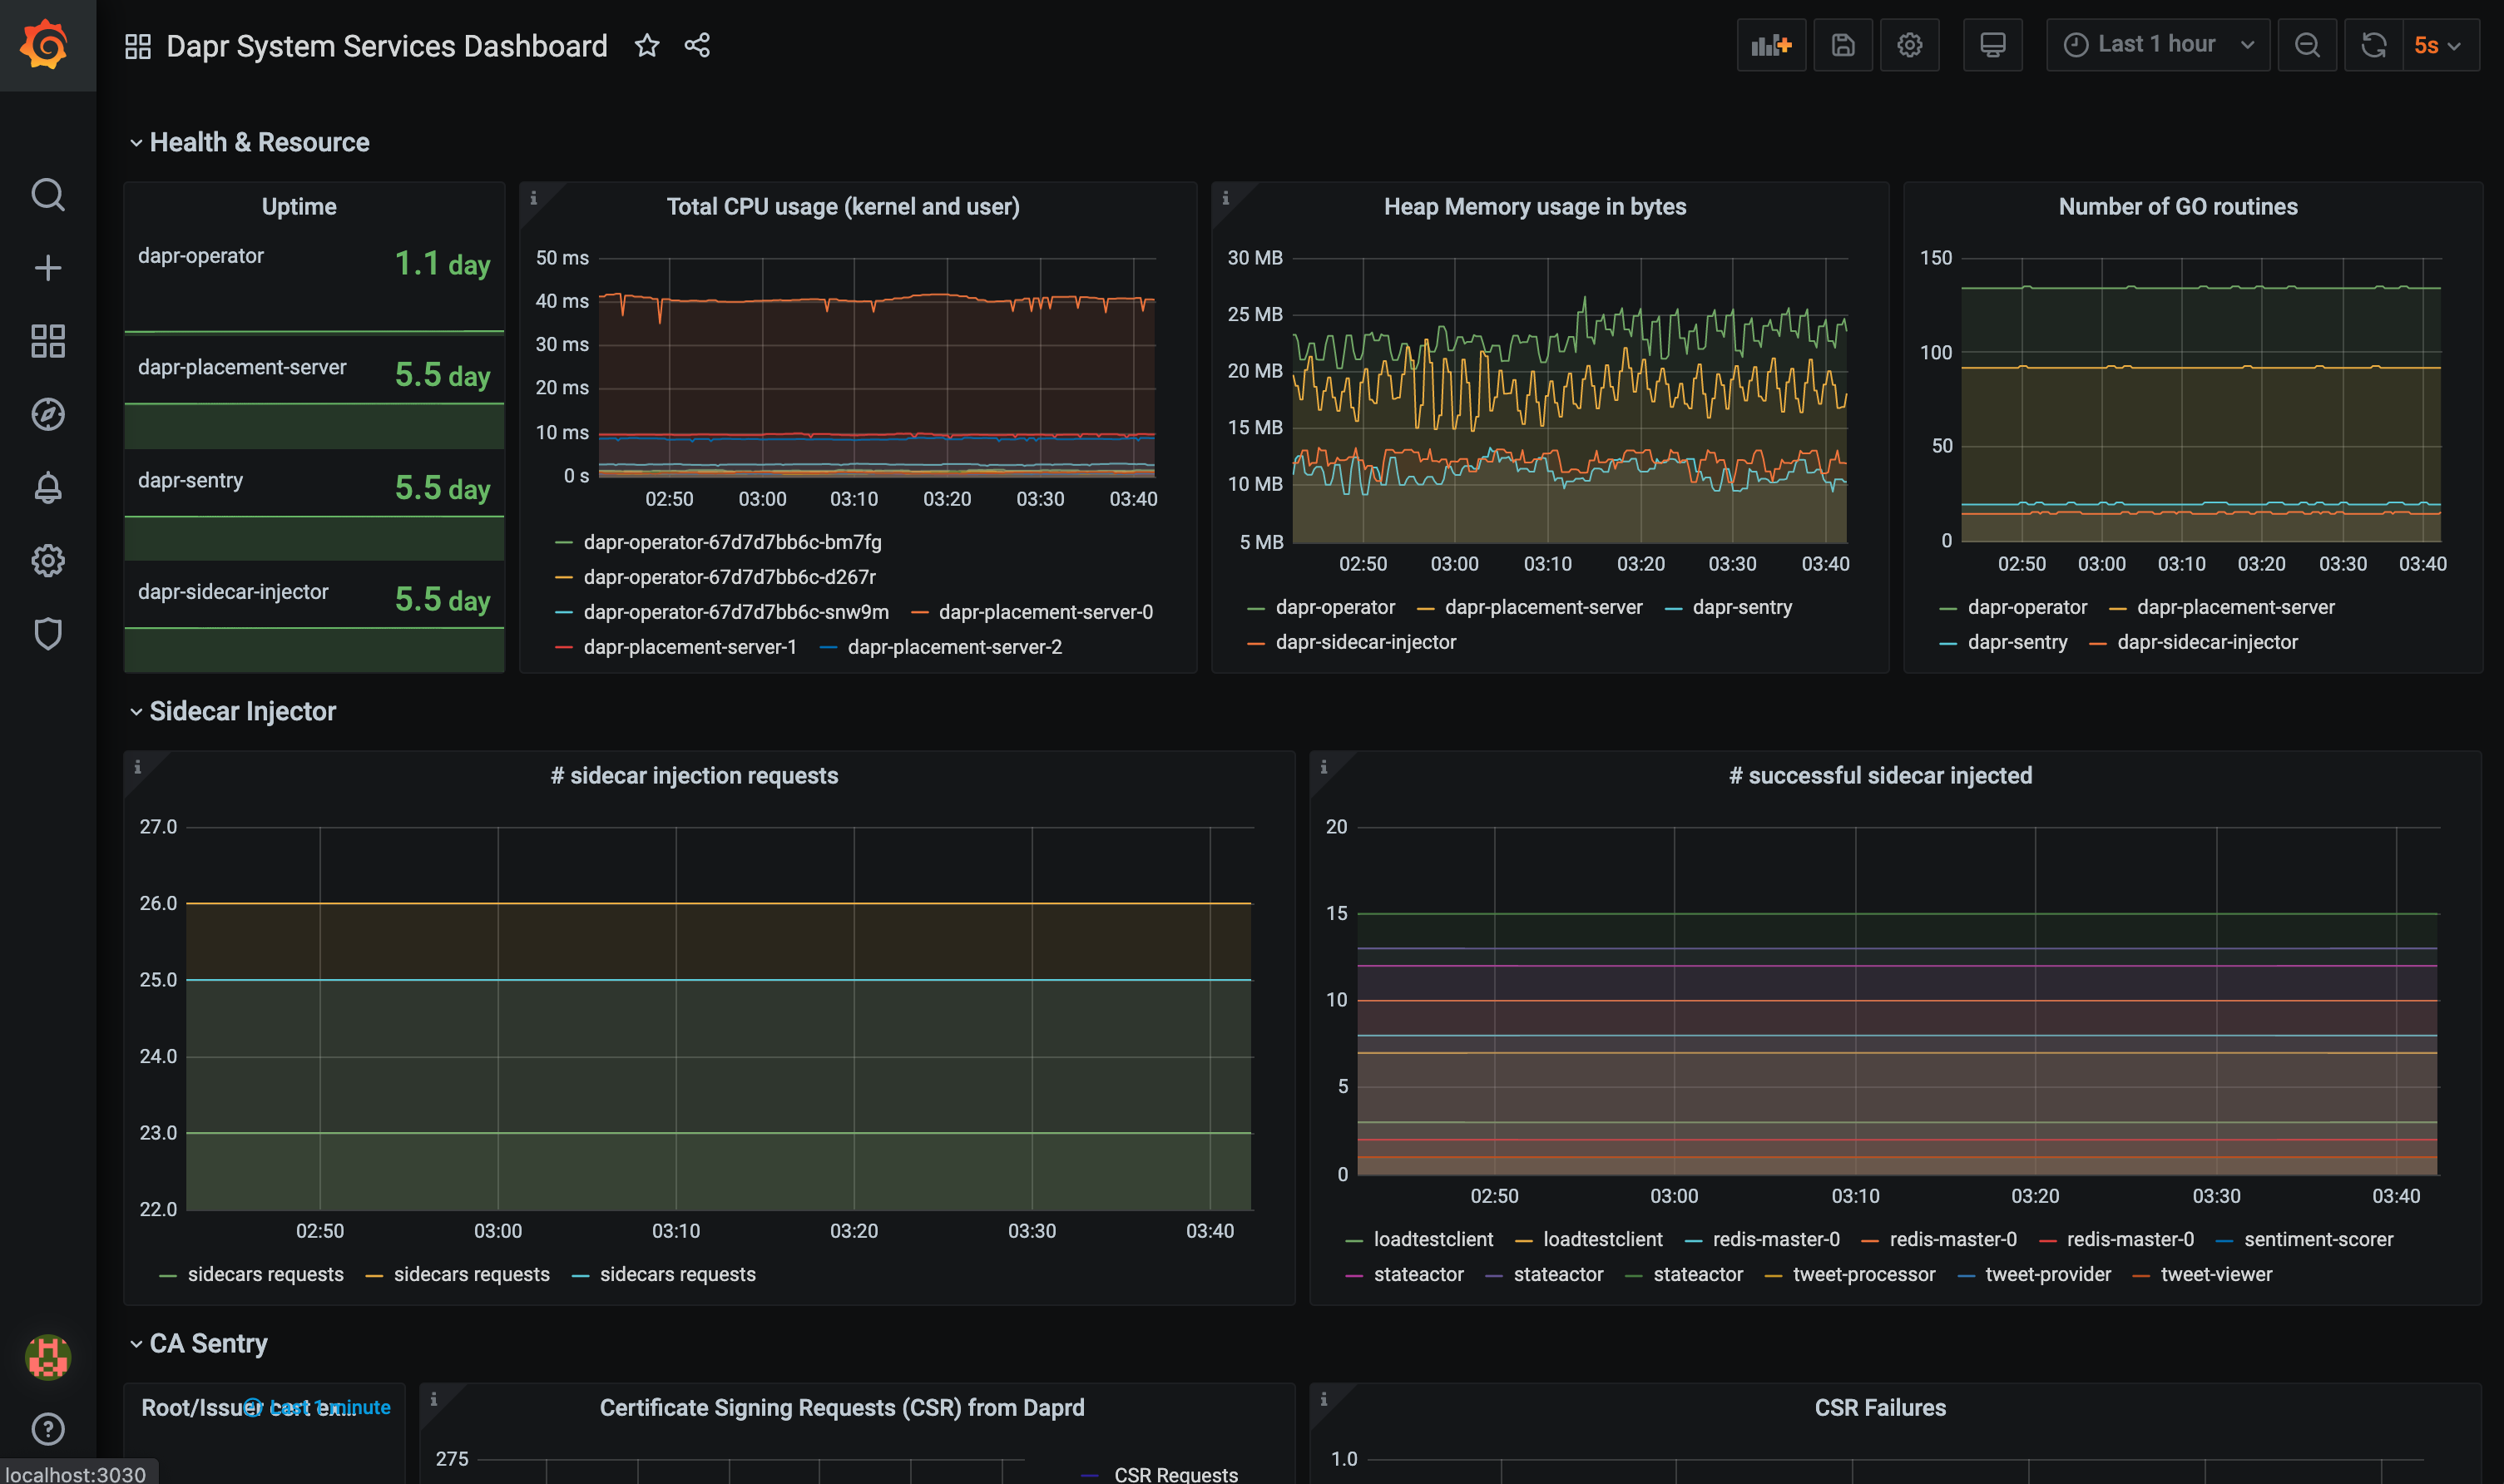
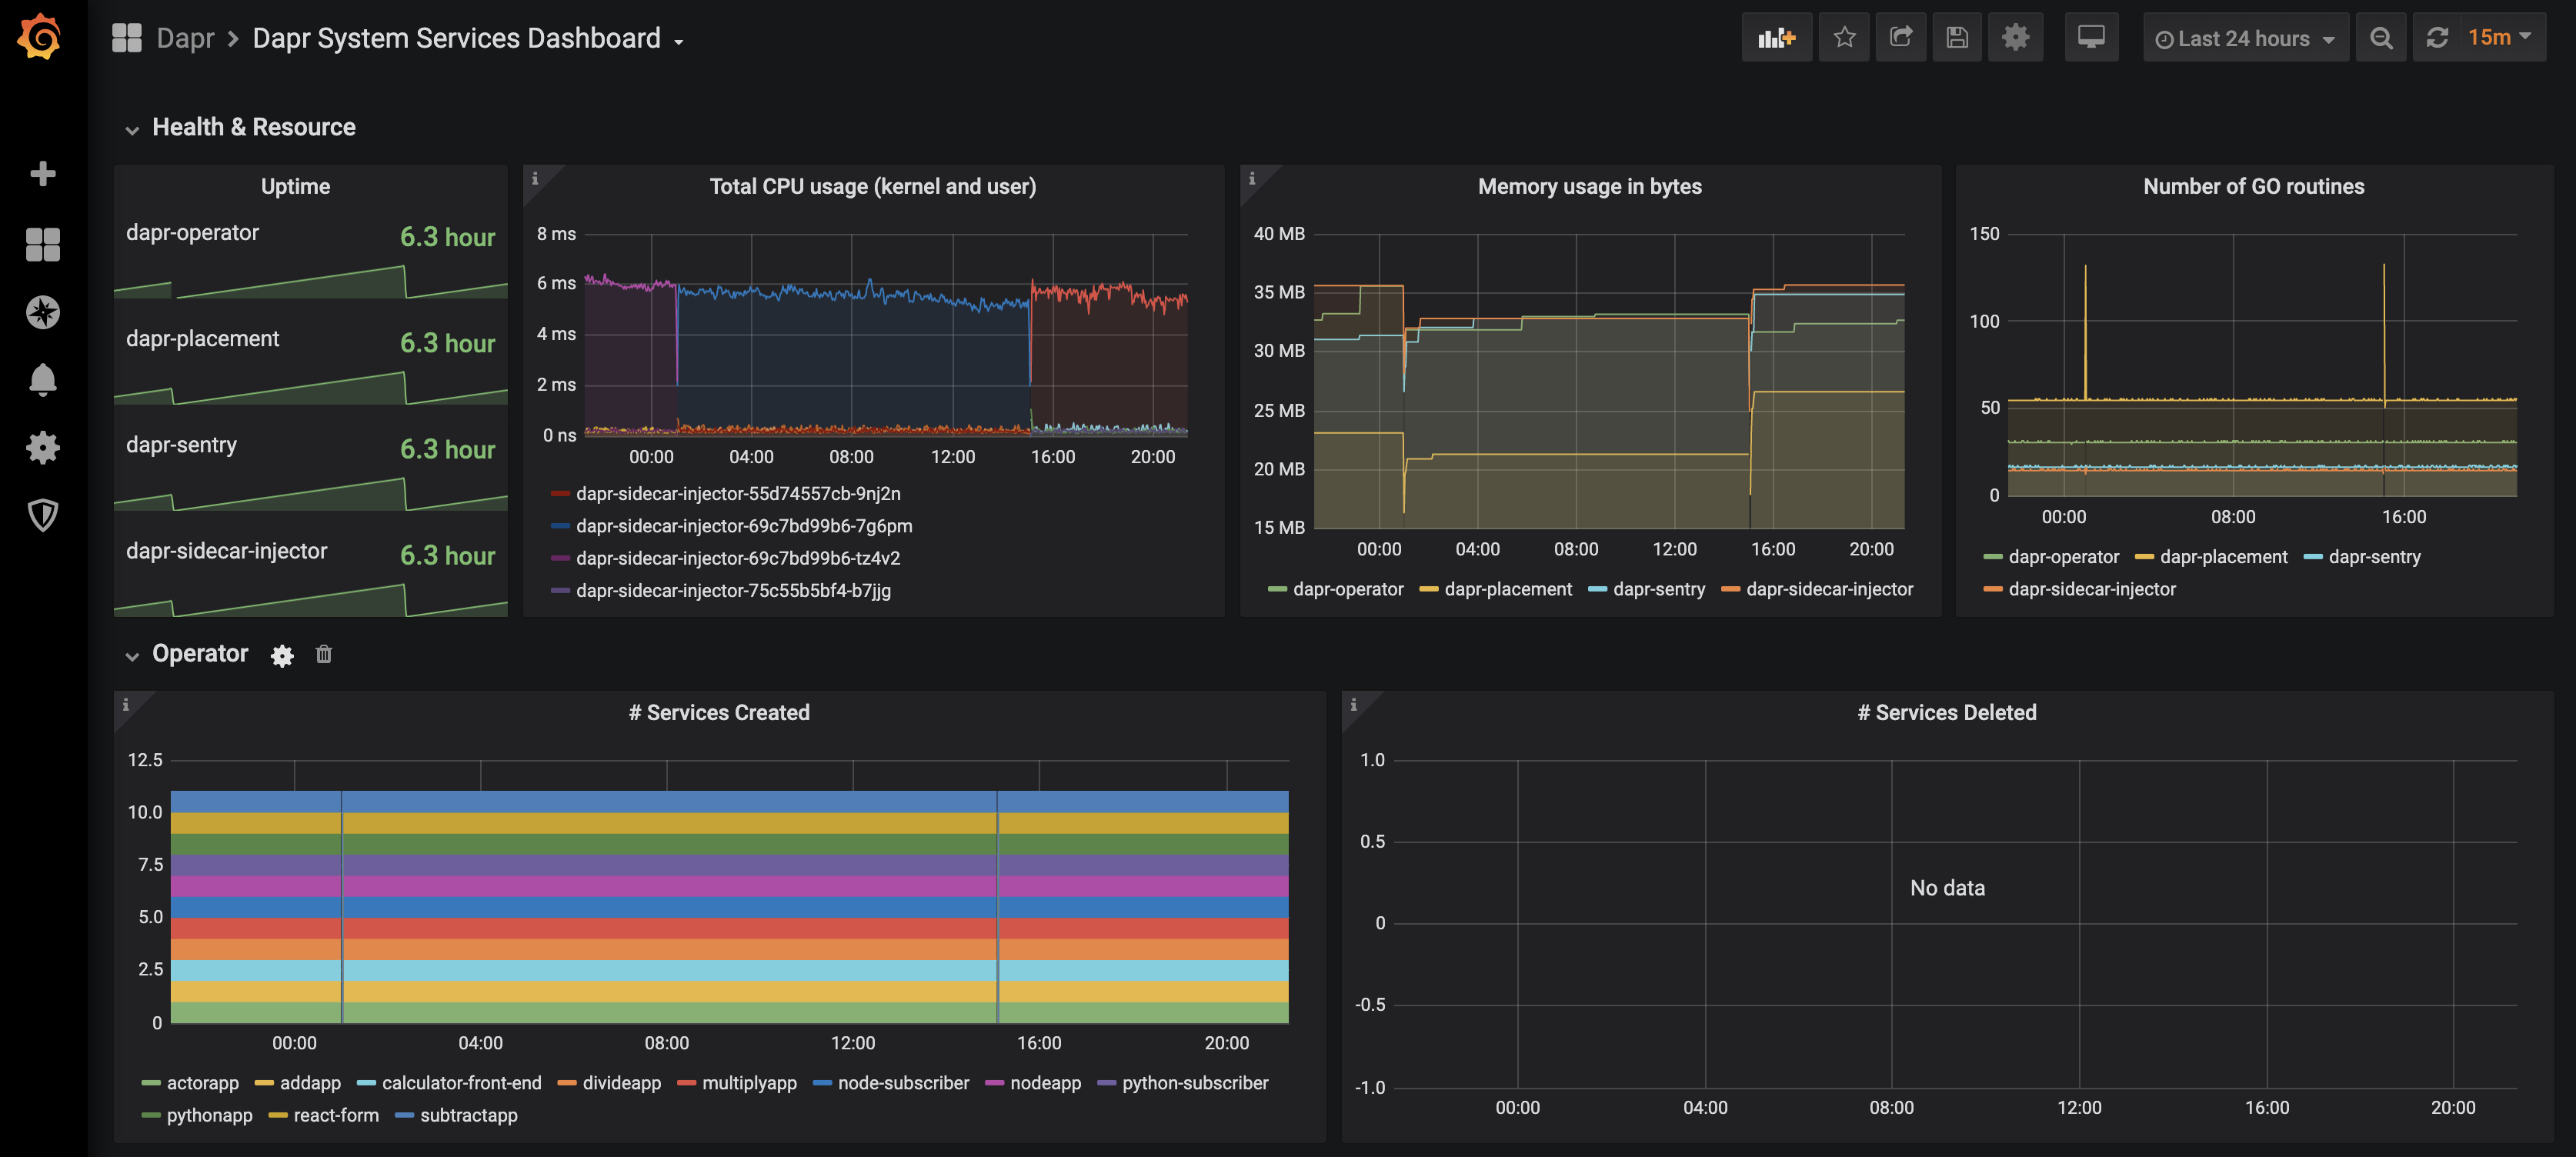
Available dashboards
The grafana-system-services-dashboard.json template shows Dapr system component status, dapr-operator, dapr-sidecar-injector, dapr-sentry, and dapr-placement:
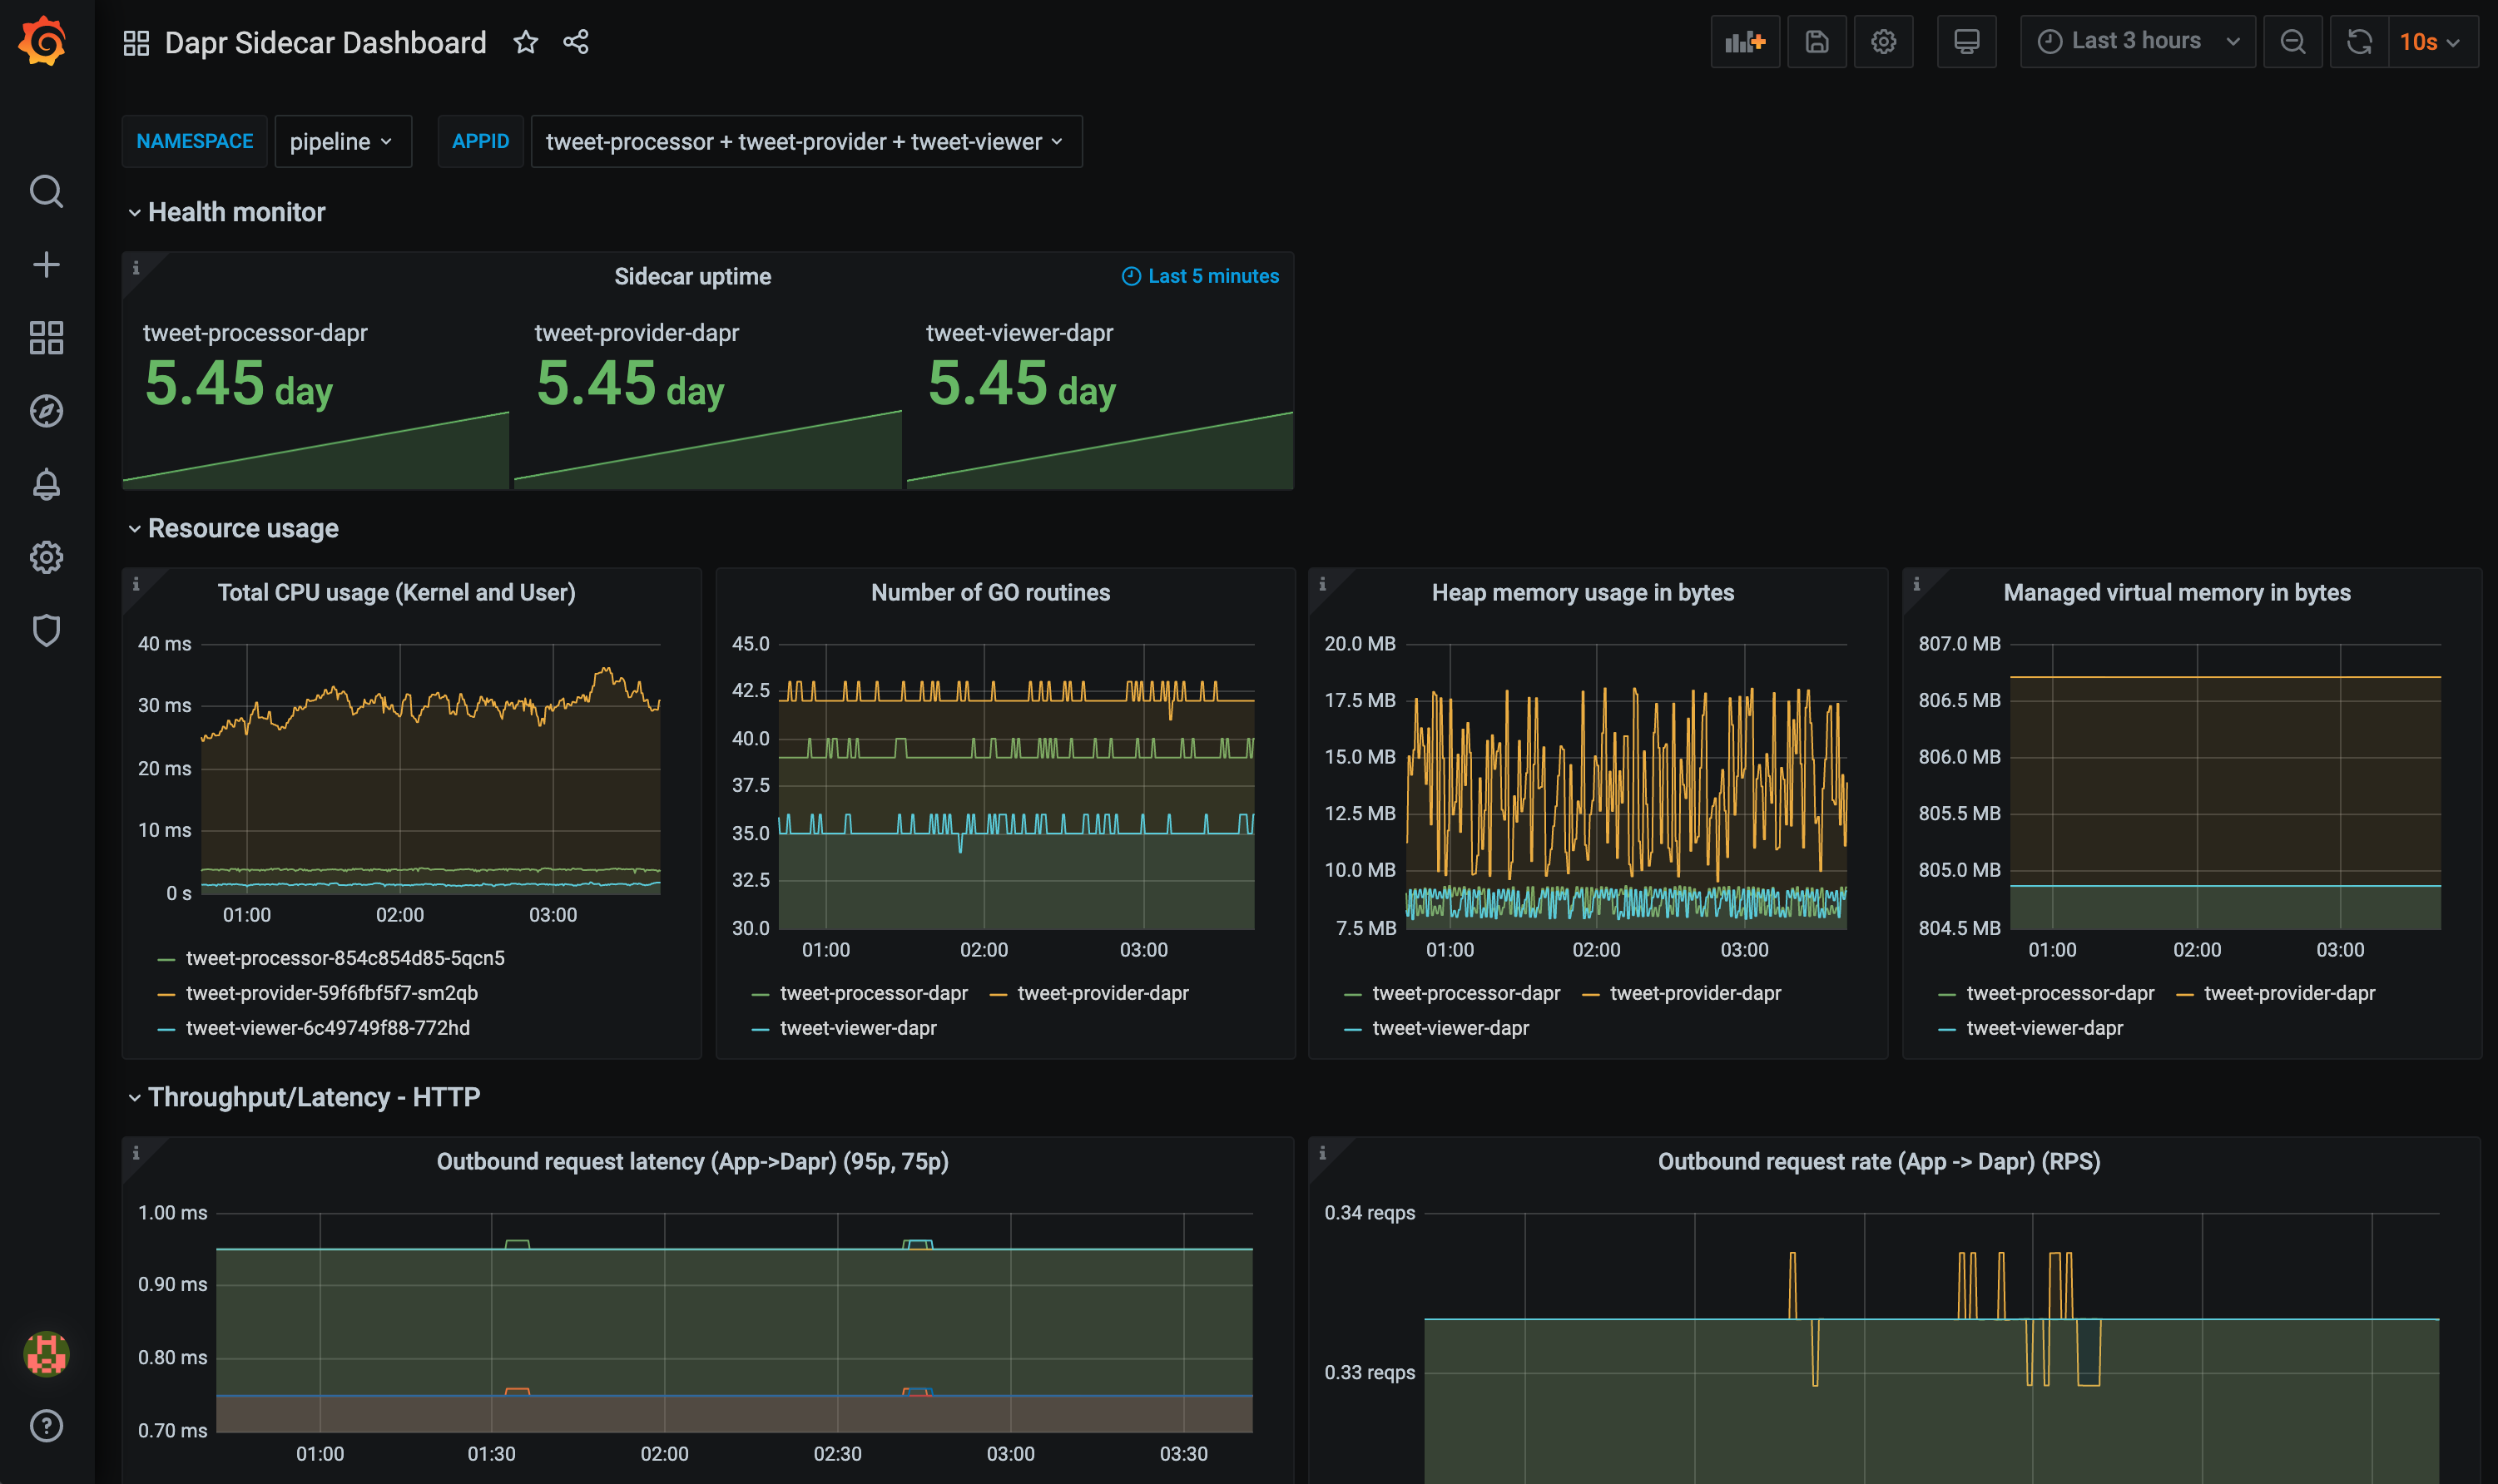
The grafana-sidecar-dashboard.json template shows Dapr sidecar status, including sidecar health/resources, throughput/latency of HTTP and gRPC, Actor, mTLS, etc.:
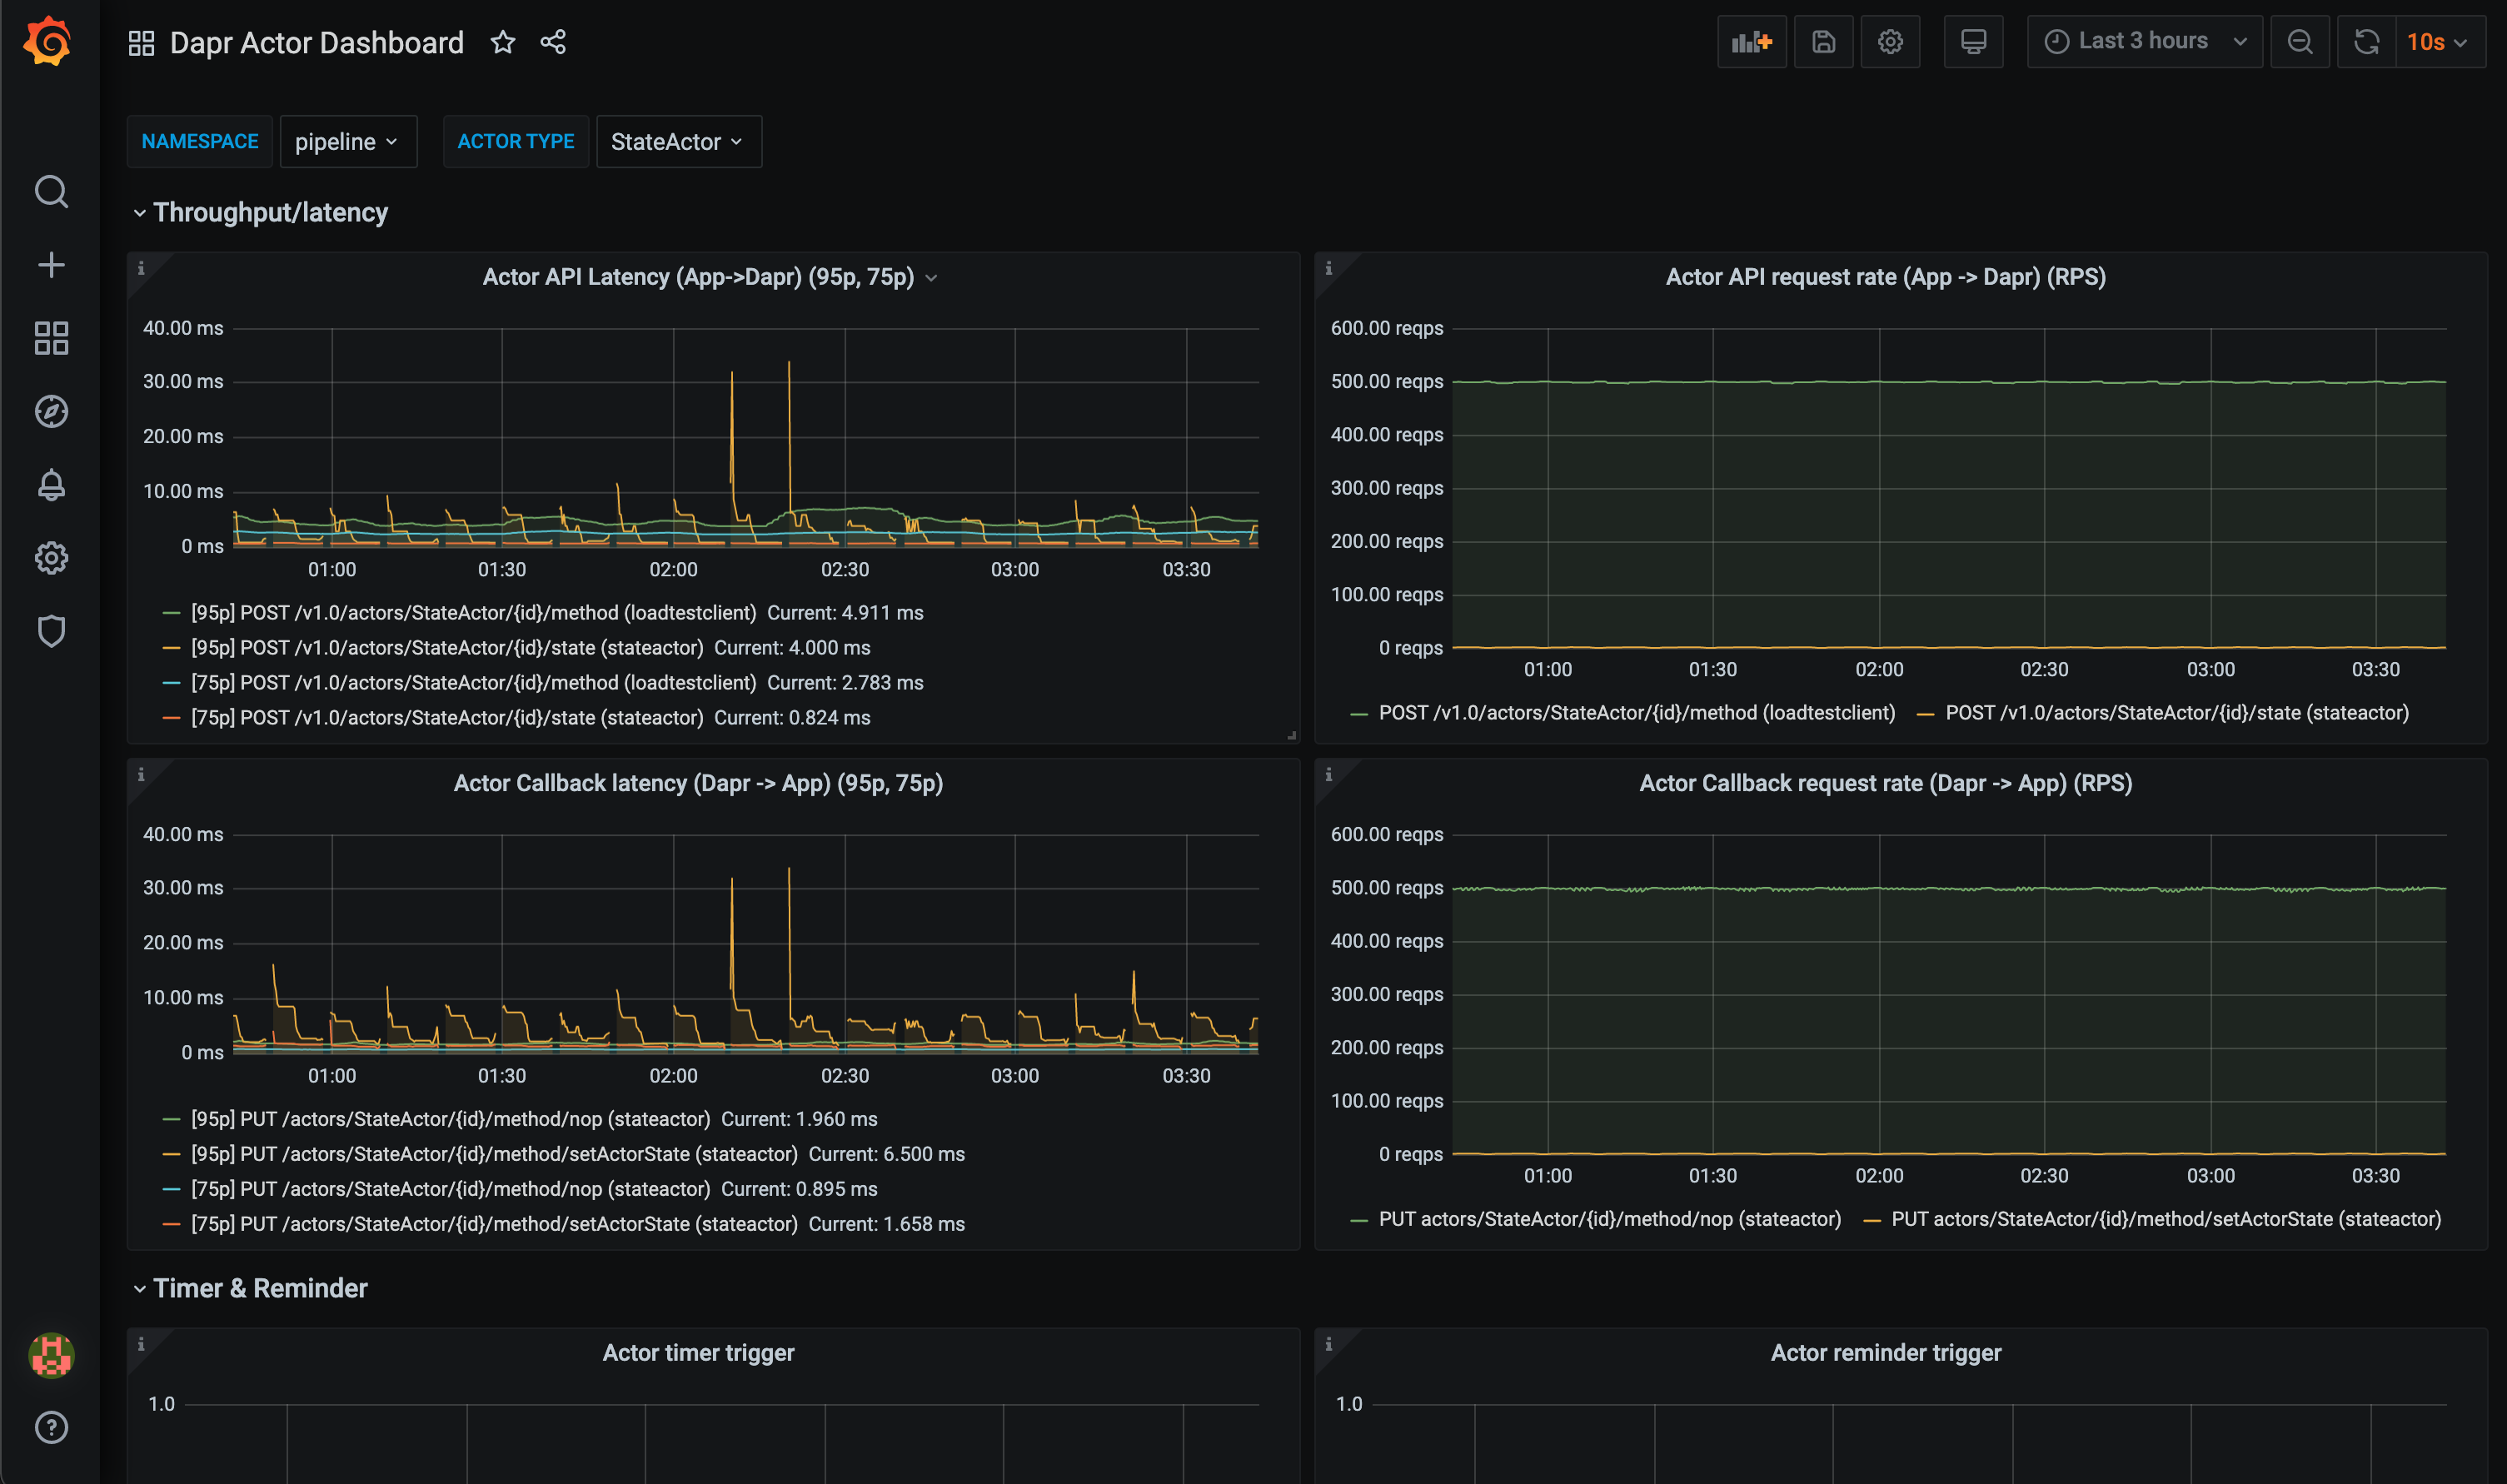
The grafana-actor-dashboard.json template shows Dapr Sidecar status, actor invocation throughput/latency, timer/reminder triggers, and turn-based concurrnecy:
Pre-requisites
Setup on Kubernetes
Install Grafana
Add the Grafana Helm repo:
helm repo add grafana https://grafana.github.io/helm-charts
helm repo update
Install the chart:
helm install grafana grafana/grafana -n dapr-monitoringNote
If you are Minikube user or want to disable persistent volume for development purpose, you can disable it by using the following command instead:
helm install grafana grafana/grafana -n dapr-monitoring --set persistence.enabled=falseRetrieve the admin password for Grafana login:
kubectl get secret --namespace dapr-monitoring grafana -o jsonpath="{.data.admin-password}" | base64 --decode ; echoYou will get a password similar to
cj3m0OfBNx8SLzUlTx91dEECgzRlYJb60D2evof1%. Remove the%character from the password to getcj3m0OfBNx8SLzUlTx91dEECgzRlYJb60D2evof1as the admin password.Validation Grafana is running in your cluster:
kubectl get pods -n dapr-monitoring

NAME                                                READY   STATUS       RESTARTS   AGE
dapr-prom-kube-state-metrics-9849d6cc6-t94p8        1/1     Running      0          4m58s
dapr-prom-prometheus-alertmanager-749cc46f6-9b5t8   2/2     Running      0          4m58s
dapr-prom-prometheus-node-exporter-5jh8p            1/1     Running      0          4m58s
dapr-prom-prometheus-node-exporter-88gbg            1/1     Running      0          4m58s
dapr-prom-prometheus-node-exporter-bjp9f            1/1     Running      0          4m58s
dapr-prom-prometheus-pushgateway-688665d597-h4xx2   1/1     Running      0          4m58s
dapr-prom-prometheus-server-694fd8d7c-q5d59         2/2     Running      0          4m58s
grafana-c49889cff-x56vj                             1/1     Running      0          5m10s
Configure Prometheus as data source
First you need to connect Prometheus as a data source to Grafana.
Port-forward to svc/grafana:
kubectl port-forward svc/grafana 8080:80 -n dapr-monitoring

Forwarding from 127.0.0.1:8080 -> 3000
Forwarding from [::1]:8080 -> 3000
Handling connection for 8080
Handling connection for 8080
Open a browser to
http://localhost:8080Login to Grafana
- Username =
admin - Password = Password from above
- Username =
Select
ConfigurationandData Sources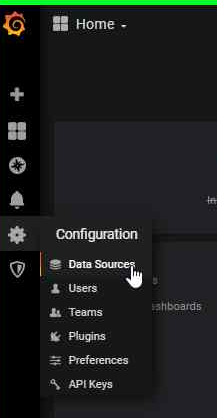
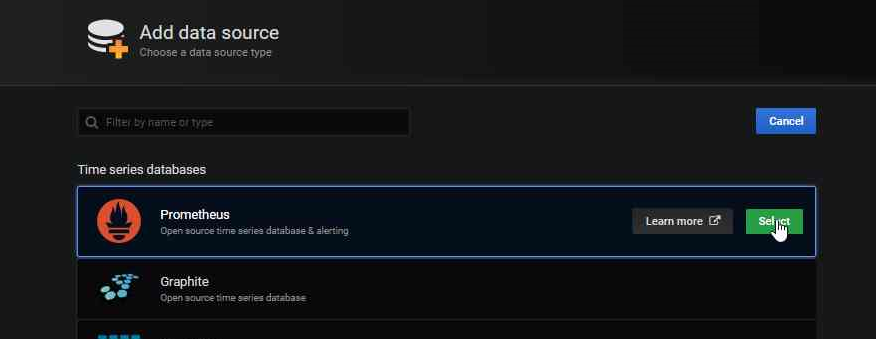
Add Prometheus as a data source.
Get your Prometheus HTTP URL
The Prometheus HTTP URL follows the format
http://<prometheus service endpoint>.<namespace>Start by getting the Prometheus server endpoint by running the following command:
kubectl get svc -n dapr-monitoring

NAME                                 TYPE        CLUSTER-IP        EXTERNAL-IP   PORT(S)             AGE
dapr-prom-kube-state-metrics         ClusterIP   10.0.174.177      <none>        8080/TCP            7d9h
dapr-prom-prometheus-alertmanager    ClusterIP   10.0.255.199      <none>        80/TCP              7d9h
dapr-prom-prometheus-node-exporter   ClusterIP   None              <none>        9100/TCP            7d9h
dapr-prom-prometheus-pushgateway     ClusterIP   10.0.190.59       <none>        9091/TCP            7d9h
dapr-prom-prometheus-server          ClusterIP   10.0.172.191      <none>        80/TCP              7d9h
elasticsearch-master                 ClusterIP   10.0.36.146       <none>        9200/TCP,9300/TCP   7d10h
elasticsearch-master-headless        ClusterIP   None              <none>        9200/TCP,9300/TCP   7d10h
grafana                              ClusterIP   10.0.15.229       <none>        80/TCP              5d5h
kibana-kibana                        ClusterIP   10.0.188.224      <none>        5601/TCP            7d10h
In this guide the server name is
dapr-prom-prometheus-serverand the namespace isdapr-monitoring, so the HTTP URL will behttp://dapr-prom-prometheus-server.dapr-monitoring.Fill in the following settings:
- Name:
Dapr - HTTP URL:
http://dapr-prom-prometheus-server.dapr-monitoring - Default: On
- Skip TLS Verify: On
- Necessary in order to save and test the configuration
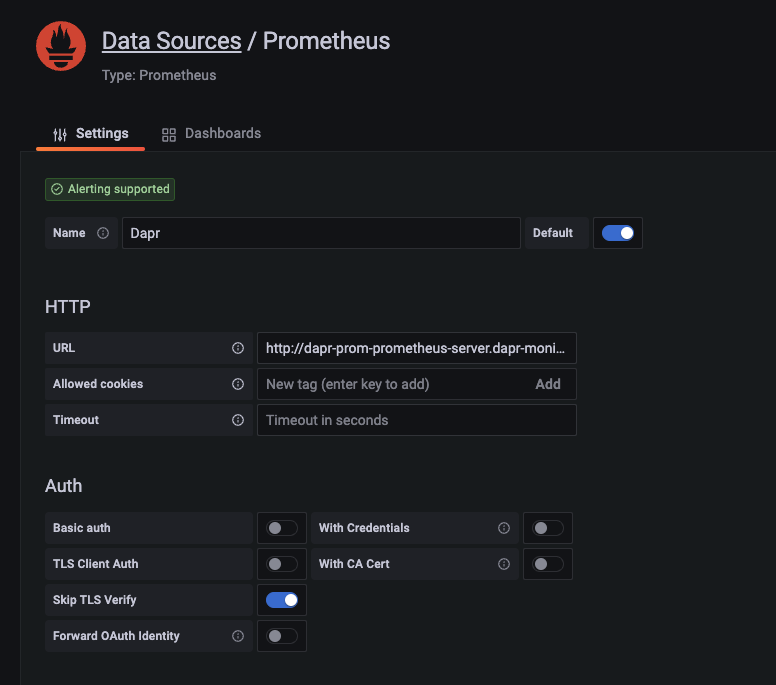
- Name:
Click
Save & Testbutton to verify that the connection succeeded.
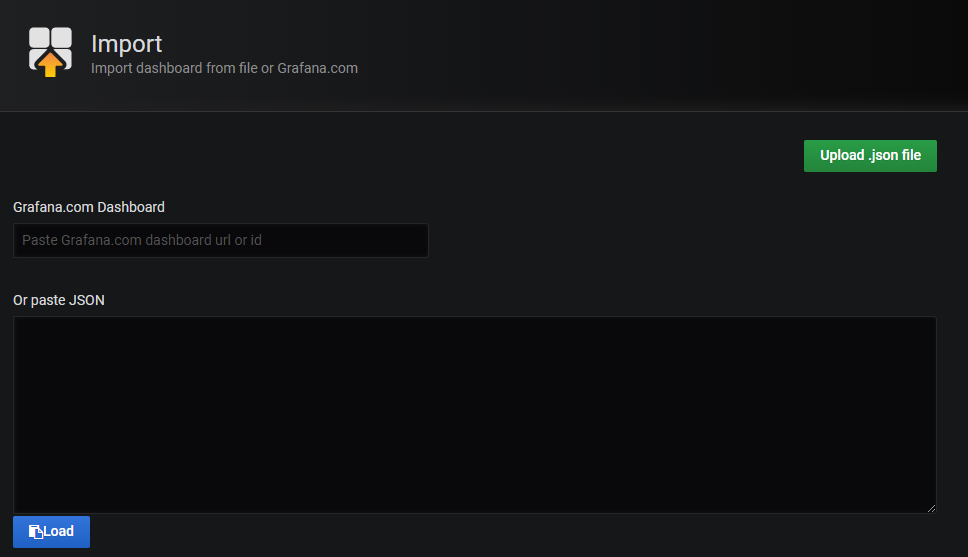
Import dashboards in Grafana
In the upper left corner of the Grafana home screen, click the “+” option, then “Import”.
You can now import Grafana dashboard templates from release assets for your Dapr version:
Find the dashboard that you imported and enjoy
Tip
Hover your mouse over the
iin the corner to the description of each chart: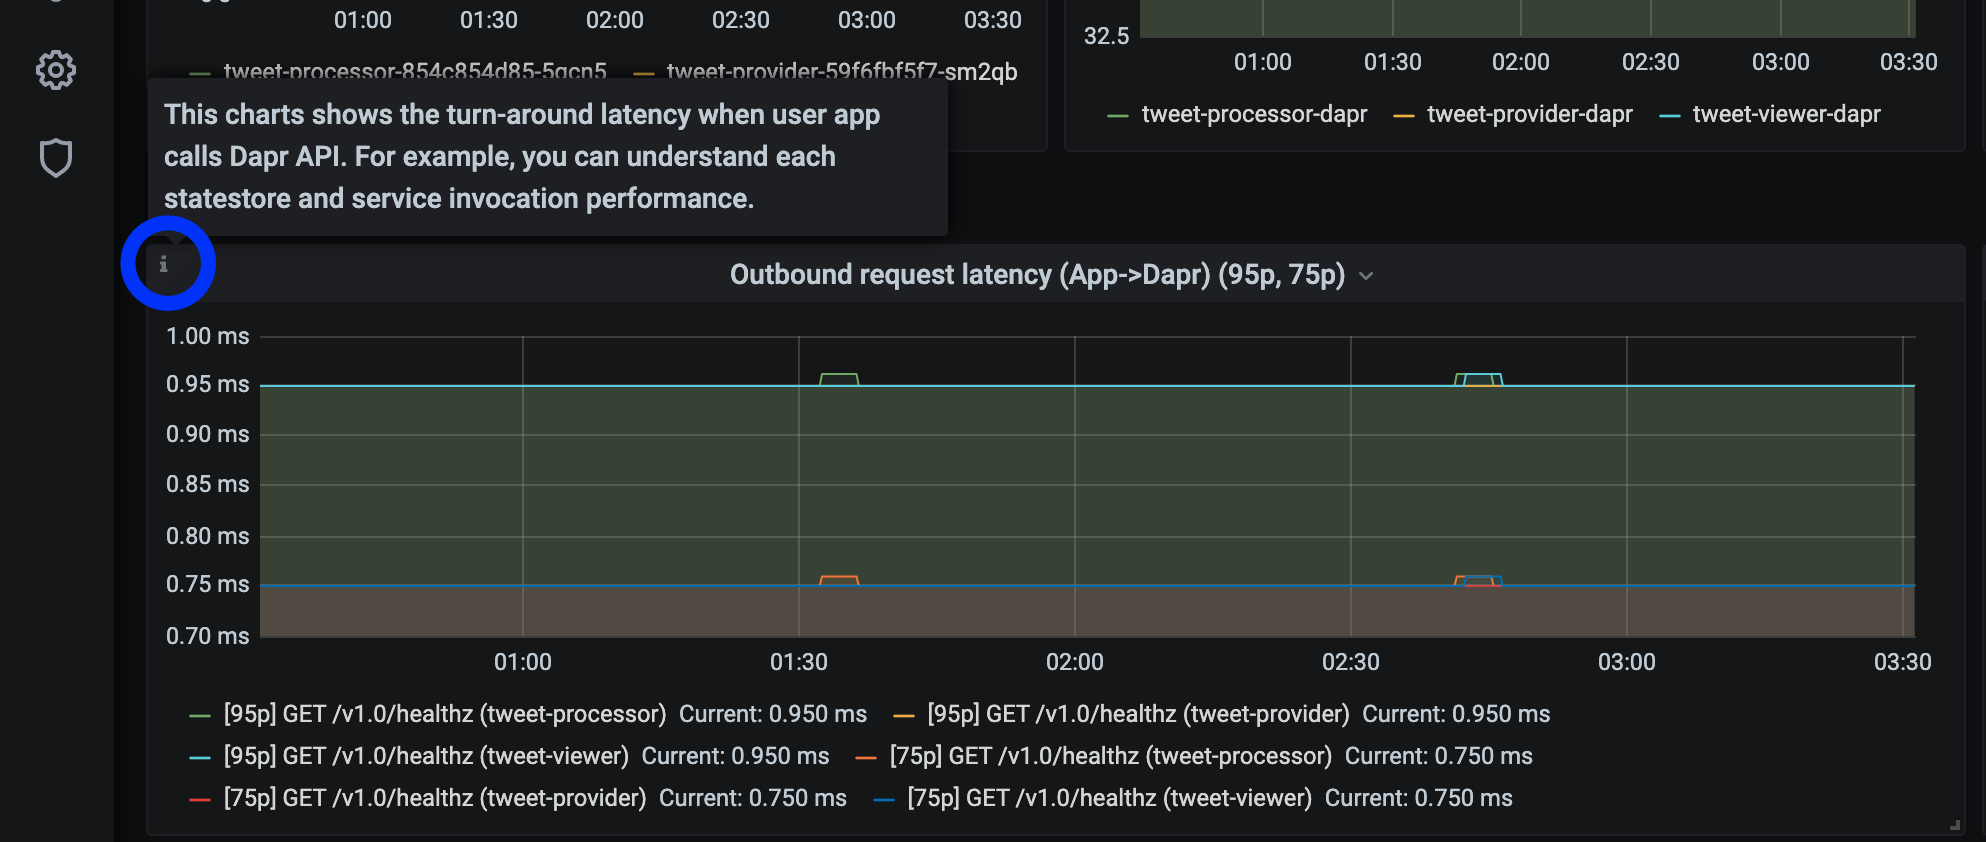
References
- Dapr Observability
- Prometheus Installation
- Prometheus on Kubernetes
- Prometheus Query Language
- Supported Dapr metrics
Example
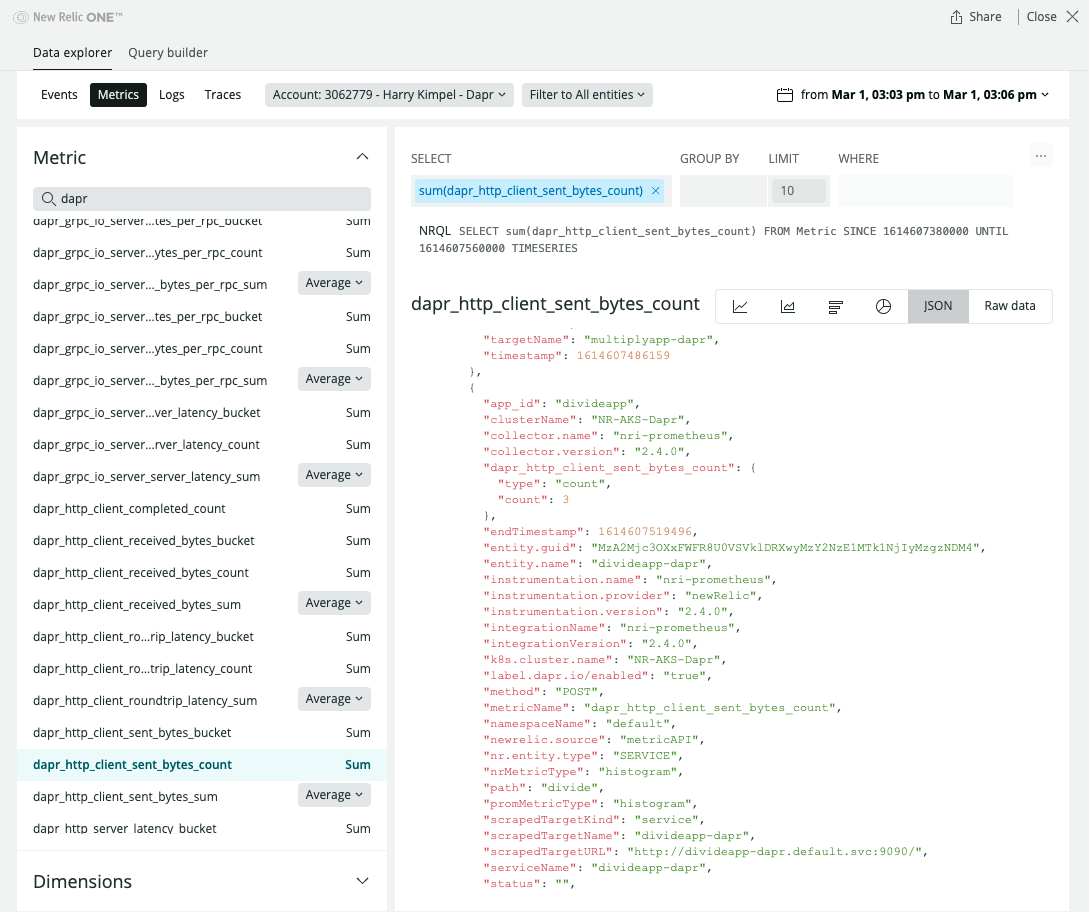
1.2.4 - How-To: Set-up New Relic to collect and analyze metrics
Prerequisites
- Perpetually free New Relic account, 100 GB/month of free data ingest, 1 free full access user, unlimited free basic users
Background
New Relic offers a Prometheus OpenMetrics Integration.
This document explains how to install it in your cluster, either using a Helm chart (recommended).
Installation
Install Helm following the official instructions.
Add the New Relic official Helm chart repository following these instructions
Run the following command to install the New Relic Logging Kubernetes plugin via Helm, replacing the placeholder value YOUR_LICENSE_KEY with your New Relic license key:
helm install nri-prometheus newrelic/nri-prometheus --set licenseKey=YOUR_LICENSE_KEY
View Metrics
Related Links/References
1.2.5 - How-To: Set up Azure Monitor to search logs and collect metrics
Prerequisites
Enable Prometheus metric scrape using config map
Make sure that Azure Monitor Agents (AMA) are running.
$ kubectl get pods -n kube-system
NAME                                                  READY   STATUS    RESTARTS   AGE
...
ama-logs-48kpv                                        2/2     Running   0          2d13h
ama-logs-mx24c                                        2/2     Running   0          2d13h
ama-logs-rs-f9bbb9898-vbt6k                           1/1     Running   0          30h
ama-logs-sm2mz                                        2/2     Running   0          2d13h
ama-logs-z7p4c                                        2/2     Running   0          2d13h
...
Apply config map to enable Prometheus metrics endpoint scrape.
You can use azm-config-map.yaml to enable Prometheus metrics endpoint scrape.
If you installed Dapr to a different namespace, you need to change the monitor_kubernetes_pod_namespaces array values. For example:
...
  prometheus-data-collection-settings: |-
    [prometheus_data_collection_settings.cluster]
        interval = "1m"
        monitor_kubernetes_pods = true
        monitor_kubernetes_pods_namespaces = ["dapr-system", "default"]
    [prometheus_data_collection_settings.node]
        interval = "1m"
...
Apply config map:
kubectl apply -f ./azm-config.map.yaml
Install Dapr with JSON formatted logs
Install Dapr with enabling JSON-formatted logs.
helm install dapr dapr/dapr --namespace dapr-system --set global.logAsJson=trueEnable JSON formatted log in Dapr sidecar and add Prometheus annotations.
Note: The Azure Monitor Agents (AMA) only sends the metrics if the Prometheus annotations are set.
Add dapr.io/log-as-json: "true" annotation to your deployment yaml.
Example:
apiVersion: apps/v1
kind: Deployment
metadata:
  name: pythonapp
  namespace: default
  labels:
    app: python
spec:
  replicas: 1
  selector:
    matchLabels:
      app: python
  template:
    metadata:
      labels:
        app: python
      annotations:
        dapr.io/enabled: "true"
        dapr.io/app-id: "pythonapp"
        dapr.io/log-as-json: "true"
        prometheus.io/scrape: "true"
        prometheus.io/port: "9090"
        prometheus.io/path: "/"

...
Search metrics and logs with Azure Monitor
Go to Azure Monitor in the Azure portal.
Search Dapr Logs.
Here is an example query, to parse JSON formatted logs and query logs from Dapr system processes.
ContainerLog
| extend parsed=parse_json(LogEntry)
| project Time=todatetime(parsed['time']), app_id=parsed['app_id'], scope=parsed['scope'],level=parsed['level'], msg=parsed['msg'], type=parsed['type'], ver=parsed['ver'], instance=parsed['instance']
| where level != ""
| sort by Time
- Search Metrics.
This query, queries process_resident_memory_bytes Prometheus metrics for Dapr system processes and renders timecharts.
InsightsMetrics
| where Namespace == "prometheus" and Name == "process_resident_memory_bytes"
| extend tags=parse_json(Tags)
| project TimeGenerated, Name, Val, app=tostring(tags['app'])
| summarize memInBytes=percentile(Val, 99) by bin(TimeGenerated, 1m), app
| where app startswith "dapr-"
| render timechart
References
1.3 - Logging
1.3.1 - Logs
Dapr produces structured logs to stdout, either in plain-text or JSON-formatted. By default, all Dapr processes (runtime, or sidecar, and all control plane services) write logs to the console (stdout) in plain-text. To enable JSON-formatted logging, you need to add the --log-as-json command flag when running Dapr processes.
Note
If you want to use a search engine such as Elastic Search or Azure Monitor to search the logs, it is strongly recommended to use JSON-formatted logs which the log collector and search engine can parse using the built-in JSON parser.Log schema
Dapr produces logs based on the following schema:
| Field | Description | Example |
|---|---|---|
| time | ISO8601 Timestamp | 2011-10-05T14:48:00.000Z |
| level | Log Level (info/warn/debug/error) | info |
| type | Log Type | log |
| msg | Log Message | hello dapr! |
| scope | Logging Scope | dapr.runtime |
| instance | Container Name | dapr-pod-xxxxx |
| app_id | Dapr App ID | dapr-app |
| ver | Dapr Runtime Version | 1.9.0 |
API logging may add other structured fields, as described in the documentation for API logging.
Plain text and JSON formatted logs
- Plain-text log examples
time="2022-11-01T17:08:48.303776-07:00" level=info msg="starting Dapr Runtime -- version 1.9.0 -- commit v1.9.0-g5dfcf2e" instance=dapr-pod-xxxx scope=dapr.runtime type=log ver=1.9.0
time="2022-11-01T17:08:48.303913-07:00" level=info msg="log level set to: info" instance=dapr-pod-xxxx scope=dapr.runtime type=log ver=1.9.0
- JSON-formatted log examples
{"instance":"dapr-pod-xxxx","level":"info","msg":"starting Dapr Runtime -- version 1.9.0 -- commit v1.9.0-g5dfcf2e","scope":"dapr.runtime","time":"2022-11-01T17:09:45.788005Z","type":"log","ver":"1.9.0"}
{"instance":"dapr-pod-xxxx","level":"info","msg":"log level set to: info","scope":"dapr.runtime","time":"2022-11-01T17:09:45.788075Z","type":"log","ver":"1.9.0"}
Log formats
Dapr supports printing either plain-text, the default, or JSON-formatted logs.
To use JSON-formatted logs, you need to add additional configuration options when you install Dapr and when deploy your apps. The recommendation is to use JSON-formatted logs because most log collectors and search engines can parse JSON more easily with built-in parsers.
Enabling JSON logging with the Dapr CLI
When using the Dapr CLI to run an application, pass the --log-as-json option to enable JSON-formatted logs, for example:
dapr run \
  --app-id orderprocessing \
  --resources-path ./components/ \
  --log-as-json \
    -- python3 OrderProcessingService.py
Enabling JSON logging in Kubernetes
The following steps describe how to configure JSON-formatted logs for Kubernetes
Dapr control plane
All services in the Dapr control plane (such as operator, sentry, etc) support a --log-as-json option to enable JSON-formatted logging.
If you’re deploying Dapr to Kubernetes using a Helm chart, you can enable JSON-formatted logs for Dapr system services by passing the --set global.logAsJson=true option; for example:
helm upgrade --install dapr \
  dapr/dapr \
  --namespace dapr-system \
  --set global.logAsJson=true
Enable JSON-formatted log for Dapr sidecars
You can enable JSON-formatted logs in Dapr sidecars by adding the dapr.io/log-as-json: "true" annotation to the deployment, for example:
apiVersion: apps/v1
kind: Deployment
metadata:
  name: pythonapp
  labels:
    app: python
spec:
  selector:
    matchLabels:
      app: python
  template:
    metadata:
      labels:
        app: python
      annotations:
        dapr.io/enabled: "true"
        dapr.io/app-id: "pythonapp"
        # This enables JSON-formatted logging
        dapr.io/log-as-json: "true"
...
API Logging
API logging enables you to see the API calls your application makes to the Dapr sidecar, to debug issues or monitor the behavior of your application. You can combine both Dapr API logging with Dapr log events.
See configure and view Dapr Logs and configure and view Dapr API Logs for more information.
Log collectors
If you run Dapr in a Kubernetes cluster, Fluentd is a popular container log collector. You can use Fluentd with a JSON parser plugin to parse Dapr JSON-formatted logs. This how-to shows how to configure Fluentd in your cluster.
If you are using Azure Kubernetes Service, you can use the built-in agent to collect logs with Azure Monitor without needing to install Fluentd.
Search engines
If you use Fluentd, we recommend using Elastic Search and Kibana. This how-to shows how to set up Elastic Search and Kibana in your Kubernetes cluster.
If you are using the Azure Kubernetes Service, you can use Azure Monitor for containers without installing any additional monitoring tools. Also read How to enable Azure Monitor for containers
References
1.3.2 - How-To: Set up Fluentd, Elastic search and Kibana in Kubernetes
Prerequisites
Install Elastic search and Kibana
Create a Kubernetes namespace for monitoring tools
kubectl create namespace dapr-monitoringAdd the helm repo for Elastic Search
helm repo add elastic https://helm.elastic.co
helm repo update
Install Elastic Search using Helm
By default, the chart creates 3 replicas which must be on different nodes. If your cluster has fewer than 3 nodes, specify a smaller number of replicas. For example, this sets the number of replicas to 1:
helm install elasticsearch elastic/elasticsearch --version 7.17.3 -n dapr-monitoring --set replicas=1Otherwise:
helm install elasticsearch elastic/elasticsearch --version 7.17.3 -n dapr-monitoringIf you are using minikube or simply want to disable persistent volumes for development purposes, you can do so by using the following command:
helm install elasticsearch elastic/elasticsearch --version 7.17.3 -n dapr-monitoring --set persistence.enabled=false,replicas=1Install Kibana
helm install kibana elastic/kibana --version 7.17.3 -n dapr-monitoringEnsure that Elastic Search and Kibana are running in your Kubernetes cluster
$ kubectl get pods -n dapr-monitoring
NAME                            READY   STATUS    RESTARTS   AGE
elasticsearch-master-0          1/1     Running   0          6m58s
kibana-kibana-95bc54b89-zqdrk   1/1     Running   0          4m21s
Install Fluentd
Install config map and Fluentd as a daemonset
Download these config files:
Note: If you already have Fluentd running in your cluster, please enable the nested json parser so that it can parse JSON-formatted logs from Dapr.
Apply the configurations to your cluster:
kubectl apply -f ./fluentd-config-map.yaml
kubectl apply -f ./fluentd-dapr-with-rbac.yaml
Ensure that Fluentd is running as a daemonset. The number of FluentD instances should be the same as the number of cluster nodes. In the example below, there is only one node in the cluster:
$ kubectl get pods -n kube-system -w
NAME                          READY   STATUS    RESTARTS   AGE
coredns-6955765f44-cxjxk      1/1     Running   0          4m41s
coredns-6955765f44-jlskv      1/1     Running   0          4m41s
etcd-m01                      1/1     Running   0          4m48s
fluentd-sdrld                 1/1     Running   0          14s
Install Dapr with JSON formatted logs
Install Dapr with enabling JSON-formatted logs
helm repo add dapr https://dapr.github.io/helm-charts/
helm repo update
helm install dapr dapr/dapr --namespace dapr-system --set global.logAsJson=true
Enable JSON formatted log in Dapr sidecar
Add the
dapr.io/log-as-json: "true"annotation to your deployment yaml. For example:apiVersion: apps/v1 kind: Deployment metadata: name: pythonapp namespace: default labels: app: python spec: replicas: 1 selector: matchLabels: app: python template: metadata: labels: app: python annotations: dapr.io/enabled: "true" dapr.io/app-id: "pythonapp" dapr.io/log-as-json: "true" ...
Search logs
Note: Elastic Search takes a time to index the logs that Fluentd sends.
Port-forward from localhost to
svc/kibana-kibana$ kubectl port-forward svc/kibana-kibana 5601 -n dapr-monitoring Forwarding from 127.0.0.1:5601 -> 5601 Forwarding from [::1]:5601 -> 5601 Handling connection for 5601 Handling connection for 5601Browse to
http://localhost:5601Expand the drop-down menu and click Management → Stack Management
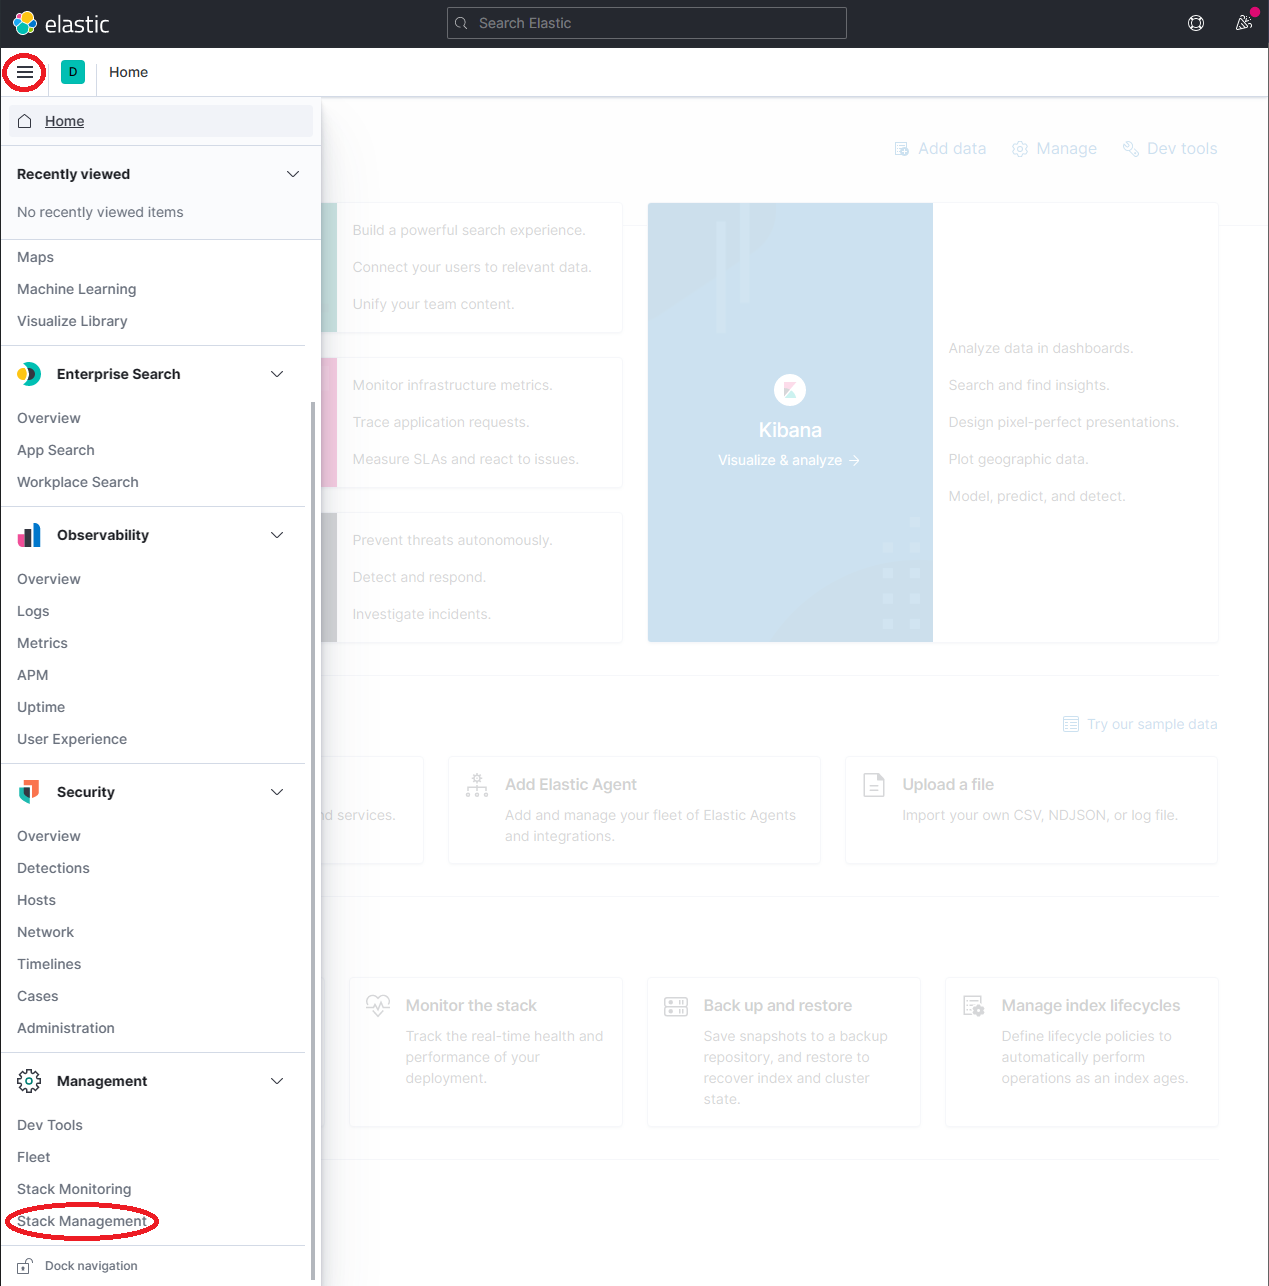
On the Stack Management page, select Data → Index Management and wait until
dapr-*is indexed.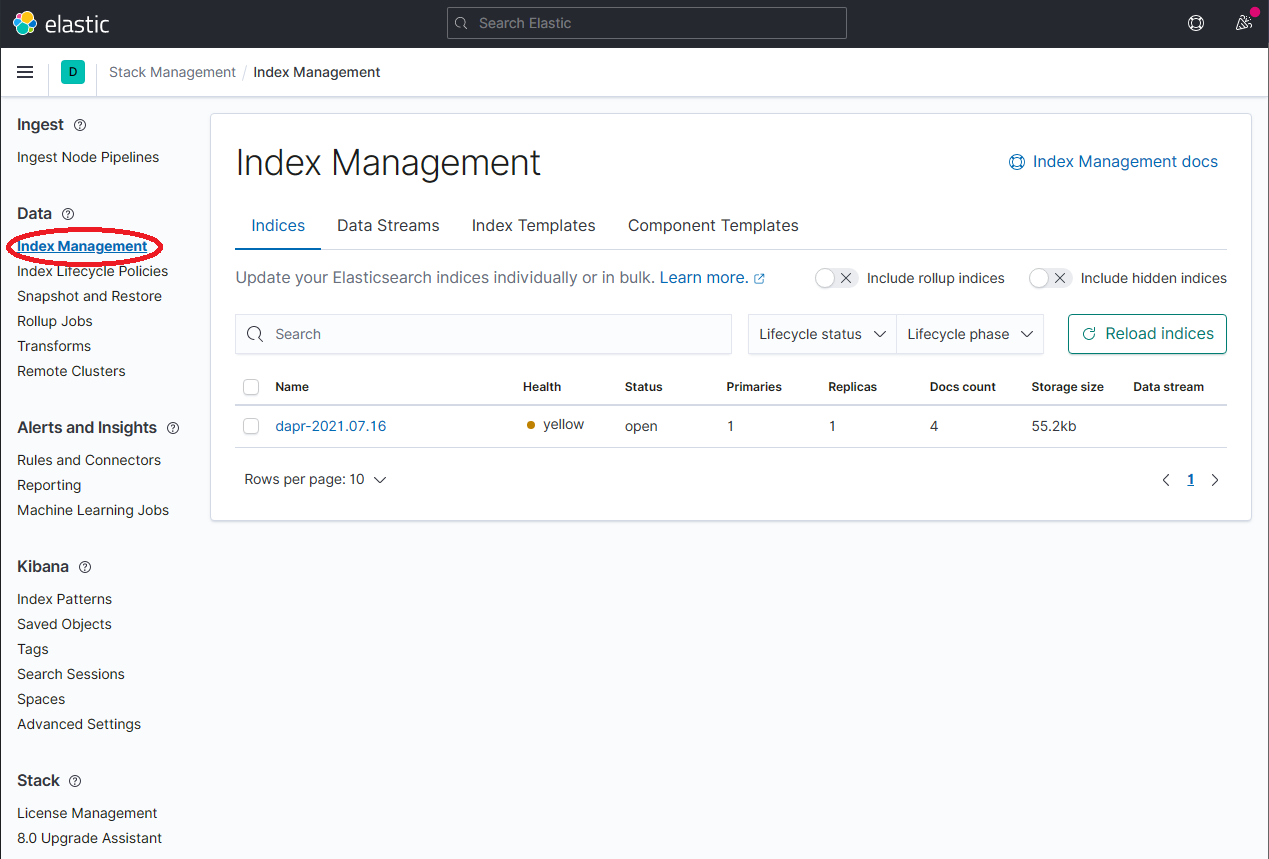
Once
dapr-*is indexed, click on Kibana → Index Patterns and then the Create index pattern button.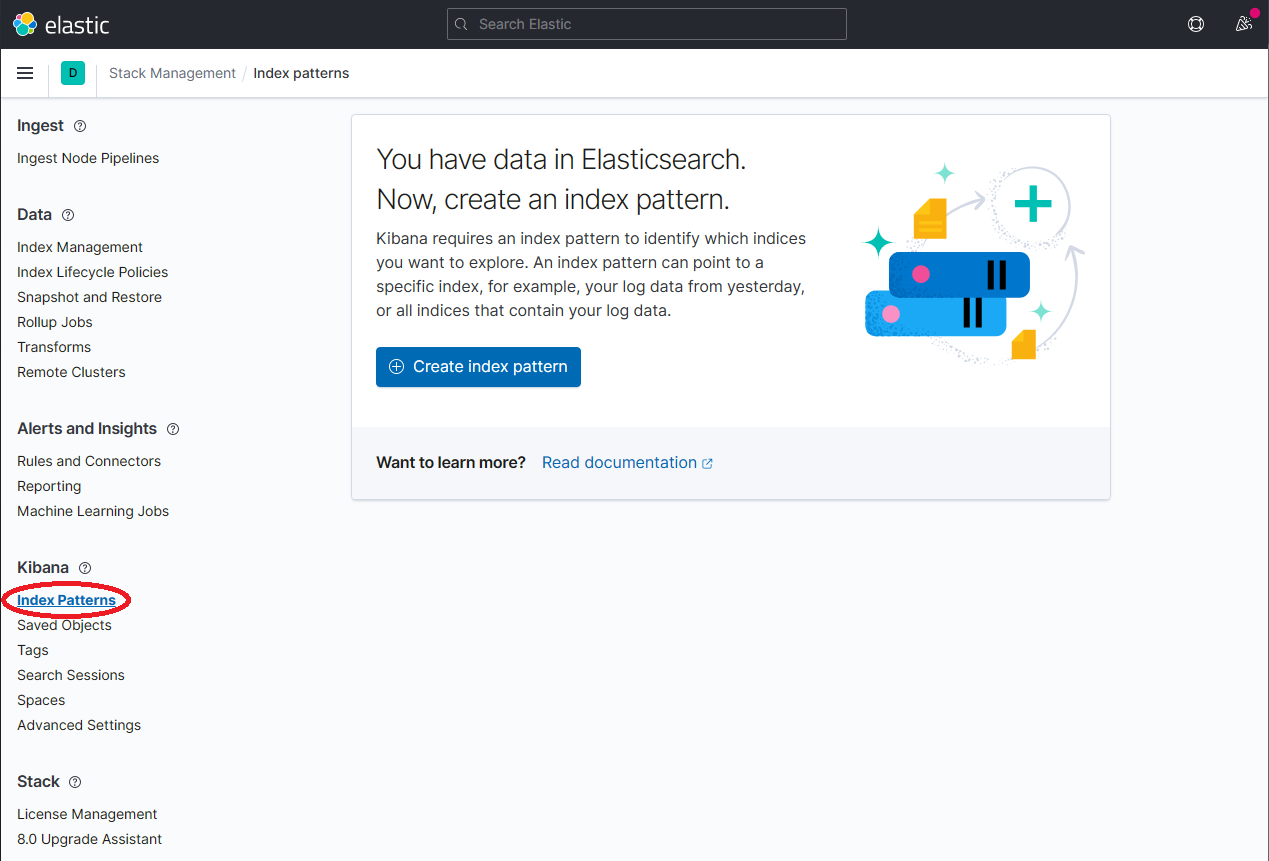
Define a new index pattern by typing
dapr*into the Index Pattern name field, then click the Next step button to continue.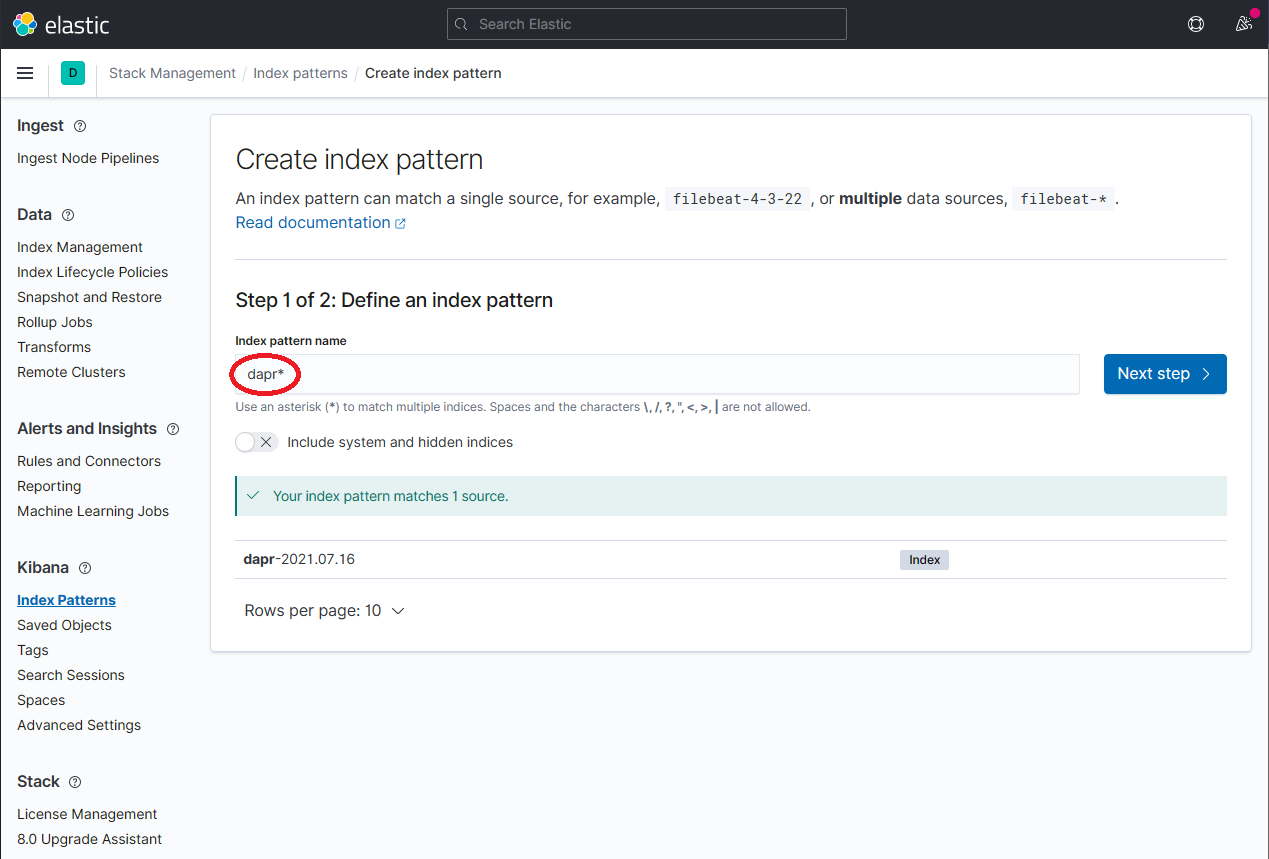
Configure the primary time field to use with the new index pattern by selecting the
@timestampoption from the Time field drop-down. Click the Create index pattern button to complete creation of the index pattern.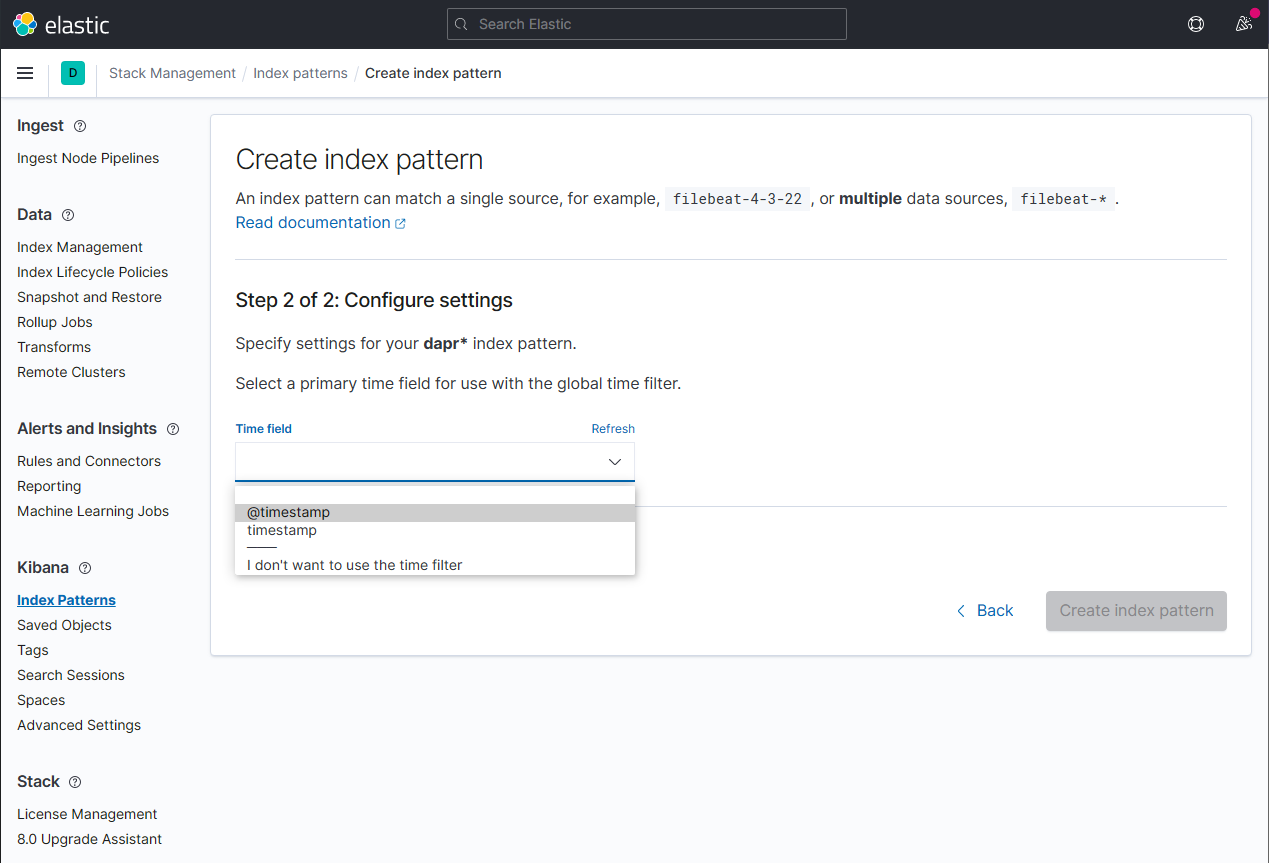
The newly created index pattern should be shown. Confirm that the fields of interest such as
scope,type,app_id,level, etc. are being indexed by using the search box in the Fields tab.Note: If you cannot find the indexed field, please wait. The time it takes to search across all indexed fields depends on the volume of data and size of the resource that the elastic search is running on.
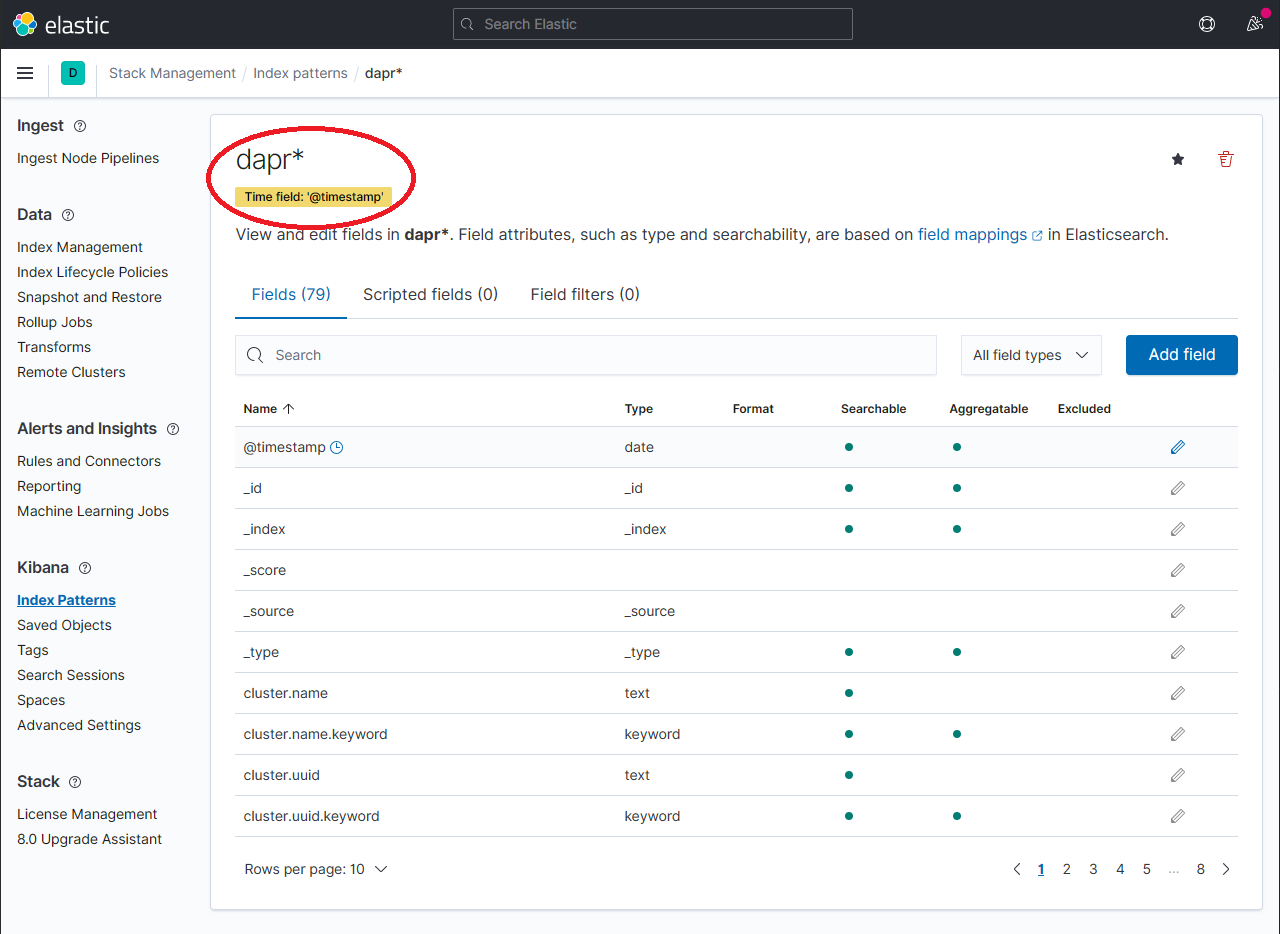
To explore the indexed data, expand the drop-down menu and click Analytics → Discover.
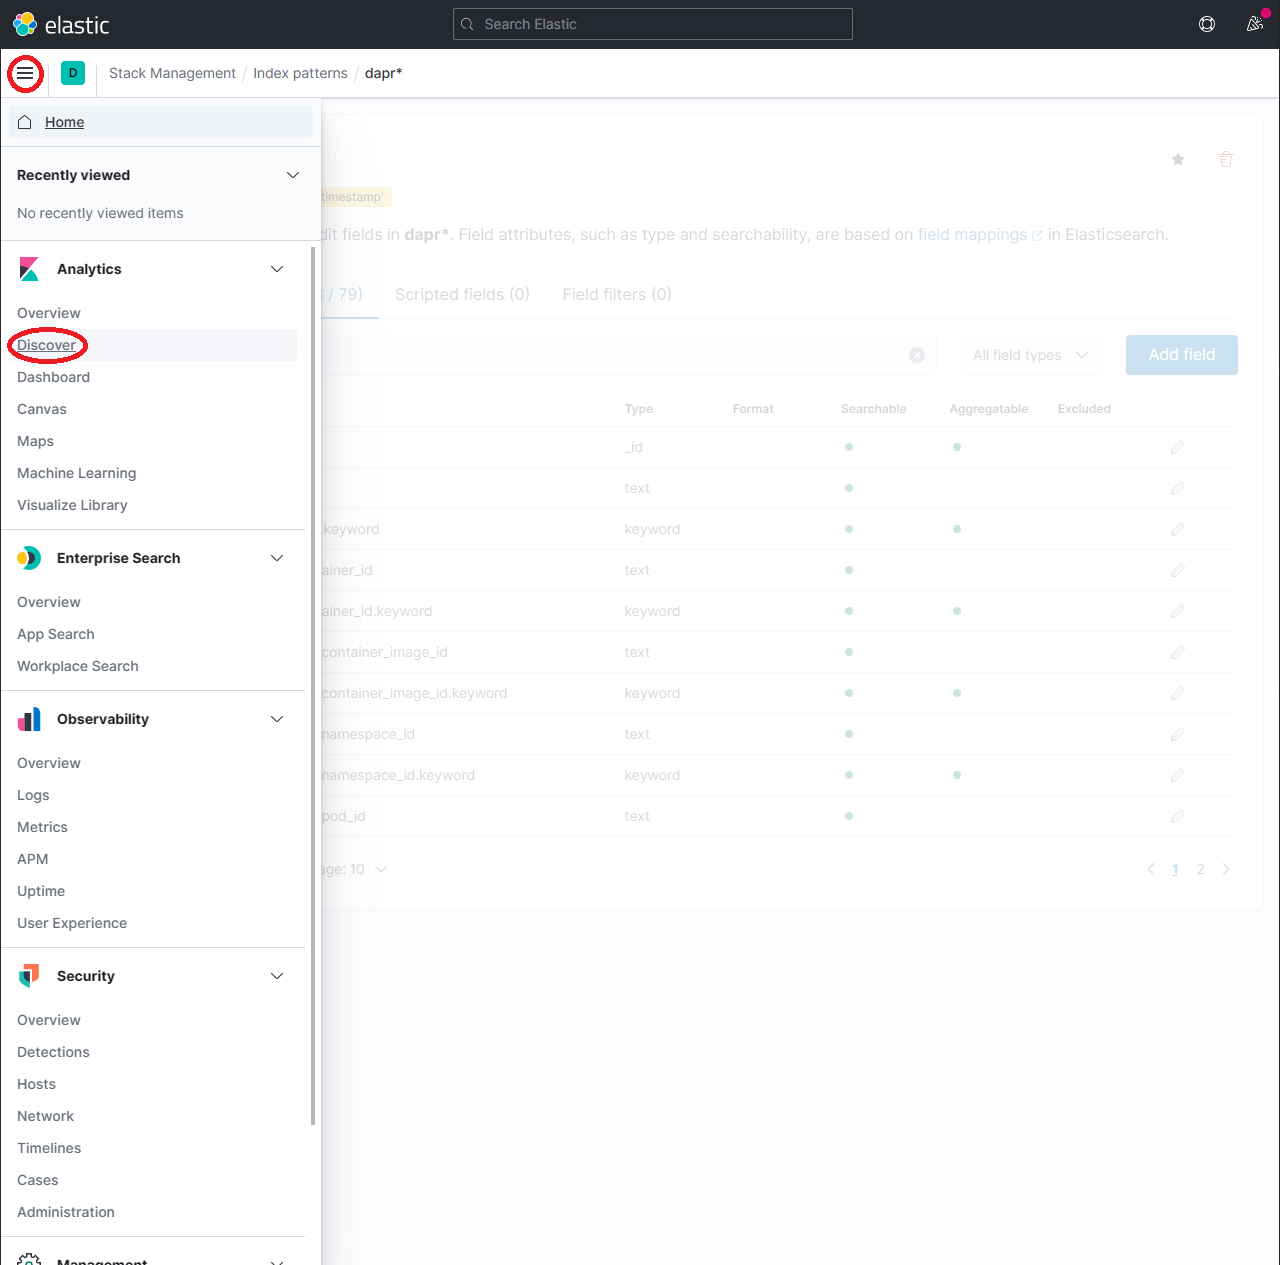
In the search box, type in a query string such as
scope:*and click the Refresh button to view the results.Note: This can take a long time. The time it takes to return all results depends on the volume of data and size of the resource that the elastic search is running on.
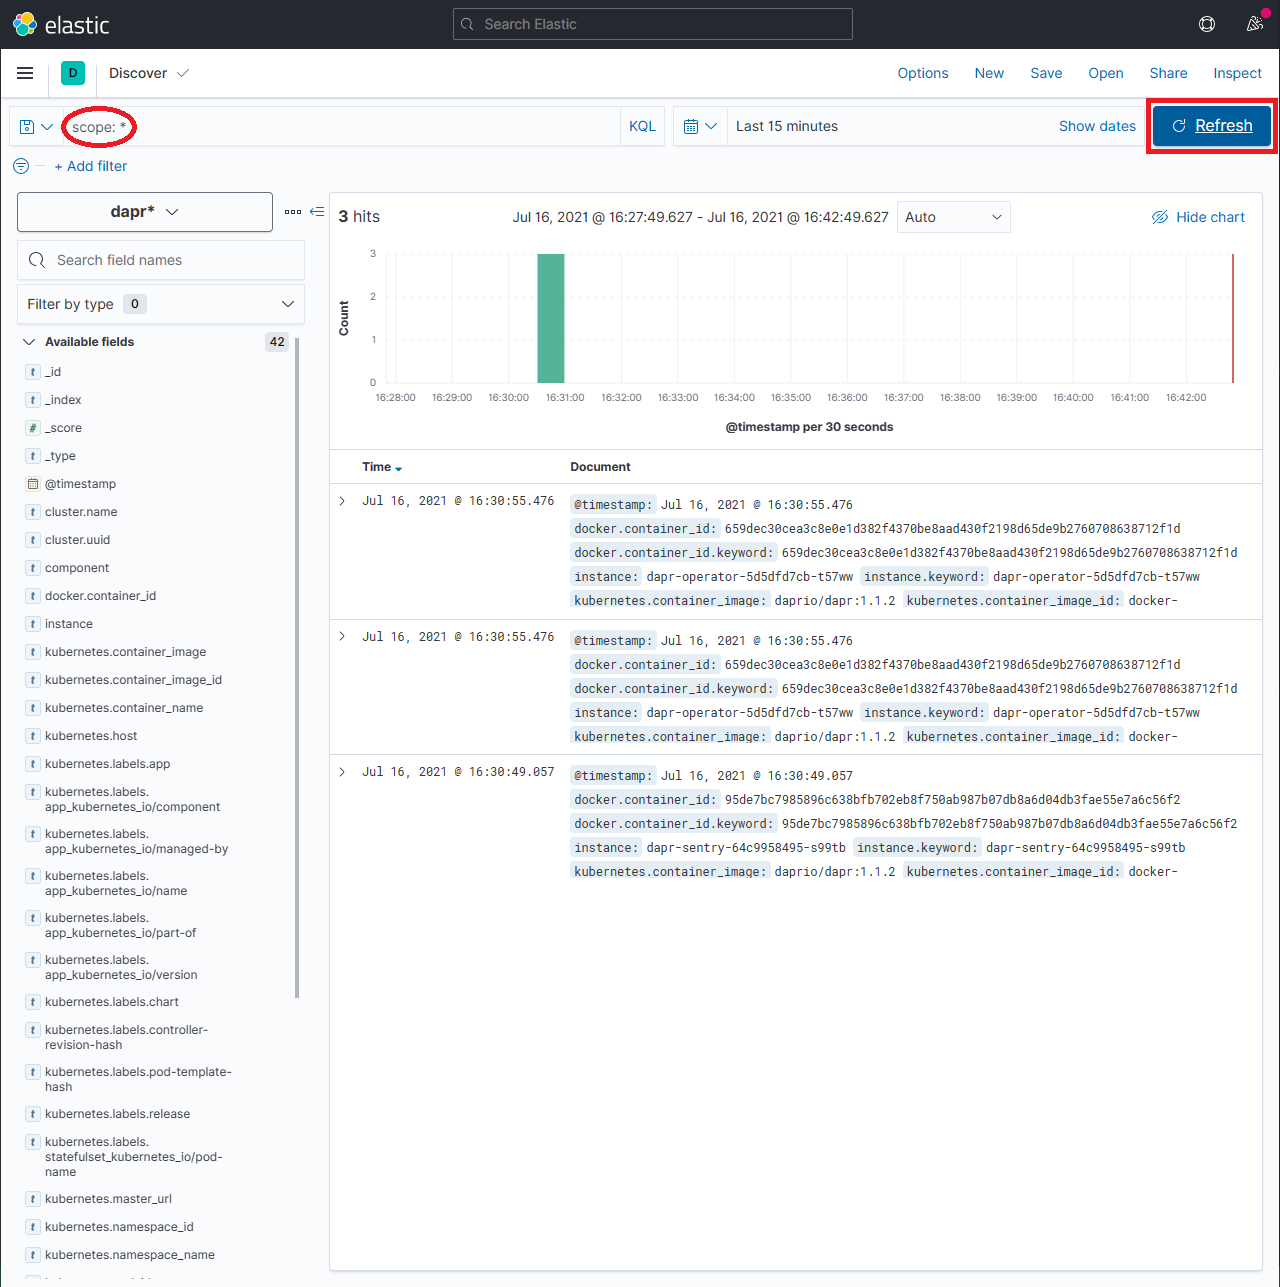
References
1.3.3 - How-To: Set-up New Relic for Dapr logging
Prerequisites
- Perpetually free New Relic account, 100 GB/month of free data ingest, 1 free full access user, unlimited free basic users
Background
New Relic offers a Fluent Bit output plugin to easily forward your logs to New Relic Logs. This plugin is also provided in a standalone Docker image that can be installed in a Kubernetes cluster in the form of a DaemonSet, which we refer as the Kubernetes plugin.
This document explains how to install it in your cluster, either using a Helm chart (recommended), or manually by applying Kubernetes manifests.
Installation
Install using the Helm chart (recommended)
Install Helm following the official instructions.
Add the New Relic official Helm chart repository following these instructions
Run the following command to install the New Relic Logging Kubernetes plugin via Helm, replacing the placeholder value YOUR_LICENSE_KEY with your New Relic license key:
Helm 3
helm install newrelic-logging newrelic/newrelic-logging --set licenseKey=YOUR_LICENSE_KEYHelm 2
helm install newrelic/newrelic-logging --name newrelic-logging --set licenseKey=YOUR_LICENSE_KEY
For EU users, add `–set endpoint=https://log-api.eu.newrelic.com/log/v1 to any of the helm install commands above.
By default, tailing is set to /var/log/containers/*.log. To change this setting, provide your preferred path by adding –set fluentBit.path=DESIRED_PATH to any of the helm install commands above.
Install the Kubernetes manifest
Download the following 3 manifest files into your current working directory:
curl https://raw.githubusercontent.com/newrelic/helm-charts/master/charts/newrelic-logging/k8s/fluent-conf.yml > fluent-conf.yml
curl https://raw.githubusercontent.com/newrelic/helm-charts/master/charts/newrelic-logging/k8s/new-relic-fluent-plugin.yml > new-relic-fluent-plugin.yml
curl https://raw.githubusercontent.com/newrelic/helm-charts/master/charts/newrelic-logging/k8s/rbac.yml > rbac.yml
In the downloaded new-relic-fluent-plugin.yml file, replace the placeholder value LICENSE_KEY with your New Relic license key.
For EU users, replace the ENDPOINT environment variable to https://log-api.eu.newrelic.com/log/v1.
Once the License key has been added, run the following command in your terminal or command-line interface:
kubectl apply -f .[OPTIONAL] You can configure how the plugin parses the data by editing the parsers.conf section in the fluent-conf.yml file. For more information, see Fluent Bit’s documentation on Parsers configuration.
By default, tailing is set to /var/log/containers/*.log. To change this setting, replace the default path with your preferred path in the new-relic-fluent-plugin.yml file.
View Logs
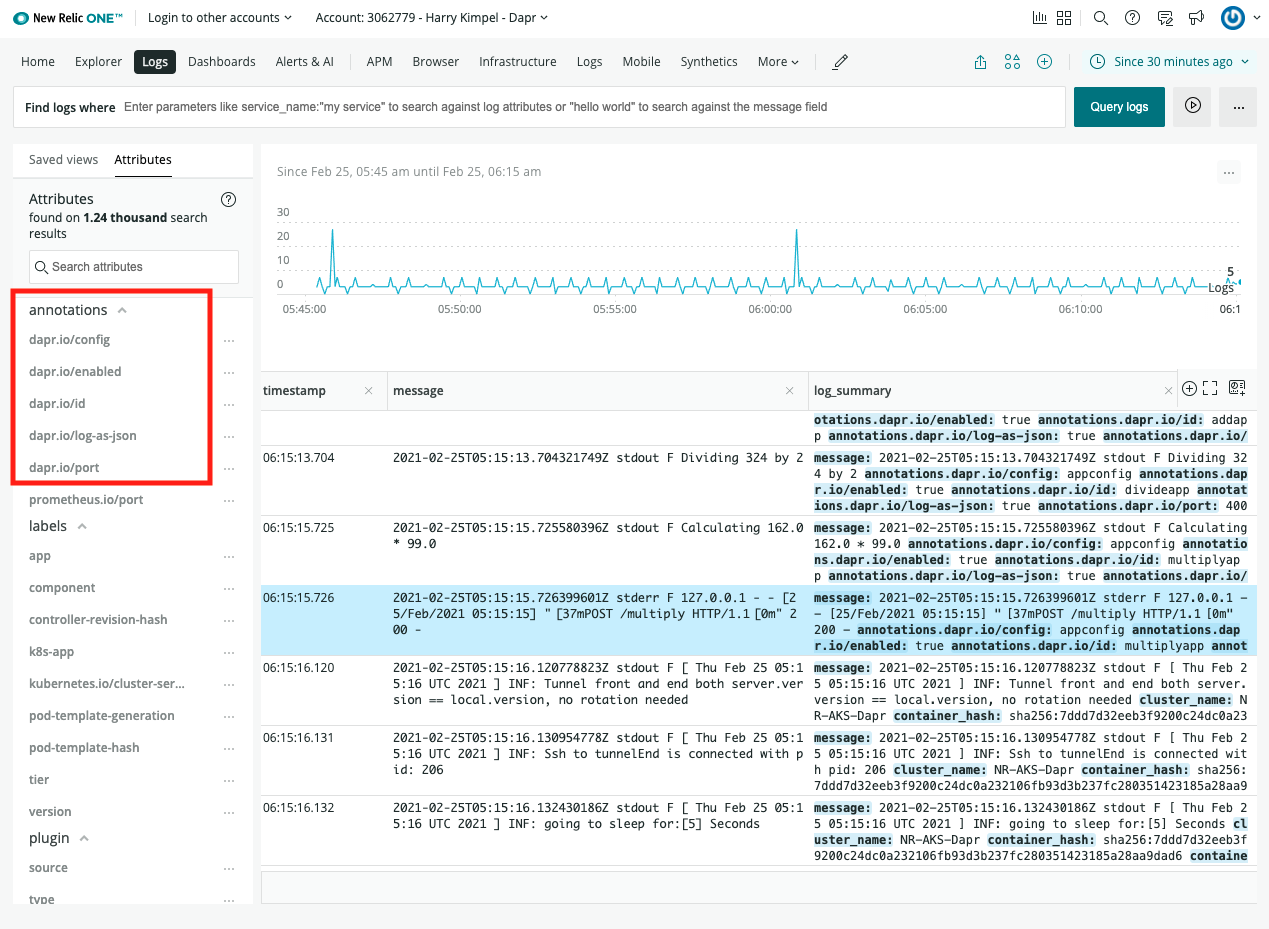
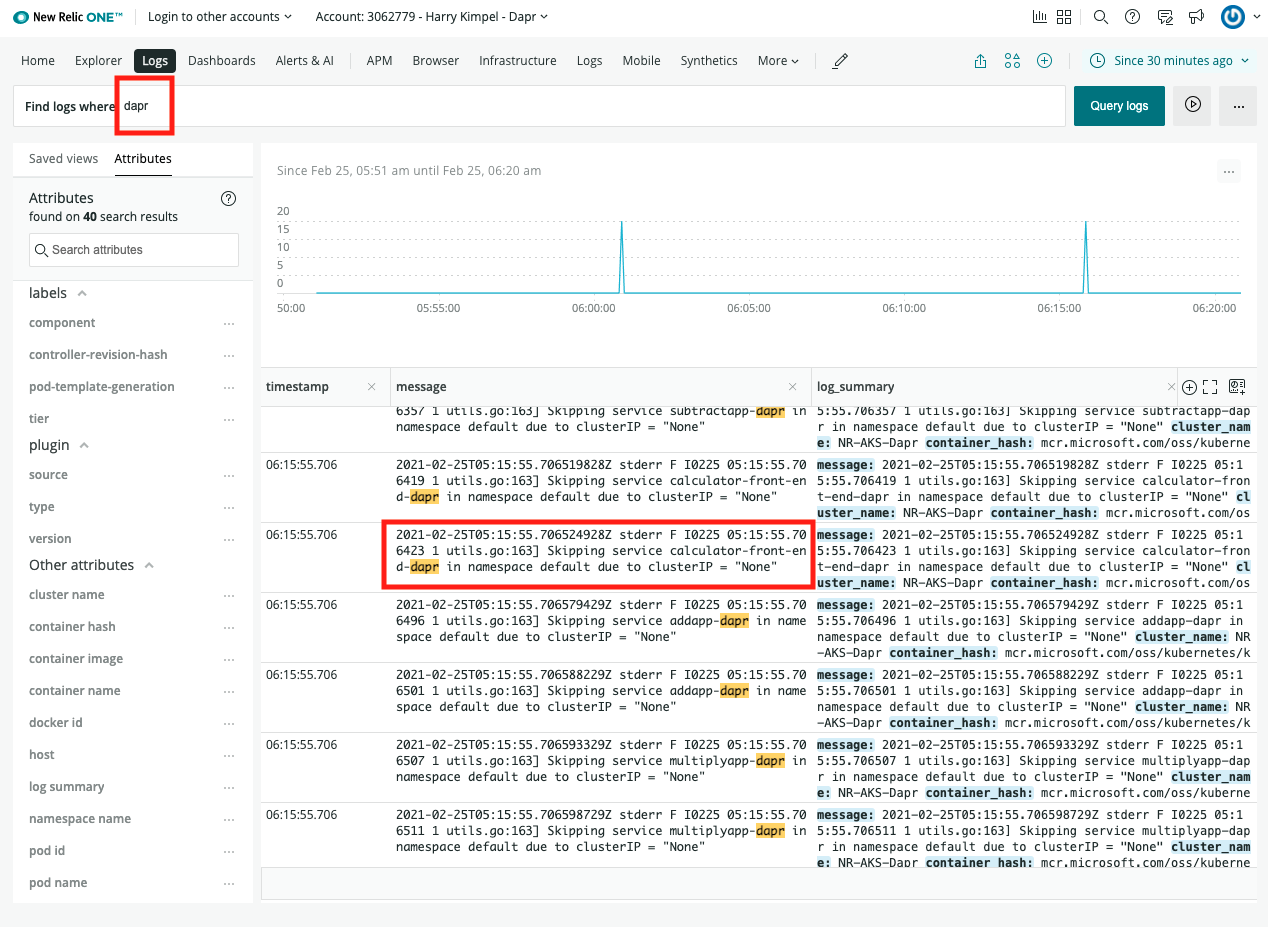
Related Links/References
2 - Hosting options for Dapr
2.1 - Run Dapr in self-hosted mode
2.1.1 - Overview of Dapr in self-hosted mode
Overview
Dapr can be configured to run in self-hosted mode on your local developer machine or on production VMs. Each running service has a Dapr runtime process (or sidecar) which is configured to use state stores, pub/sub, binding components and the other building blocks.
Initialization
Dapr can be initialized with Docker (default) or in slim-init mode. It can also be initialized and run in offline or airgap environments.
Note
You can also use Podman in place of Docker as container runtime. Please refer dapr init with Podman for more details. It can be useful in the scenarios where docker cannot be installed due to various networking constraints.The default Docker setup provides out of the box functionality with the following containers and configuration:
- A Redis container configured to serve as the default component for both state management and publish/subscribe.
- A Zipkin container for diagnostics and tracing.
- A default Dapr configuration and components installed in
$HOME/.dapr/(Mac/Linux) or%USERPROFILE%\.dapr\(Windows).
The dapr-placement service is responsible for managing the actor distribution scheme and key range settings. This service is not launched as a container and is only required if you are using Dapr actors. For more information on the actor Placement service read actor overview.
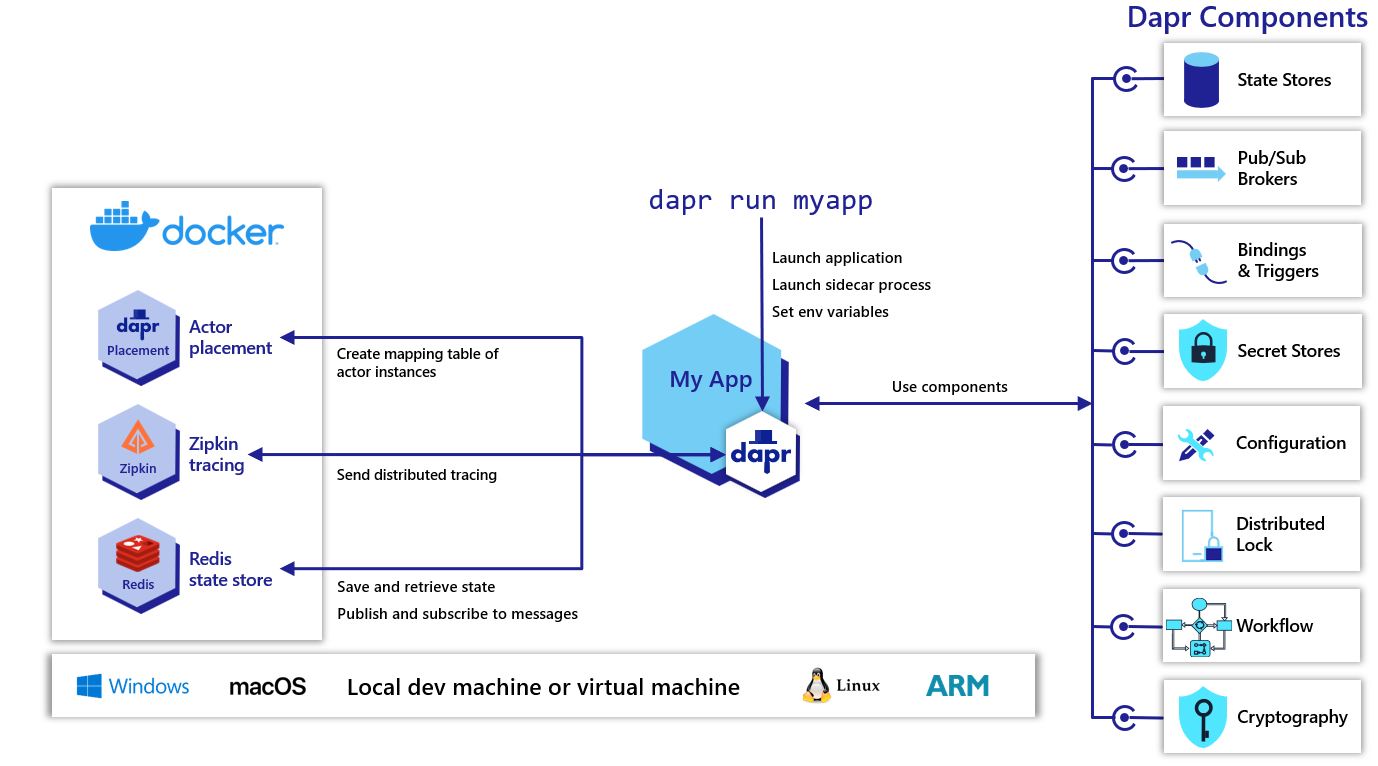
Launching applications with Dapr
You can use the dapr run CLI command to a Dapr sidecar process along with your application. Additional arguments and flags can be found here.
Name resolution
Dapr uses a name resolution component for service discovery within the service invocation building block. By default Dapr uses mDNS when in self-hosted mode.
If you are running Dapr on virtual machines or where mDNS is not available, then you can use the HashiCorp Consul component for name resolution.
2.1.2 - How-To: Run Dapr in self-hosted mode with Docker
This article provides guidance on running Dapr with Docker on a Windows/Linux/macOS machine or VM.
Prerequisites
- Dapr CLI
- Docker
- Docker-Compose (optional)
Initialize Dapr environment
To initialize the Dapr control plane containers and create a default configuration file, run:
dapr init
Run both app and sidecar as a process
The dapr run CLI command can be used to launch a Dapr sidecar along with your application:
dapr run --app-id myapp --app-port 5000 -- dotnet run
This command will launch both the daprd sidecar binary and run dotnet run, launching your application.
Run app as a process and sidecar as a Docker container
Alternately, if you are running Dapr in a Docker container and your app as a process on the host machine, then you need to configure Docker to use the host network so that Dapr and the app can share a localhost network interface.
Note
The host networking driver for Docker is only supported on Linux hosts.If you are running your Docker daemon on a Linux host, you can run the following to launch Dapr:
docker run --net="host" --mount type=bind,source="$(pwd)"/components,target=/components daprio/daprd:edge ./daprd -app-id <my-app-id> -app-port <my-app-port>
Then you can run your app on the host and they should connect over the localhost network interface.
Run both app and Dapr in a single Docker container
For development purposes ONLY
It is not recommended to run both the Dapr runtime and an application inside the same container. However, it is possible to do so for local development scenarios.
In order to do this, you’ll need to write a Dockerfile that installs the Dapr runtime, Dapr CLI and your app code. You can then invoke both the Dapr runtime and your app code using the Dapr CLI.
Below is an example of a Dockerfile which achieves this:
FROM python:3.7.1
# Install dapr CLI
RUN wget -q https://raw.githubusercontent.com/dapr/cli/master/install/install.sh -O - | /bin/bash

# Install daprd
ARG DAPR_BUILD_DIR
COPY $DAPR_BUILD_DIR /opt/dapr
ENV PATH="/opt/dapr/:${PATH}"
RUN dapr init --slim

# Install your app
WORKDIR /app
COPY python .
RUN pip install requests
ENTRYPOINT ["dapr"]
CMD ["run", "--app-id", "nodeapp", "--app-port", "3000", "node", "app.js"]
Remember that if Dapr needs to communicate with other components i.e. Redis, these also need to be made accessible to it.
Run on a Docker network
If you have multiple instances of Dapr running in Docker containers and want them to be able to communicate with each other i.e. for service invocation, then you’ll need to create a shared Docker network and make sure those Dapr containers are attached to it.
You can create a simple Docker network using:
docker network create my-dapr-network
When running your Docker containers, you can attach them to the network using:
docker run --net=my-dapr-network ...
Each container will receive a unique IP on that network and be able to communicate with other containers on that network.
Run using Docker-Compose
Docker Compose can be used to define multi-container application configurations. If you wish to run multiple apps with Dapr sidecars locally without Kubernetes then it is recommended to use a Docker Compose definition (docker-compose.yml).
The syntax and tooling of Docker Compose is outside the scope of this article, however, it is recommended you refer to the official Docker documentation for further details.
In order to run your applications using Dapr and Docker Compose you’ll need to define the sidecar pattern in your docker-compose.yml. For example:
version: '3'
services:
  nodeapp:
    build: ./node
    ports:
      - "50001:50001" # Dapr instances communicate over gRPC so we need to expose the gRPC port
    depends_on:
      - redis
      - placement
    networks:
      - hello-dapr
  nodeapp-dapr:
    image: "daprio/daprd:edge"
    command: [
      "./daprd",
     "--app-id", "nodeapp",
     "--app-port", "3000",
     "--placement-host-address", "placement:50006", # Dapr's placement service can be reach via the docker DNS entry
     "--scheduler-host-address", "scheduler:50007", # Dapr's scheduler service can be reach via the docker DNS entry
     "--resources-path", "./components"
     ]
    volumes:
        - "./components/:/components" # Mount our components folder for the runtime to use. The mounted location must match the --resources-path argument.
    depends_on:
      - nodeapp
    network_mode: "service:nodeapp" # Attach the nodeapp-dapr service to the nodeapp network namespace

  ... # Deploy other daprized services and components (i.e. Redis)

  placement:
    image: "daprio/placement"
    command: ["./placement", "--port", "50006"]
    ports:
      - "50006:50006"

  scheduler:
    image: "daprio/scheduler"
    command: ["./scheduler", "--port", "50007", "--etcd-data-dir", "/data"]
    ports:
      - "50007:50007"
    user: root
    volumes:
    - "./dapr-etcd-data/:/data"

  networks:
    hello-dapr: null
For those running the Docker daemon on a Linux host, you can also use
network_mode: hostto leverage host networking if needed.
To further learn how to run Dapr with Docker Compose, see the Docker-Compose Sample.
The above example also includes a scheduler definition that uses a non-persistent data store for testing and development purposes.
Run on Kubernetes
If your deployment target is Kubernetes please use Dapr’s first-class integration. Refer to the Dapr on Kubernetes docs.
Name resolution
Dapr by default uses mDNS as the name resolution component in self-hosted mode for service invocation. If you are running Dapr on virtual machines or where mDNS is not available, then you can use the HashiCorp Consul component for name resolution.
Docker images
Dapr provides a number of prebuilt Docker images for different components, you should select the relevant image for your desired binary, architecture, and tag/version.
Images
There are published Docker images for each of the Dapr components available on Docker Hub.
- daprio/dapr (contains all Dapr binaries)
- daprio/daprd
- daprio/placement
- daprio/sentry
- daprio/dapr-dev
Tags
Linux/amd64
latest: The latest release version, ONLY use for development purposes.edge: The latest edge build (master).major.minor.patch: A release version.major.minor.patch-rc.iteration: A release candidate.
Linux/arm/v7
latest-arm: The latest release version for ARM, ONLY use for development purposes.edge-arm: The latest edge build for ARM (master).major.minor.patch-arm: A release version for ARM.major.minor.patch-rc.iteration-arm: A release candidate for ARM.
2.1.3 - How-To: Run Dapr in self-hosted mode with Podman
This article provides guidance on running Dapr with Podman on a Windows/Linux/macOS machine or VM.
Prerequisites
Initialize Dapr environment
To initialize the Dapr control plane containers and create a default configuration file, run:
dapr init --container-runtime podman
Run both app and sidecar as a process
The dapr run CLI command can be used to launch a Dapr sidecar along with your application:
dapr run --app-id myapp --app-port 5000 -- dotnet run
This command launches both the daprd sidecar and your application.
Run app as a process and sidecar as a Docker container
Alternately, if you are running Dapr in a Docker container and your app as a process on the host machine, then you need to configure Podman to use the host network so that Dapr and the app can share a localhost network interface.
If you are running Podman on Linux host then you can run the following to launch Dapr:
podman run --network="host" --mount type=bind,source="$(pwd)"/components,target=/components daprio/daprd:edge ./daprd -app-id <my-app-id> -app-port <my-app-port>
Then you can run your app on the host and they should connect over the localhost network interface.
Uninstall Dapr environment
To uninstall Dapr completely, run:
dapr uninstall --container-runtime podman --all
2.1.4 - How-To: Run Dapr in an offline or airgap environment
Overview
By default, Dapr initialization downloads binaries and pulls images from the network to setup the development environment. However, Dapr also supports offline or airgap installation using pre-downloaded artifacts, either with a Docker or slim environment. The artifacts for each Dapr release are built into a Dapr Installer Bundle which can be downloaded. By using this installer bundle with the Dapr CLI init command, you can install Dapr into environments that do not have any network access.
Setup
Before airgap initialization, it is required to download a Dapr Installer Bundle beforehand, containing the CLI, runtime and dashboard packaged together. This eliminates the need to download binaries as well as Docker images when initializing Dapr locally.
Download the Dapr Installer Bundle for the specific release version. For example, daprbundle_linux_amd64.tar.gz, daprbundle_windows_amd64.zip.
Unpack it.
To install Dapr CLI copy the
daprbundle/dapr (dapr.exe for Windows)binary to the desired location:- For Linux/MacOS -
/usr/local/bin - For Windows, create a directory and add this to your System PATH. For example create a directory called
c:\daprand add this directory to your path, by editing your system environment variable.
Note: If Dapr CLI is not moved to the desired location, you can use local
daprCLI binary in the bundle. The steps above is to move it to the usual location and add it to the path.- For Linux/MacOS -
Initialize Dapr environment
Dapr can be initialized in an airgap environment with or without Docker containers.
Initialize Dapr with Docker
(Prerequisite: Docker is available in the environment)
Move to the bundle directory and run the following command:
dapr init --from-dir .
For linux users, if you run your Docker cmds with sudo, you need to use “sudo dapr init”
If you are not running the above cmd from the bundle directory, provide the full path to bundle directory as input. For example, assuming the bundle directory path is $HOME/daprbundle, run
dapr init --from-dir $HOME/daprbundleto have the same behavior.
The output should look similar to the following:
  Making the jump to hyperspace...
ℹ️  Installing runtime version latest
↘  Extracting binaries and setting up components... Loaded image: daprio/dapr:$version
✅  Extracting binaries and setting up components...
✅  Extracted binaries and completed components set up.
ℹ️  daprd binary has been installed to $HOME/.dapr/bin.
ℹ️  dapr_placement container is running.
ℹ️  Use `docker ps` to check running containers.
✅  Success! Dapr is up and running. To get started, go here: https://aka.ms/dapr-getting-started
Note: To emulate online Dapr initialization using
dapr init, you can also run Redis and Zipkin containers as follows:
1. docker run --name "dapr_zipkin" --restart always -d -p 9411:9411 openzipkin/zipkin
2. docker run --name "dapr_redis" --restart always -d -p 6379:6379 redislabs/rejson
Initialize Dapr without Docker
Alternatively to have the CLI not install any default configuration files or run any Docker containers, use the --slim flag with the init command. Only the Dapr binaries will be installed.
dapr init --slim --from-dir .
The output should look similar to the following:
⌛  Making the jump to hyperspace...
ℹ️  Installing runtime version latest
↙  Extracting binaries and setting up components...
✅  Extracting binaries and setting up components...
✅  Extracted binaries and completed components set up.
ℹ️  daprd binary has been installed to $HOME.dapr/bin.
ℹ️  placement binary has been installed to $HOME/.dapr/bin.
✅  Success! Dapr is up and running. To get started, go here: https://aka.ms/dapr-getting-started
2.1.5 - How-To: Run Dapr in self-hosted mode without Docker
Prerequisites
Initialize Dapr without containers
The Dapr CLI provides an option to initialize Dapr using slim init, without the default creation of a development environment with a dependency on Docker. To initialize Dapr with slim init, after installing the Dapr CLI, use the following command:
dapr init --slim
Two different binaries are installed:
daprdplacement
The placement binary is needed to enable actors in a Dapr self-hosted installation.
In slim init mode, no default components (such as Redis) are installed for state management or pub/sub. This means that, aside from service invocation, no other building block functionality is available “out-of-the-box” on install. Instead, you can set up your own environment and custom components.
Actor-based service invocation is possible if a state store is configured, as explained in the following sections.
Perform service invocation
See the Hello Dapr slim sample for an example on how to perform service invocation in slim init mode.
Enable state management or pub/sub
See documentation around configuring Redis in self-hosted mode without Docker to enable a local state store or pub/sub broker for messaging.
Enable actors
To enable actor placement:
- Run the placement service locally.
- Enable a transactional state store that supports ETags to use actors. For example, Redis configured in self-hosted mode.
By default, the placement binary is installed in:
- For Linux/MacOS:
/$HOME/.dapr/bin - For Windows:
%USERPROFILE%\.dapr\bin
$ $HOME/.dapr/bin/placement

INFO[0000] starting Dapr Placement Service -- version 1.0.0-rc.1 -- commit 13ae49d  instance=Nicoletaz-L10.redmond.corp.microsoft.com scope=dapr.placement type=log ver=1.0.0-rc.1
INFO[0000] log level set to: info                        instance=Nicoletaz-L10.redmond.corp.microsoft.com scope=dapr.placement type=log ver=1.0.0-rc.1
INFO[0000] metrics server started on :9090/              instance=Nicoletaz-L10.redmond.corp.microsoft.com scope=dapr.metrics type=log ver=1.0.0-rc.1
INFO[0000] Raft server is starting on 127.0.0.1:8201...  instance=Nicoletaz-L10.redmond.corp.microsoft.com scope=dapr.placement.raft type=log ver=1.0.0-rc.1
INFO[0000] placement service started on port 50005       instance=Nicoletaz-L10.redmond.corp.microsoft.com scope=dapr.placement type=log ver=1.0.0-rc.1
INFO[0000] Healthz server is listening on :8080          instance=Nicoletaz-L10.redmond.corp.microsoft.com scope=dapr.placement type=log ver=1.0.0-rc.1
INFO[0001] cluster leadership acquired                   instance=Nicoletaz-L10.redmond.corp.microsoft.com scope=dapr.placement type=log ver=1.0.0-rc.1
INFO[0001] leader is established.                        instance=Nicoletaz-L10.redmond.corp.microsoft.com scope=dapr.placement type=log ver=1.0.0-rc.1
When running standalone placement on Windows, specify port 6050:
%USERPROFILE%/.dapr/bin/placement.exe -port 6050

time="2022-10-17T14:56:55.4055836-05:00" level=info msg="starting Dapr Placement Service -- version 1.9.0 -- commit fdce5f1f1b76012291c888113169aee845f25ef8" instance=LAPTOP-OMK50S19 scope=dapr.placement type=log ver=1.9.0
time="2022-10-17T14:56:55.4066226-05:00" level=info msg="log level set to: info" instance=LAPTOP-OMK50S19 scope=dapr.placement type=log ver=1.9.0
time="2022-10-17T14:56:55.4067306-05:00" level=info msg="metrics server started on :9090/" instance=LAPTOP-OMK50S19 scope=dapr.metrics type=log ver=1.9.0
time="2022-10-17T14:56:55.4077529-05:00" level=info msg="Raft server is starting on 127.0.0.1:8201..." instance=LAPTOP-OMK50S19 scope=dapr.placement.raft type=log ver=1.9.0
time="2022-10-17T14:56:55.4077529-05:00" level=info msg="placement service started on port 6050" instance=LAPTOP-OMK50S19 scope=dapr.placement type=log ver=1.9.0
time="2022-10-17T14:56:55.4082772-05:00" level=info msg="Healthz server is listening on :8080" instance=LAPTOP-OMK50S19 scope=dapr.placement type=log ver=1.9.0
time="2022-10-17T14:56:56.8232286-05:00" level=info msg="cluster leadership acquired" instance=LAPTOP-OMK50S19 scope=dapr.placement type=log ver=1.9.0
time="2022-10-17T14:56:56.8232286-05:00" level=info msg="leader is established." instance=LAPTOP-OMK50S19 scope=dapr.placement type=log ver=1.9.0
Now, to run an application with actors enabled, you can follow the sample example created for:
Update the state store configuration files to match the Redis host and password with your setup.
Enable it as a actor state store by making the metadata piece similar to the sample Java Redis component definition.
  - name: actorStateStore
    value: "true"
Clean up
When finished, remove the binaries by following Uninstall Dapr in a self-hosted environment to remove the binaries.
Next steps
- Run Dapr with Podman, using the default Docker, or in an airgap environment
- Upgrade Dapr in self-hosted mode
2.1.6 - How-to: Persist Scheduler Jobs
The Scheduler service is responsible for writing jobs to its embedded database and scheduling them for execution.
By default, the Scheduler service database writes this data to the local volume dapr_scheduler, meaning that this data is persisted across restarts.
The host file location for this local volume is typically located at either /var/lib/docker/volumes/dapr_scheduler/_data or ~/.local/share/containers/storage/volumes/dapr_scheduler/_data, depending on your container runtime.
Note that if you are using Docker Desktop, this volume is located in the Docker Desktop VM’s filesystem, which can be accessed using:
docker run -it --privileged --pid=host debian nsenter -t 1 -m -u -n -i sh
The Scheduler persistent volume can be modified with a custom volume that is pre-existing, or is created by Dapr.
Note
By defaultdapr init creates a local persistent volume on your drive called dapr_scheduler. If Dapr is already installed, the control plane needs to be completely uninstalled in order for the Scheduler container to be recreated with the new persistent volume.dapr init --scheduler-volume my-scheduler-volume
2.1.7 - Steps to upgrade Dapr in a self-hosted environment
Uninstall the current Dapr deployment:
Note
This will remove the default$HOME/.daprdirectory, binaries and all containers (dapr_redis, dapr_placement and dapr_zipkin). Linux users need to runsudoif docker command needs sudo.dapr uninstall --allDownload and install the latest CLI by visiting this guide.
Initialize the Dapr runtime:
dapr initEnsure you are using the latest version of Dapr (v1.15.5)) with:
$ dapr --version

CLI version: 1.15
Runtime version: 1.15
2.1.8 - Uninstall Dapr in a self-hosted environment
The following CLI command removes the Dapr sidecar binaries and the placement container:
dapr uninstall
The above command will not remove the Redis or Zipkin containers that were installed during dapr init by default, just in case you were using them for other purposes. To remove Redis, Zipkin, Actor Placement container, as well as the default Dapr directory located at $HOME/.dapr or %USERPROFILE%\.dapr\, run:
dapr uninstall --all
Note
For Linux/MacOS users, if you run your docker cmds with sudo or the install path is/usr/local/bin(default install path), you need to use sudo dapr uninstall to remove dapr binaries and/or the containers.2.2 - Deploy and run Dapr in Kubernetes mode
2.2.1 - Overview of Dapr on Kubernetes
Dapr can be configured to run on any supported versions of Kubernetes. To achieve this, Dapr begins by deploying the following Kubernetes services, which provide first-class integration to make running applications with Dapr easy.
| Kubernetes services | Description |
|---|---|
dapr-operator | Manages component updates and Kubernetes services endpoints for Dapr (state stores, pub/subs, etc.) |
dapr-sidecar-injector | Injects Dapr into annotated deployment pods and adds the environment variables DAPR_HTTP_PORT and DAPR_GRPC_PORT to enable user-defined applications to easily communicate with Dapr without hard-coding Dapr port values. |
dapr-placement | Used for actors only. Creates mapping tables that map actor instances to pods |
dapr-sentry | Manages mTLS between services and acts as a certificate authority. For more information read the security overview |
dapr-scheduler | Provides distributed job scheduling capabilities used by the Jobs API, Workflow API, and Actor Reminders |
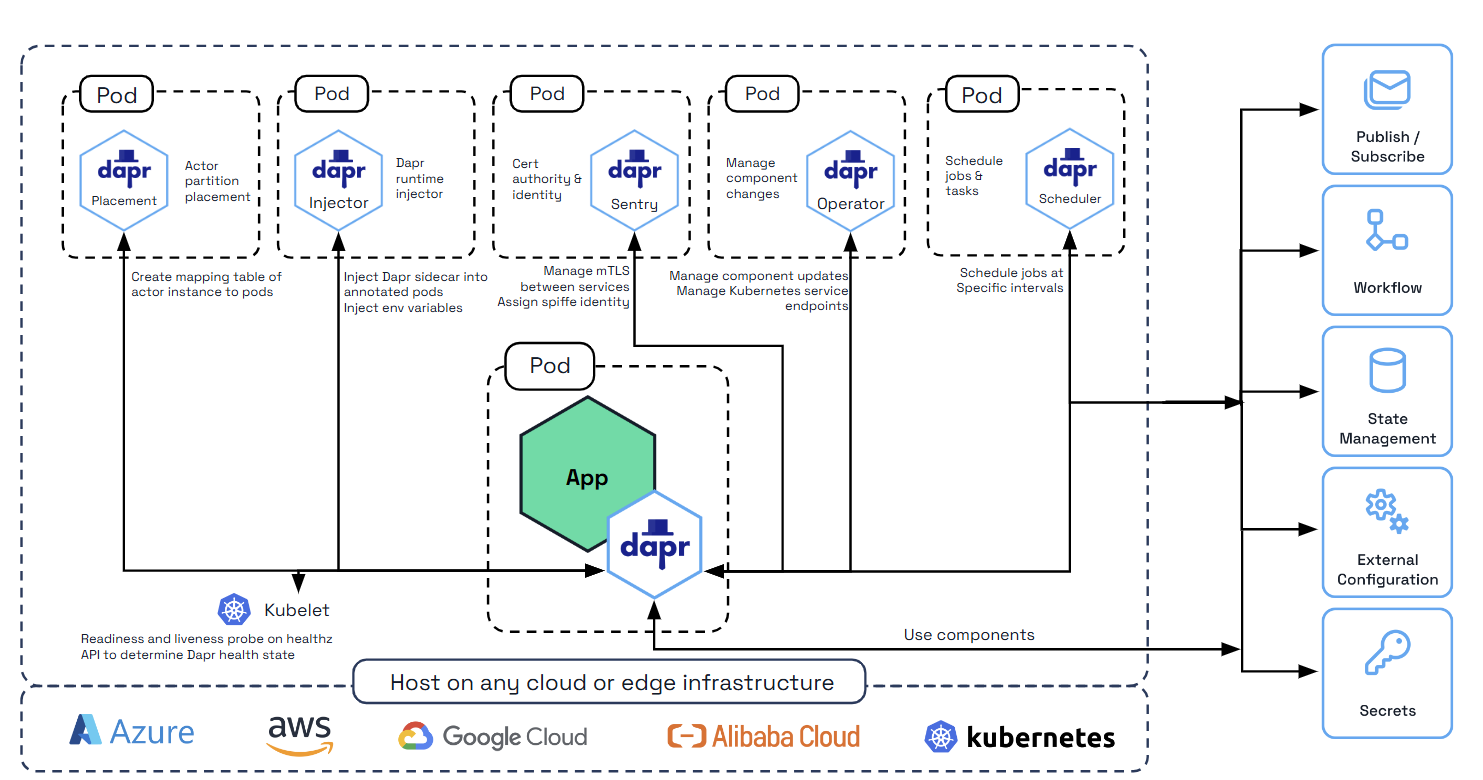
Supported versions
Dapr support for Kubernetes is aligned with Kubernetes Version Skew Policy.
Deploying Dapr to a Kubernetes cluster
Read Deploy Dapr on a Kubernetes cluster to learn how to deploy Dapr to your Kubernetes cluster.
Adding Dapr to a Kubernetes deployment
Deploying and running a Dapr-enabled application into your Kubernetes cluster is as simple as adding a few annotations to the pods schema. For example, in the following example, your Kubernetes pod is annotated to:
- Give your service an
idandportknown to Dapr - Turn on tracing through configuration
- Launch the Dapr sidecar container
  annotations:
    dapr.io/enabled: "true"
    dapr.io/app-id: "nodeapp"
    dapr.io/app-port: "3000"
    dapr.io/config: "tracing"
For more information, check Dapr annotations.
Pulling container images from private registries
Dapr works seamlessly with any user application container image, regardless of its origin. Simply initialize Dapr and add the Dapr annotations to your Kubernetes definition to add the Dapr sidecar.
The Dapr control plane and sidecar images come from the daprio Docker Hub container registry, which is a public registry.
For information about:
- Pulling your application images from a private registry, reference the official Kubernetes documentation.
- Using Azure Container Registry with Azure Kubernetes Service, reference the AKS documentation.
Tutorials
Work through the Hello Kubernetes tutorial to learn more about getting started with Dapr on your Kubernetes cluster.
Related links
2.2.2 - Kubernetes cluster setup
2.2.2.1 - Set up a Minikube cluster
Prerequisites
- Install:
- For Windows:
- Enable Virtualization in BIOS
- Install Hyper-V
Note
See the official Minikube documentation on drivers for details on supported drivers and how to install plugins.Start the Minikube cluster
If applicable for your project, set the default VM.
minikube config set vm-driver [driver_name]Start the cluster. If necessary, specify version 1.13.x or newer of Kubernetes with
--kubernetes-versionminikube start --cpus=4 --memory=4096Enable the Minikube dashboard and ingress add-ons.
# Enable dashboard
minikube addons enable dashboard

# Enable ingress
minikube addons enable ingress
Install Helm v3 (optional)
If you are using Helm, install the Helm v3 client.
Important
The latest Dapr Helm chart no longer supports Helm v2. Migrate from Helm v2 to Helm v3.Troubleshooting
The external IP address of load balancer is not shown from kubectl get svc.
In Minikube, EXTERNAL-IP in kubectl get svc shows <pending> state for your service. In this case, you can run minikube service [service_name] to open your service without external IP address.
$ kubectl get svc
NAME                        TYPE           CLUSTER-IP       EXTERNAL-IP   PORT(S)            AGE
...
calculator-front-end        LoadBalancer   10.103.98.37     <pending>     80:30534/TCP       25h
calculator-front-end-dapr   ClusterIP      10.107.128.226   <none>        80/TCP,50001/TCP   25h
...

$ minikube service calculator-front-end
|-----------|----------------------|-------------|---------------------------|
| NAMESPACE |         NAME         | TARGET PORT |            URL            |
|-----------|----------------------|-------------|---------------------------|
| default   | calculator-front-end |             | http://192.168.64.7:30534 |
|-----------|----------------------|-------------|---------------------------|
🎉  Opening kubernetes service  default/calculator-front-end in default browser...
Related links
2.2.2.2 - Set up a KiND cluster
Prerequisites
- Install:
- For Windows:
- Enable Virtualization in BIOS
- Install Hyper-V
Install and configure KiND
Refer to the KiND documentation to install.
If you are using Docker Desktop, verify that you have the recommended settings.
Configure and create the KiND cluster
Create a file named
kind-cluster-config.yaml, and paste the following:kind: Cluster apiVersion: kind.x-k8s.io/v1alpha4 nodes: - role: control-plane kubeadmConfigPatches: - | kind: InitConfiguration nodeRegistration: kubeletExtraArgs: node-labels: "ingress-ready=true" extraPortMappings: - containerPort: 80 hostPort: 8081 protocol: TCP - containerPort: 443 hostPort: 8443 protocol: TCP - role: worker - role: workerThis cluster configuration:
- Requests KiND to spin up a Kubernetes cluster comprised of a control plane and two worker nodes.
- Allows for future setup of ingresses.
- Exposes container ports to the host machine.
Run the
kind create clustercommand, providing the cluster configuration file:kind create cluster --config kind-cluster-config.yamlExpected output
Creating cluster "kind" ...
 ✓ Ensuring node image (kindest/node:v1.21.1) 🖼
 ✓ Preparing nodes 📦 📦 📦
 ✓ Writing configuration 📜
 ✓ Starting control-plane 🕹️
 ✓ Installing CNI 🔌
 ✓ Installing StorageClass 💾
 ✓ Joining worker nodes 🚜
Set kubectl context to "kind-kind"
You can now use your cluster with:

kubectl cluster-info --context kind-kind

Thanks for using kind! 😊
Initialize and run Dapr
Initialize Dapr in Kubernetes.
dapr init --kubernetesOnce Dapr finishes initializing, you can use its core components on the cluster.
Verify the status of the Dapr components:
dapr status -kExpected output
  NAME                   NAMESPACE    HEALTHY  STATUS   REPLICAS  VERSION  AGE  CREATED
  dapr-sentry            dapr-system  True     Running  1         1.5.1    53s  2021-12-10 09:27.17
  dapr-operator          dapr-system  True     Running  1         1.5.1    53s  2021-12-10 09:27.17
  dapr-sidecar-injector  dapr-system  True     Running  1         1.5.1    53s  2021-12-10 09:27.17
  dapr-dashboard         dapr-system  True     Running  1         0.9.0    53s  2021-12-10 09:27.17
  dapr-placement-server  dapr-system  True     Running  1         1.5.1    52s  2021-12-10 09:27.18
Forward a port to Dapr dashboard:
dapr dashboard -k -p 9999Navigate to
http://localhost:9999to validate a successful setup.
Install metrics-server on the Kind Kubernetes Cluster
Get metrics-server manifests
wget https://github.com/kubernetes-sigs/metrics-server/releases/latest/download/components.yamlAdd insecure TLS parameter to the components.yaml file
metadata:
   labels:
     k8s-app: metrics-server
 spec:
   containers:
   - args:
     - --cert-dir=/tmp
     - --secure-port=4443
     - --kubelet-preferred-address-types=InternalIP,ExternalIP,Hostname
     - --kubelet-use-node-status-port
     - --kubelet-insecure-tls   <==== Add this
     - --metric-resolution=15s
     image: k8s.gcr.io/metrics-server/metrics-server:v0.6.2
     imagePullPolicy: IfNotPresent
     livenessProbe:
       failureThreshold: 3
       httpGet:
         path: /livez
Apply modified manifest
kubectl apply -f components.yaml
Related links
2.2.2.3 - Set up an Azure Kubernetes Service (AKS) cluster
This guide walks you through installing an Azure Kubernetes Service (AKS) cluster. If you need more information, refer to Quickstart: Deploy an AKS cluster using the Azure CLI
Prerequisites
Deploy an AKS cluster
In the terminal, log into Azure.
az loginSet your default subscription:
az account set -s [your_subscription_id]Create a resource group.
az group create --name [your_resource_group] --location [region]Create an AKS cluster. To use a specific version of Kubernetes, use
--kubernetes-version(1.13.x or newer version required).az aks create --resource-group [your_resource_group] --name [your_aks_cluster_name] --location [region] --node-count 2 --enable-app-routing --generate-ssh-keysGet the access credentials for the AKS cluster.
az aks get-credentials -n [your_aks_cluster_name] -g [your_resource_group]
AKS Edge Essentials
To create a single-machine K8s/K3s Linux-only cluster using Azure Kubernetes Service (AKS) Edge Essentials, you can follow the quickstart guide available at AKS Edge Essentials quickstart guide.
Note
AKS Edge Essentials does not come with a default storage class, which may cause issues when deploying Dapr. To avoid this, make sure to enable the local-path-provisioner storage class on the cluster before deploying Dapr. If you need more information, refer to Local Path Provisioner on AKS EE.Related links
2.2.2.4 - Set up a Google Kubernetes Engine (GKE) cluster
Prerequisites
- Install:
Create a new cluster
Create a GKE cluster by running the following:
$ gcloud services enable container.googleapis.com && \
  gcloud container clusters create $CLUSTER_NAME \
  --zone $ZONE \
  --project $PROJECT_ID
For more options:
- Refer to the Google Cloud SDK docs.
- Create a cluster through the Cloud Console for a more interactive experience.
Sidecar injection for private GKE clusters
Sidecar injection for private clusters requires extra steps.
In private GKE clusters, an automatically created firewall rule for master access doesn’t open port 4000, which Dapr needs for sidecar injection.
Review the relevant firewall rule:
$ gcloud compute firewall-rules list --filter="name~gke-${CLUSTER_NAME}-[0-9a-z]*-master"
Replace the existing rule and allow Kubernetes master access to port 4000:
$ gcloud compute firewall-rules update <firewall-rule-name> --allow tcp:10250,tcp:443,tcp:4000
Retrieve your credentials for kubectl
Run the following command to retrieve your credentials:
$ gcloud container clusters get-credentials $CLUSTER_NAME \
    --zone $ZONE \
    --project $PROJECT_ID
Install Helm v3 (optional)
If you are using Helm, install the Helm v3 client.
Important
The latest Dapr Helm chart no longer supports Helm v2. Migrate from Helm v2 to Helm v3.Troubleshooting
Kubernetes dashboard permissions
Let’s say you receive an error message similar to the following:
configmaps is forbidden: User "system:serviceaccount:kube-system:kubernetes-dashboard" cannot list configmaps in the namespace "default"
Execute this command:
kubectl create clusterrolebinding kubernetes-dashboard -n kube-system --clusterrole=cluster-admin --serviceaccount=kube-system:kubernetes-dashboard
Related links
2.2.2.5 - Set up an Elastic Kubernetes Service (EKS) cluster
This guide walks you through installing an Elastic Kubernetes Service (EKS) cluster. If you need more information, refer to Create an Amazon EKS cluster
Prerequisites
Deploy an EKS cluster
In the terminal, log into AWS.
aws configureCreate a new file called
cluster-config.yamland add the content below to it, replacing[your_cluster_name],[your_cluster_region], and[your_k8s_version]with the appropriate values:apiVersion: eksctl.io/v1alpha5 kind: ClusterConfig metadata: name: [your_cluster_name] region: [your_cluster_region] version: [your_k8s_version] tags: karpenter.sh/discovery: [your_cluster_name] iam: withOIDC: true managedNodeGroups: - name: mng-od-4vcpu-8gb desiredCapacity: 2 minSize: 1 maxSize: 5 instanceType: c5.xlarge privateNetworking: true addons: - name: vpc-cni attachPolicyARNs: - arn:aws:iam::aws:policy/AmazonEKS_CNI_Policy - name: coredns version: latest - name: kube-proxy version: latest - name: aws-ebs-csi-driver wellKnownPolicies: ebsCSIController: trueCreate the cluster by running the following command:
eksctl create cluster -f cluster-config.yamlVerify the kubectl context:
kubectl config current-context
Add Dapr requirements for sidecar access and default storage class:
Update the security group rule to allow the EKS cluster to communicate with the Dapr Sidecar by creating an inbound rule for port 4000.
aws ec2 authorize-security-group-ingress --region [your_aws_region] \
--group-id [your_security_group] \
--protocol tcp \
--port 4000 \
--source-group [your_security_group]
Add a default storage class if you don’t have one:
kubectl patch storageclass gp2 -p '{"metadata": {"annotations":{"storageclass.kubernetes.io/is-default-class":"true"}}}'
Install Dapr
Install Dapr on your cluster by running:
dapr init -k
You should see the following response:
⌛  Making the jump to hyperspace...
ℹ️  Note: To install Dapr using Helm, see here: https://docs.dapr.io/getting-started/install-dapr-kubernetes/#install-with-helm-advanced

ℹ️  Container images will be pulled from Docker Hub
✅  Deploying the Dapr control plane with latest version to your cluster...
✅  Deploying the Dapr dashboard with latest version to your cluster...
✅  Success! Dapr has been installed to namespace dapr-system. To verify, run `dapr status -k' in your terminal. To get started, go here: https://docs.dapr.io/getting-started
Troubleshooting
Access permissions
If you face any access permissions, make sure you are using the same AWS profile that was used to create the cluster. If needed, update the kubectl configuration with the correct profile. More information here:
aws eks --region [your_aws_region] update-kubeconfig --name [your_eks_cluster_name] --profile [your_profile_name]
Related links
2.2.3 - Deploy Dapr on a Kubernetes cluster
When setting up Dapr on Kubernetes, you can use either the Dapr CLI or Helm.
Hybrid clusters
Both the Dapr CLI and the Dapr Helm chart automatically deploy with affinity for nodes with the labelkubernetes.io/os=linux. You can deploy Dapr to Windows nodes if your application requires it. For more information, see Deploying to a hybrid Linux/Windows Kubernetes cluster.Install with Dapr CLI
You can install Dapr on a Kubernetes cluster using the Dapr CLI.
Prerequisites
- Install:
- Create a Kubernetes cluster with Dapr. Here are some helpful links:
Installation options
You can install Dapr from an official Helm chart or a private chart, using a custom namespace, etc.
Install Dapr from an official Dapr Helm chart
The -k flag initializes Dapr on the Kubernetes cluster in your current context.
Verify the correct “target” cluster is set by checking
kubectl context (kubectl config get-contexts).- You can set a different context using
kubectl config use-context <CONTEXT>.
- You can set a different context using
Initialize Dapr on your cluster with the following command:
dapr init -kExpected output
⌛  Making the jump to hyperspace...

✅  Deploying the Dapr control plane to your cluster...
✅  Success! Dapr has been installed to namespace dapr-system. To verify, run "dapr status -k" in your terminal. To get started, go here: https://aka.ms/dapr-getting-started
Run the dashboard:
dapr dashboard -kIf you installed Dapr in a non-default namespace, run:
dapr dashboard -k -n <your-namespace>
Install Dapr from the offical Dapr Helm chart (with development flag)
Adding the --dev flag initializes Dapr on the Kubernetes cluster on your current context, with the addition of Redis and Zipkin deployments.
The steps are similar to installing from the Dapr Helm chart, except for appending the --dev flag to the init command:
dapr init -k --dev
Expected output:
⌛  Making the jump to hyperspace...
ℹ️  Note: To install Dapr using Helm, see here: https://docs.dapr.io/getting-started/install-dapr-kubernetes/#install-with-helm-advanced

ℹ️  Container images will be pulled from Docker Hub
✅  Deploying the Dapr control plane with latest version to your cluster...
✅  Deploying the Dapr dashboard with latest version to your cluster...
✅  Deploying the Dapr Redis with latest version to your cluster...
✅  Deploying the Dapr Zipkin with latest version to your cluster...
ℹ️  Applying "statestore" component to Kubernetes "default" namespace.
ℹ️  Applying "pubsub" component to Kubernetes "default" namespace.
ℹ️  Applying "appconfig" zipkin configuration to Kubernetes "default" namespace.
✅  Success! Dapr has been installed to namespace dapr-system. To verify, run `dapr status -k' in your terminal. To get started, go here: https://aka.ms/dapr-getting-started
After a short period of time (or using the --wait flag and specifying an amount of time to wait), you can check that the Redis and Zipkin components have been deployed to the cluster.
kubectl get pods --namespace default
Expected output:
NAME                              READY   STATUS    RESTARTS   AGE
dapr-dev-zipkin-bfb4b45bb-sttz7   1/1     Running   0          159m
dapr-dev-redis-master-0           1/1     Running   0          159m
dapr-dev-redis-replicas-0         1/1     Running   0          159m
dapr-dev-redis-replicas-1         1/1     Running   0          159m
dapr-dev-redis-replicas-2         1/1     Running   0          158m
Install Dapr from a private Dapr Helm chart
Installing Dapr from a private Helm chart can be helpful for when you:
- Need more granular control of the Dapr Helm chart
- Have a custom Dapr deployment
- Pull Helm charts from trusted registries that are managed and maintained by your organization
Set the following parameters to allow dapr init -k to install Dapr images from the configured Helm repository.
export DAPR_HELM_REPO_URL="https://helm.custom-domain.com/dapr/dapr"
export DAPR_HELM_REPO_USERNAME="username_xxx"
export DAPR_HELM_REPO_PASSWORD="passwd_xxx"
Install in high availability mode
You can run Dapr with three replicas of each control plane pod in the dapr-system namespace for production scenarios.
dapr init -k --enable-ha=true
Install in custom namespace
The default namespace when initializing Dapr is dapr-system. You can override this with the -n flag.
dapr init -k -n mynamespace
Disable mTLS
Dapr is initialized by default with mTLS. You can disable it with:
dapr init -k --enable-mtls=false
Wait for the installation to complete
You can wait for the installation to complete its deployment with the --wait flag. The default timeout is 300s (5 min), but can be customized with the --timeout flag.
dapr init -k --wait --timeout 600
Uninstall Dapr on Kubernetes with CLI
Run the following command on your local machine to uninstall Dapr on your cluster:
dapr uninstall -k
Install with Helm
You can install Dapr on Kubernetes using a Helm v3 chart.
❗Important: The latest Dapr Helm chart no longer supports Helm v2. Migrate from Helm v2 to Helm v3.
Prerequisites
- Install:
- Create a Kubernetes cluster with Dapr. Here are some helpful links:
Add and install Dapr Helm chart
Add the Helm repo and update:
// Add the official Dapr Helm chart.
helm repo add dapr https://dapr.github.io/helm-charts/
// Or also add a private Dapr Helm chart.
helm repo add dapr http://helm.custom-domain.com/dapr/dapr/ \
   --username=xxx --password=xxx
helm repo update
// See which chart versions are available
helm search repo dapr --devel --versions
Install the Dapr chart on your cluster in the
dapr-systemnamespace.helm upgrade --install dapr dapr/dapr \ --version=1.15 \ --namespace dapr-system \ --create-namespace \ --waitTo install in high availability mode:
helm upgrade --install dapr dapr/dapr \
--version=1.15 \
--namespace dapr-system \
--create-namespace \
--set global.ha.enabled=true \
--wait
To install in high availability mode and scale select services independently of global:
    helm upgrade --install dapr dapr/dapr \
 --version=1.15 \
 --namespace dapr-system \
 --create-namespace \
 --set global.ha.enabled=false \
 --set dapr_scheduler.ha=true \
 --set dapr_placement.ha=true \
 --wait
See Guidelines for production ready deployments on Kubernetes for more information on installing and upgrading Dapr using Helm.
(optional) Install the Dapr dashboard as part of the control plane
If you want to install the Dapr dashboard, use this Helm chart with the additional settings of your choice:
helm install dapr dapr/dapr-dashboard --namespace dapr-system
For example:
helm repo add dapr https://dapr.github.io/helm-charts/
helm repo update
kubectl create namespace dapr-system
# Install the Dapr dashboard
helm install dapr-dashboard dapr/dapr-dashboard --namespace dapr-system
Verify installation
Once the installation is complete, verify that the dapr-operator, dapr-placement, dapr-sidecar-injector, and dapr-sentry pods are running in the dapr-system namespace:
kubectl get pods --namespace dapr-system
NAME                                     READY     STATUS    RESTARTS   AGE
dapr-dashboard-7bd6cbf5bf-xglsr          1/1       Running   0          40s
dapr-operator-7bd6cbf5bf-xglsr           1/1       Running   0          40s
dapr-placement-7f8f76778f-6vhl2          1/1       Running   0          40s
dapr-sidecar-injector-8555576b6f-29cqm   1/1       Running   0          40s
dapr-sentry-9435776c7f-8f7yd             1/1       Running   0          40s
Uninstall Dapr on Kubernetes
helm uninstall dapr --namespace dapr-system
More information
- Read the Kubernetes productions guidelines for recommended Helm chart values for production setups
- More details on Dapr Helm charts
Use Mariner-based images
The default container images pulled on Kubernetes are based on distroless.
Alternatively, you can use Dapr container images based on Mariner 2 (minimal distroless). Mariner, officially known as CBL-Mariner, is a free and open-source Linux distribution and container base image maintained by Microsoft. For some Dapr users, leveraging container images based on Mariner can help you meet compliance requirements.
To use Mariner-based images for Dapr, you need to add -mariner to your Docker tags. For example, while ghcr.io/dapr/dapr:latest is the Docker image based on distroless, ghcr.io/dapr/dapr:latest-mariner is based on Mariner. Tags pinned to a specific version are also available, such as 1.15-mariner.
In the Dapr CLI, you can switch to using Mariner-based images with the --image-variant flag.
dapr init -k --image-variant mariner
With Kubernetes and Helm, you can use Mariner-based images by setting the global.tag option and adding -mariner. For example:
helm upgrade --install dapr dapr/dapr \
  --version=1.15 \
  --namespace dapr-system \
  --create-namespace \
  --set global.tag=1.15.5-mariner \
  --wait
Related links
2.2.4 - Upgrade Dapr on a Kubernetes cluster
You can upgrade the Dapr control plane on a Kubernetes cluster using either the Dapr CLI or Helm.
Note
Refer to the Dapr version policy for guidance on Dapr’s upgrade path.Upgrade using the Dapr CLI
You can upgrade Dapr using the Dapr CLI.
Prerequisites
Upgrade existing cluster to 1.15.5
dapr upgrade -k --runtime-version=1.15.5
You can provide all the available Helm chart configurations using the Dapr CLI.
Troubleshoot upgrading via the CLI
There is a known issue running upgrades on clusters that may have previously had a version prior to 1.0.0-rc.2 installed on a cluster.
While this issue is uncommon, a few upgrade path edge cases may leave an incompatible CustomResourceDefinition installed on your cluster. If this is your scenario, you may see an error message like the following:
❌  Failed to upgrade Dapr: Warning: kubectl apply should be used on resource created by either kubectl create --save-config or kubectl apply
The CustomResourceDefinition "configurations.dapr.io" is invalid: spec.preserveUnknownFields: Invalid value: true: must be false in order to use defaults in the schema
Solution
Run the following command to upgrade the
CustomResourceDefinitionto a compatible version:kubectl replace -f https://raw.githubusercontent.com/dapr/dapr/release-1.15/charts/dapr/crds/configuration.yamlProceed with the
dapr upgrade --runtime-version 1.15.5 -kcommand.
Upgrade using Helm
You can upgrade Dapr using a Helm v3 chart.
❗Important: The latest Dapr Helm chart no longer supports Helm v2. Migrate from Helm v2 to Helm v3.
Prerequisites
Upgrade existing cluster to 1.15.5
As of version 1.0.0 onwards, existing certificate values will automatically be reused when upgrading Dapr using Helm.
Note Helm does not handle upgrading resources, so you need to perform that manually. Resources are backward-compatible and should only be installed forward.
Upgrade Dapr to version 1.15.5:
kubectl replace -f https://raw.githubusercontent.com/dapr/dapr/v1.15.5/charts/dapr/crds/components.yaml
kubectl replace -f https://raw.githubusercontent.com/dapr/dapr/v1.15.5/charts/dapr/crds/configuration.yaml
kubectl replace -f https://raw.githubusercontent.com/dapr/dapr/v1.15.5/charts/dapr/crds/subscription.yaml
kubectl apply -f https://raw.githubusercontent.com/dapr/dapr/v1.15.5/charts/dapr/crds/resiliency.yaml
kubectl apply -f https://raw.githubusercontent.com/dapr/dapr/v1.15.5/charts/dapr/crds/httpendpoints.yaml
helm repo updatehelm upgrade dapr dapr/dapr --version 1.15.5 --namespace dapr-system --waitIf you’re using a values file, remember to add the
--valuesoption when running the upgrade command.*Ensure all pods are running:
kubectl get pods -n dapr-system -w

NAME                                     READY   STATUS    RESTARTS   AGE
dapr-dashboard-69f5c5c867-mqhg4          1/1     Running   0          42s
dapr-operator-5cdd6b7f9c-9sl7g           1/1     Running   0          41s
dapr-placement-server-0                  1/1     Running   0          41s
dapr-sentry-84565c747b-7bh8h             1/1     Running   0          35s
dapr-sidecar-injector-68f868668f-6xnbt   1/1     Running   0          41s
Restart your application deployments to update the Dapr runtime:
kubectl rollout restart deploy/<DEPLOYMENT-NAME>
Upgrade existing Dapr deployment to enable high availability mode
Enable high availability mode in an existing Dapr deployment with a few additional steps.
Related links
2.2.5 - Production guidelines on Kubernetes
Cluster and capacity requirements
Dapr support for Kubernetes is aligned with Kubernetes Version Skew Policy.
Use the following resource settings as a starting point. Requirements vary depending on cluster size, number of pods, and other factors. Perform individual testing to find the right values for your environment. In production, it’s recommended to not add memory limits to the Dapr control plane components to avoid OOMKilled pod statuses.
| Deployment | CPU | Memory |
|---|---|---|
| Operator | Limit: 1, Request: 100m | Request: 100Mi |
| Sidecar Injector | Limit: 1, Request: 100m | Request: 30Mi |
| Sentry | Limit: 1, Request: 100m | Request: 30Mi |
| Placement | Limit: 1, Request: 250m | Request: 75Mi |
Note
For more information, refer to the Kubernetes documentation on CPU and Memory resource units and their meaning.Helm
When installing Dapr using Helm, no default limit/request values are set. Each component has a resources option (for example, dapr_dashboard.resources), which you can use to tune the Dapr control plane to fit your environment.
The Helm chart readme has detailed information and examples.
For local/dev installations, you might want to skip configuring the resources options.
Optional components
The following Dapr control plane deployments are optional:
- Placement: For using Dapr Actors
- Sentry: For mTLS for service-to-service invocation
- Dashboard: For an operational view of the cluster
Sidecar resource settings
Set the resource assignments for the Dapr sidecar using the supported annotations. The specific annotations related to resource constraints are:
dapr.io/sidecar-cpu-limitdapr.io/sidecar-memory-limitdapr.io/sidecar-cpu-requestdapr.io/sidecar-memory-request
If not set, the Dapr sidecar runs without resource settings, which may lead to issues. For a production-ready setup, it’s strongly recommended to configure these settings.
Example settings for the Dapr sidecar in a production-ready setup:
| CPU | Memory |
|---|---|
| Limit: 300m, Request: 100m | Limit: 1000Mi, Request: 250Mi |
The CPU and memory limits above account for Dapr supporting a high number of I/O bound operations. Use a monitoring tool to get a baseline for the sidecar (and app) containers and tune these settings based on those baselines.
For more details on configuring resource in Kubernetes, see the following Kubernetes guides:
Note
Since Dapr is intended to do much of the I/O heavy lifting for your app, the resources given to Dapr drastically reduce the resource allocations for the application.Setting soft memory limits on Dapr sidecar
Set soft memory limits on the Dapr sidecar when you’ve set up memory limits. With soft memory limits, the sidecar garbage collector frees up memory once it exceeds the limit instead of waiting for it to be double of the last amount of memory present in the heap when it was run. Waiting is the default behavior of the garbage collector used in Go, and can lead to OOM Kill events.
For example, for an app with app-id nodeapp with memory limit set to 1000Mi, you can use the following in your pod annotations:
  annotations:
    dapr.io/enabled: "true"
    dapr.io/app-id: "nodeapp"
    # our daprd memory settings
    dapr.io/sidecar-memory-limit: "1000Mi"   # your memory limit
    dapr.io/env: "GOMEMLIMIT=900MiB"         # 90% of your memory limit. Also notice the suffix "MiB" instead of "Mi"
In this example, the soft limit has been set to be 90% to leave 5-10% for other services, as recommended.
The GOMEMLIMIT environment variable allows certain suffixes for the memory size: B, KiB, MiB, GiB, and TiB.
High availability mode
When deploying Dapr in a production-ready configuration, it’s best to deploy with a high availability (HA) configuration of the control plane. This creates three replicas of each control plane pod in the dapr-system namespace, allowing the Dapr control plane to retain three running instances and survive individual node failures and other outages.
For a new Dapr deployment, HA mode can be set with both:
- The Dapr CLI, and
- Helm charts
For an existing Dapr deployment, you can enable HA mode in a few extra steps.
Individual service HA Helm configuration
You can configure HA mode via Helm across all services by setting the global.ha.enabled flag to true. By default, --set global.ha.enabled=true is fully respected and cannot be overridden, making it impossible to simultaneously have either the placement or scheduler service as a single instance.
Note: HA for scheduler and placement services is not the default setting.
To scale scheduler and placement to three instances independently of the global.ha.enabled flag, set global.ha.enabled to false and dapr_scheduler.ha and dapr_placement.ha to true. For example:
helm upgrade --install dapr dapr/dapr \
 --version=1.15 \
 --namespace dapr-system \
 --create-namespace \
 --set global.ha.enabled=false \
 --set dapr_scheduler.ha=true \
 --set dapr_placement.ha=true \
 --wait
Setting cluster critical priority class name for control plane services
In some scenarios, nodes may have memory and/or cpu pressure and the Dapr control plane pods might get selected for eviction. To prevent this, you can set a critical priority class name for the Dapr control plane pods. This ensures that the Dapr control plane pods are not evicted unless all other pods with lower priority are evicted.
It’s particularly important to protect the Dapr control plane components from eviction, especially the Scheduler service. When Schedulers are rescheduled or restarted, it can be highly disruptive to inflight jobs, potentially causing them to fire duplicate times. To prevent such disruptions, you should ensure the Dapr control plane components have a higher priority class than your application workloads.
Learn more about Protecting Mission-Critical Pods.
There are two built-in critical priority classes in Kubernetes:
system-cluster-criticalsystem-node-critical(highest priority)
It’s recommended to set the priorityClassName to system-cluster-critical for the Dapr control plane pods. If you have your own custom priority classes for your applications, ensure they have a lower priority value than the one assigned to the Dapr control plane to maintain system stability and prevent disruption of core Dapr services.
For a new Dapr control plane deployment, the system-cluster-critical priority class mode can be set via the helm value global.priorityClassName.
This priority class can be set with both the Dapr CLI and Helm charts,
using the helm --set global.priorityClassName=system-cluster-critical argument.
Dapr version < 1.14
For versions of Dapr below v1.14, it’s recommended that you add a ResourceQuota to the Dapr control plane namespace. This prevents
problems associated with scheduling pods where the cluster may be configured
with limitations on which pods can be assigned high priority classes. For v1.14 onwards the Helm chart adds this automatically.
If you have Dapr installed in namespace dapr-system, you can create a ResourceQuota with the following content:
apiVersion: v1
kind: ResourceQuota
metadata:
  name: dapr-system-critical-quota
  namespace: dapr-system
spec:
  scopeSelector:
    matchExpressions:
      - operator : In
        scopeName: PriorityClass
        values: [system-cluster-critical]
Deploy Dapr with Helm
Visit the full guide on deploying Dapr with Helm.
Parameters file
It’s recommended to create a values file, instead of specifying parameters on the command. Check the values file into source control so that you can track its changes.
See a full list of available parameters and settings.
The following command runs three replicas of each control plane service in the dapr-system namespace.
# Add/update a official Dapr Helm repo.
helm repo add dapr https://dapr.github.io/helm-charts/
# or add/update a private Dapr Helm repo.
helm repo add dapr http://helm.custom-domain.com/dapr/dapr/ \
   --username=xxx --password=xxx
helm repo update

# See which chart versions are available
helm search repo dapr --devel --versions

# create a values file to store variables
touch values.yml
cat << EOF >> values.yml
global:
  ha:
    enabled: true
EOF

# run install/upgrade
helm install dapr dapr/dapr \
  --version=<Dapr chart version> \
  --namespace dapr-system \
  --create-namespace \
  --values values.yml \
  --wait

# verify the installation
kubectl get pods --namespace dapr-system
Note
The example above useshelm install and helm upgrade. You can also run helm upgrade --install to dynamically determine whether to install or upgrade.The Dapr Helm chart automatically deploys with affinity for nodes with the label kubernetes.io/os=linux. You can deploy the Dapr control plane to Windows nodes. For more information, see Deploying to a Hybrid Linux/Windows K8s Cluster.
Upgrade Dapr with Helm
Dapr supports zero-downtime upgrades in the following steps.
Upgrade the CLI (recommended)
Upgrading the CLI is optional, but recommended.
- Download the latest version of the CLI.
- Verify the Dapr CLI is in your path.
Upgrade the control plane
Upgrade Dapr on a Kubernetes cluster.
Update the data plane (sidecars)
Update pods that are running Dapr to pick up the new version of the Dapr runtime.
Issue a rollout restart command for any deployment that has the
dapr.io/enabledannotation:kubectl rollout restart deploy/<Application deployment name>View a list of all your Dapr enabled deployments via either:
The Dapr Dashboard
Running the following command using the Dapr CLI:
dapr list -k

APP ID     APP PORT  AGE  CREATED
nodeapp    3000      16h  2020-07-29 17:16.22
Enable high availability in an existing Dapr deployment
Enabling HA mode for an existing Dapr deployment requires two steps:
Delete the existing placement stateful set.
kubectl delete statefulset.apps/dapr-placement-server -n dapr-systemYou delete the placement stateful set because, in HA mode, the placement service adds Raft for leader election. However, Kubernetes only allows for limited fields in stateful sets to be patched, subsequently failing upgrade of the placement service.
Deletion of the existing placement stateful set is safe. The agents reconnect and re-register with the newly created placement service, which persist its table in Raft.
Issue the upgrade command.
helm upgrade dapr ./charts/dapr -n dapr-system --set global.ha.enabled=true
Recommended security configuration
When properly configured, Dapr ensures secure communication and can make your application more secure with a number of built-in features.
Verify your production-ready deployment includes the following settings:
Mutual Authentication (mTLS) is enabled. Dapr has mTLS on by default. Learn more about how to bring your own certificates.
App to Dapr API authentication is enabled. This is the communication between your application and the Dapr sidecar. To secure the Dapr API from unauthorized application access, enable Dapr’s token-based authentication.
Dapr to App API authentication is enabled. This is the communication between Dapr and your application. Let Dapr know that it is communicating with an authorized application using token authentication.
Component secret data is configured in a secret store and not hard-coded in the component YAML file. Learn how to use secrets with Dapr components.
The Dapr control plane is installed on a dedicated namespace, such as
dapr-system.Dapr supports and is enabled to scope components for certain applications. This is not a required practice. Learn more about component scopes.
Recommended Placement service configuration
The Placement service is a component in Dapr, responsible for disseminating information about actor addresses to all Dapr sidecars via a placement table (more information on this can be found here).
When running in production, it’s recommended to configure the Placement service with the following values:
- High availability. Ensure the Placement service is highly available (three replicas) and can survive individual node failures. Helm chart value:
dapr_placement.ha=true - In-memory logs. Use in-memory Raft log store for faster writes. The tradeoff is more placement table disseminations (and thus, network traffic) in an eventual Placement service pod failure. Helm chart value:
dapr_placement.cluster.forceInMemoryLog=true - No metadata endpoint. Disable the unauthenticated
/placement/stateendpoint which exposes placement table information for the Placement service. Helm chart value:dapr_placement.metadataEnabled=false - Timeouts Control the sensitivity of network connectivity between the Placement service and the sidecars using the below timeout values. Default values are set, but you can adjust these based on your network conditions.
dapr_placement.keepAliveTimesets the interval at which the Placement service sends keep alive pings to Dapr sidecars on the gRPC stream to check if the connection is still alive. Lower values will lead to shorter actor rebalancing time in case of pod loss/restart, but higher network traffic during normal operation. Accepts values between1sand10s. Default is2s.dapr_placement.keepAliveTimeoutsets the timeout period for Dapr sidecars to respond to the Placement service’s keep alive pings before the Placement service closes the connection. Lower values will lead to shorter actor rebalancing time in case of pod loss/restart, but higher network traffic during normal operation. Accepts values between1sand10s. Default is3s.dapr_placement.disseminateTimeoutsets the timeout period for dissemination to be delayed after actor membership change (usually related to pod restarts) to avoid excessive dissemination during multiple pod restarts. Higher values will reduce the frequency of dissemination, but delay the table dissemination. Accepts values between1sand3s. Default is2s.
Service account tokens
By default, Kubernetes mounts a volume containing a Service Account token in each container. Applications can use this token, whose permissions vary depending on the configuration of the cluster and namespace, among other things, to perform API calls against the Kubernetes control plane.
When creating a new Pod (or a Deployment, StatefulSet, Job, etc), you can disable auto-mounting the Service Account token by setting automountServiceAccountToken: false in your pod’s spec.
It’s recommended that you consider deploying your apps with automountServiceAccountToken: false to improve the security posture of your pods, unless your apps depend on having a Service Account token. For example, you may need a Service Account token if:
- Your application needs to interact with the Kubernetes APIs.
- You are using Dapr components that interact with the Kubernetes APIs; for example, the Kubernetes secret store or the Kubernetes Events binding.
Thus, Dapr does not set automountServiceAccountToken: false automatically for you. However, in all situations where the Service Account is not required by your solution, it’s recommended that you set this option in the pods spec.
Note
Initializing Dapr components using component secrets stored as Kubernetes secrets does not require a Service Account token, so you can still setautomountServiceAccountToken: false in this case. Only calling the Kubernetes secret store at runtime, using the Secrets management building block, is impacted.Tracing and metrics configuration
Tracing and metrics are enabled in Dapr by default. It’s recommended that you set up distributed tracing and metrics for your applications and the Dapr control plane in production.
If you already have your own observability setup, you can disable tracing and metrics for Dapr.
Tracing
Configure a tracing backend for Dapr.
Metrics
For metrics, Dapr exposes a Prometheus endpoint listening on port 9090, which can be scraped by Prometheus.
Set up Prometheus, Grafana, and other monitoring tools with Dapr.
Injector watchdog
The Dapr Operator service includes an injector watchdog, which can be used to detect and remediate situations where your application’s pods may be deployed without the Dapr sidecar (the daprd container). For example, it can assist with recovering the applications after a total cluster failure.
The injector watchdog is disabled by default when running Dapr in Kubernetes mode. However, you should consider enabling it with the appropriate values for your specific situation.
Refer to the Dapr operator service documentation for more details on the injector watchdog and how to enable it.
Configure seccompProfile for sidecar containers
By default, the Dapr sidecar injector injects a sidecar without any seccompProfile. However, for the Dapr sidecar container to run successfully in a namespace with the Restricted profile, the sidecar container needs securityContext.seccompProfile.Type to not be nil.
Refer to the Arguments and Annotations overview to set the appropriate seccompProfile on the sidecar container.
Best Practices
Watch this video for a deep dive into the best practices for running Dapr in production with Kubernetes.
Related links
2.2.6 - Deploy Dapr per-node or per-cluster with Dapr Shared
Dapr automatically injects a sidecar to enable the Dapr APIs for your applications for the best availability and reliability.
Dapr Shared enables two alternative deployment strategies to create Dapr applications using a Kubernetes Daemonset for a per-node deployment or a Deployment for a per-cluster deployment.
DaemonSet: When running Dapr Shared as a KubernetesDaemonSetresource, the daprd container runs on each Kubernetes node in the cluster. This can reduce network hops between the applications and Dapr.Deployment: When running Dapr Shared as a KubernetesDeployment, the Kubernetes scheduler decides on which single node in the cluster the daprd container instance runs.
Dapr Shared deployments
For each Dapr application you deploy, you need to deploy the Dapr Shared Helm chart using differentshared.appIds.Why Dapr Shared?
By default, when Dapr is installed into a Kubernetes cluster, the Dapr control plane injects Dapr as a sidecar to applications annotated with Dapr annotations ( dapr.io/enabled: "true"). Sidecars offer many advantages, including improved resiliency, since there is an instance per application and all communication between the application and the sidecar happens without involving the network.
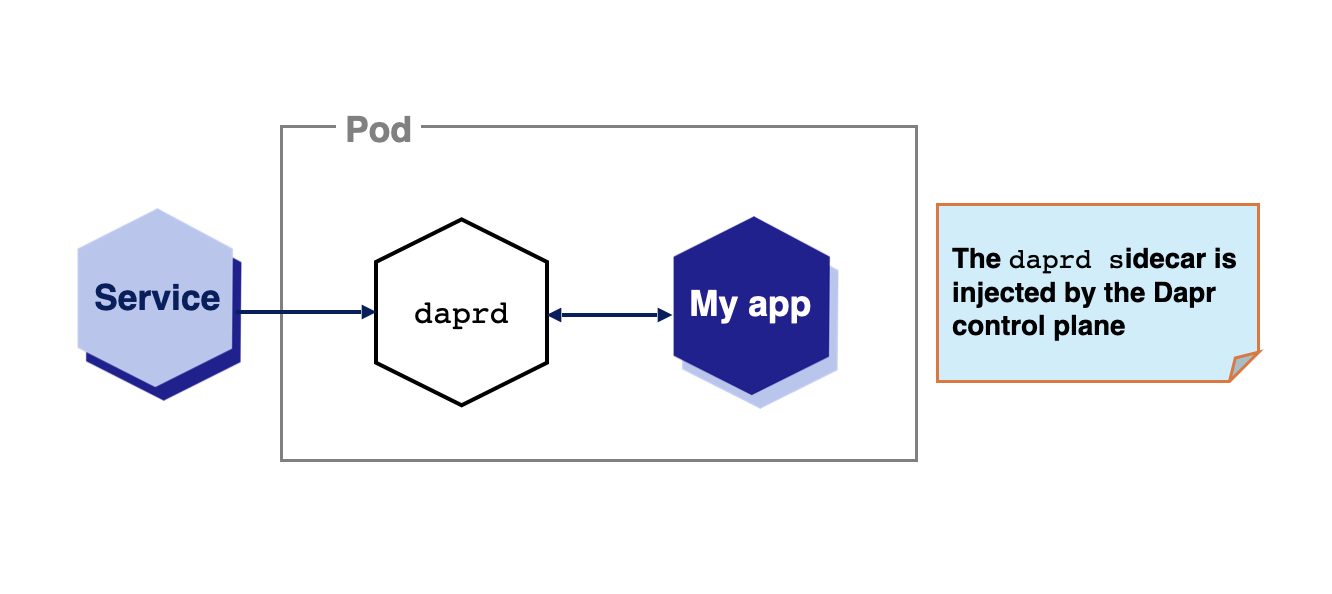
While sidecars are Dapr’s default deployment, some use cases require other approaches. Let’s say you want to decouple the lifecycle of your workloads from the Dapr APIs. A typical example of this is functions, or function-as-a-service runtimes, which might automatically downscale your idle workloads to free up resources. For such cases, keeping the Dapr APIs and all the Dapr async functionalities (such as subscriptions) separate might be required.
Dapr Shared was created for these scenarios, extending the Dapr sidecar model with two new deployment approaches: DaemonSet (per-node) and Deployment (per-cluster).
Important
No matter which deployment approach you choose, it is important to understand that in most use cases, you have one instance of Dapr Shared (Helm release) per service (app-id). This means that if you have an application composed of three microservices, each service is recommended to have its own Dapr Shared instance. You can see this in action by trying the Hello Kubernetes with Dapr Shared tutorial.DaemonSet(Per-node)
With Kubernetes DaemonSet, you can define applications that need to be deployed once per node in the cluster. This enables applications that are running on the same node to communicate with local Dapr APIs, no matter where the Kubernetes Scheduler schedules your workload.
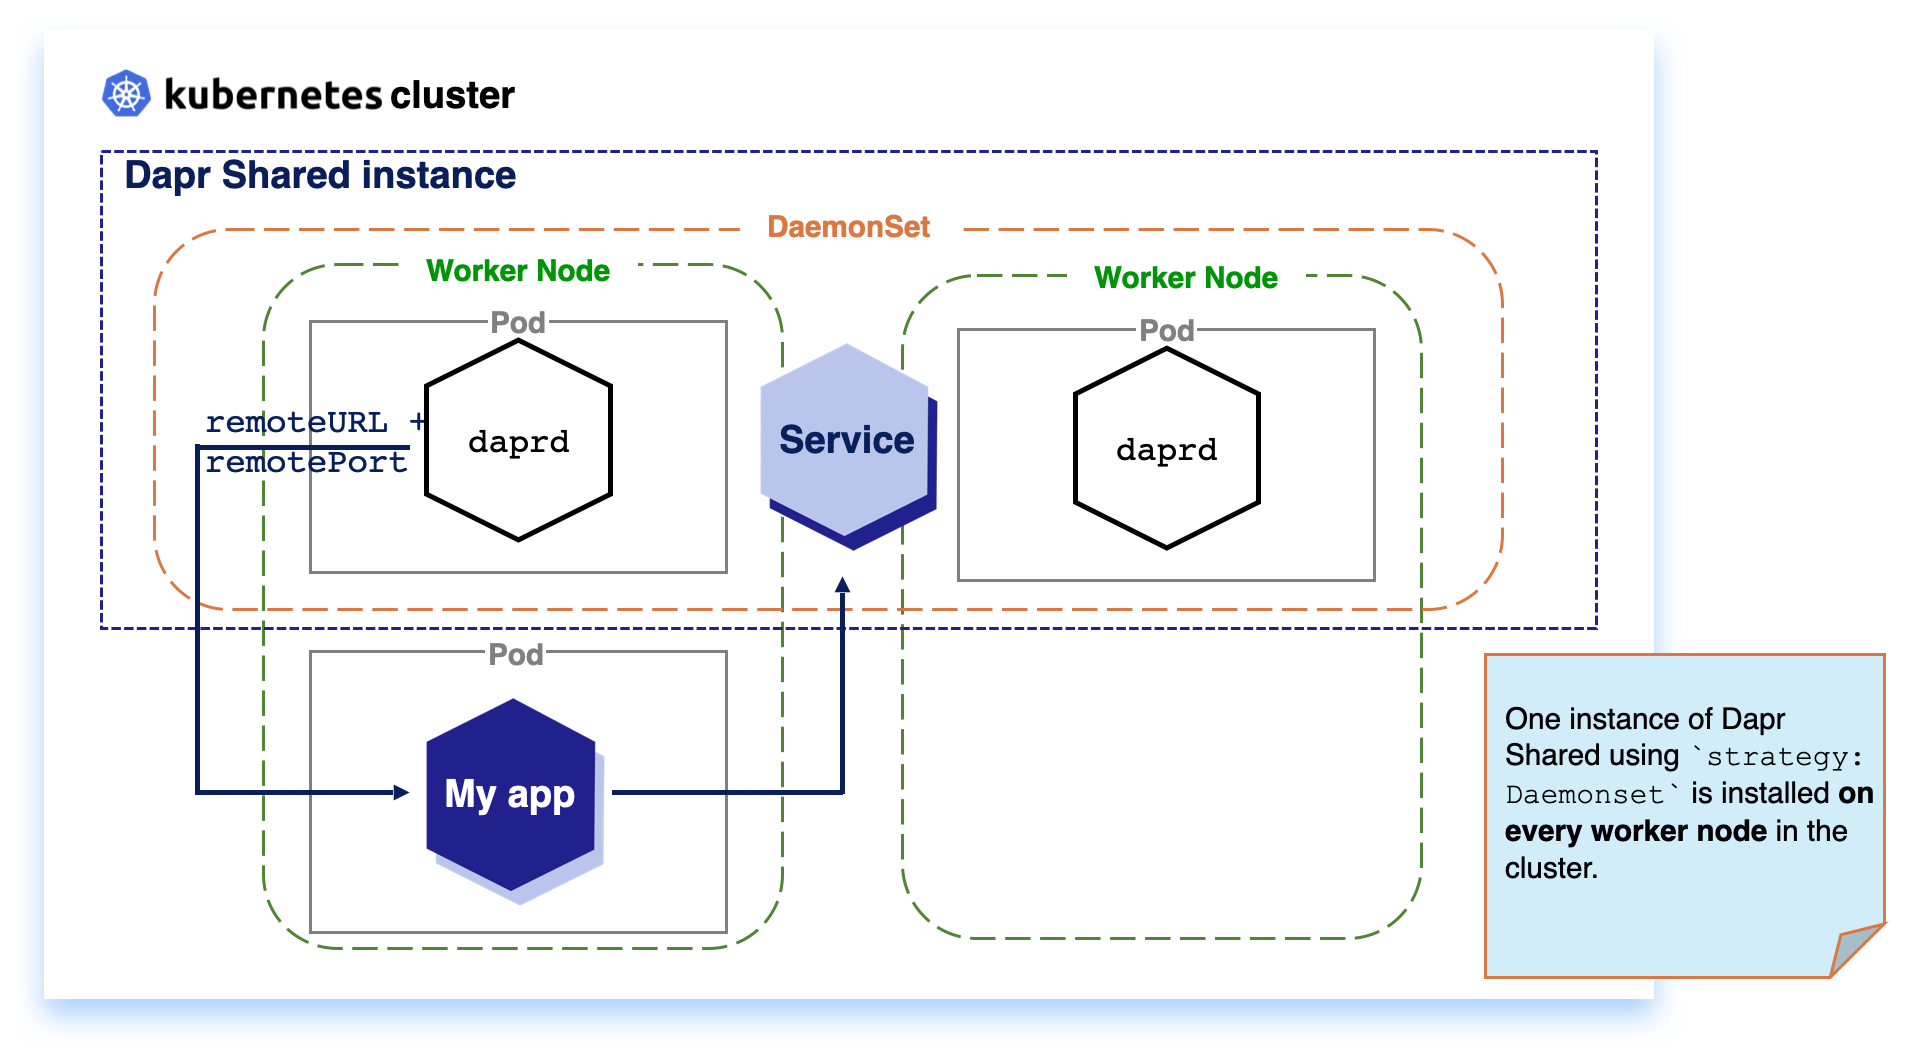
Note
SinceDaemonSet installs one instance per node, it consumes more resources in your cluster, compared to Deployment for a per cluster deployment, with the advantage of improved resiliency.Deployment (Per-cluster)
Kubernetes Deployments are installed once per cluster. Based on available resources, the Kubernetes Scheduler decides on which node the workload is scheduled. For Dapr Shared, this means that your workload and the Dapr instance might be located on separate nodes, which can introduce considerable network latency with the trade-off of reduce resource usage.
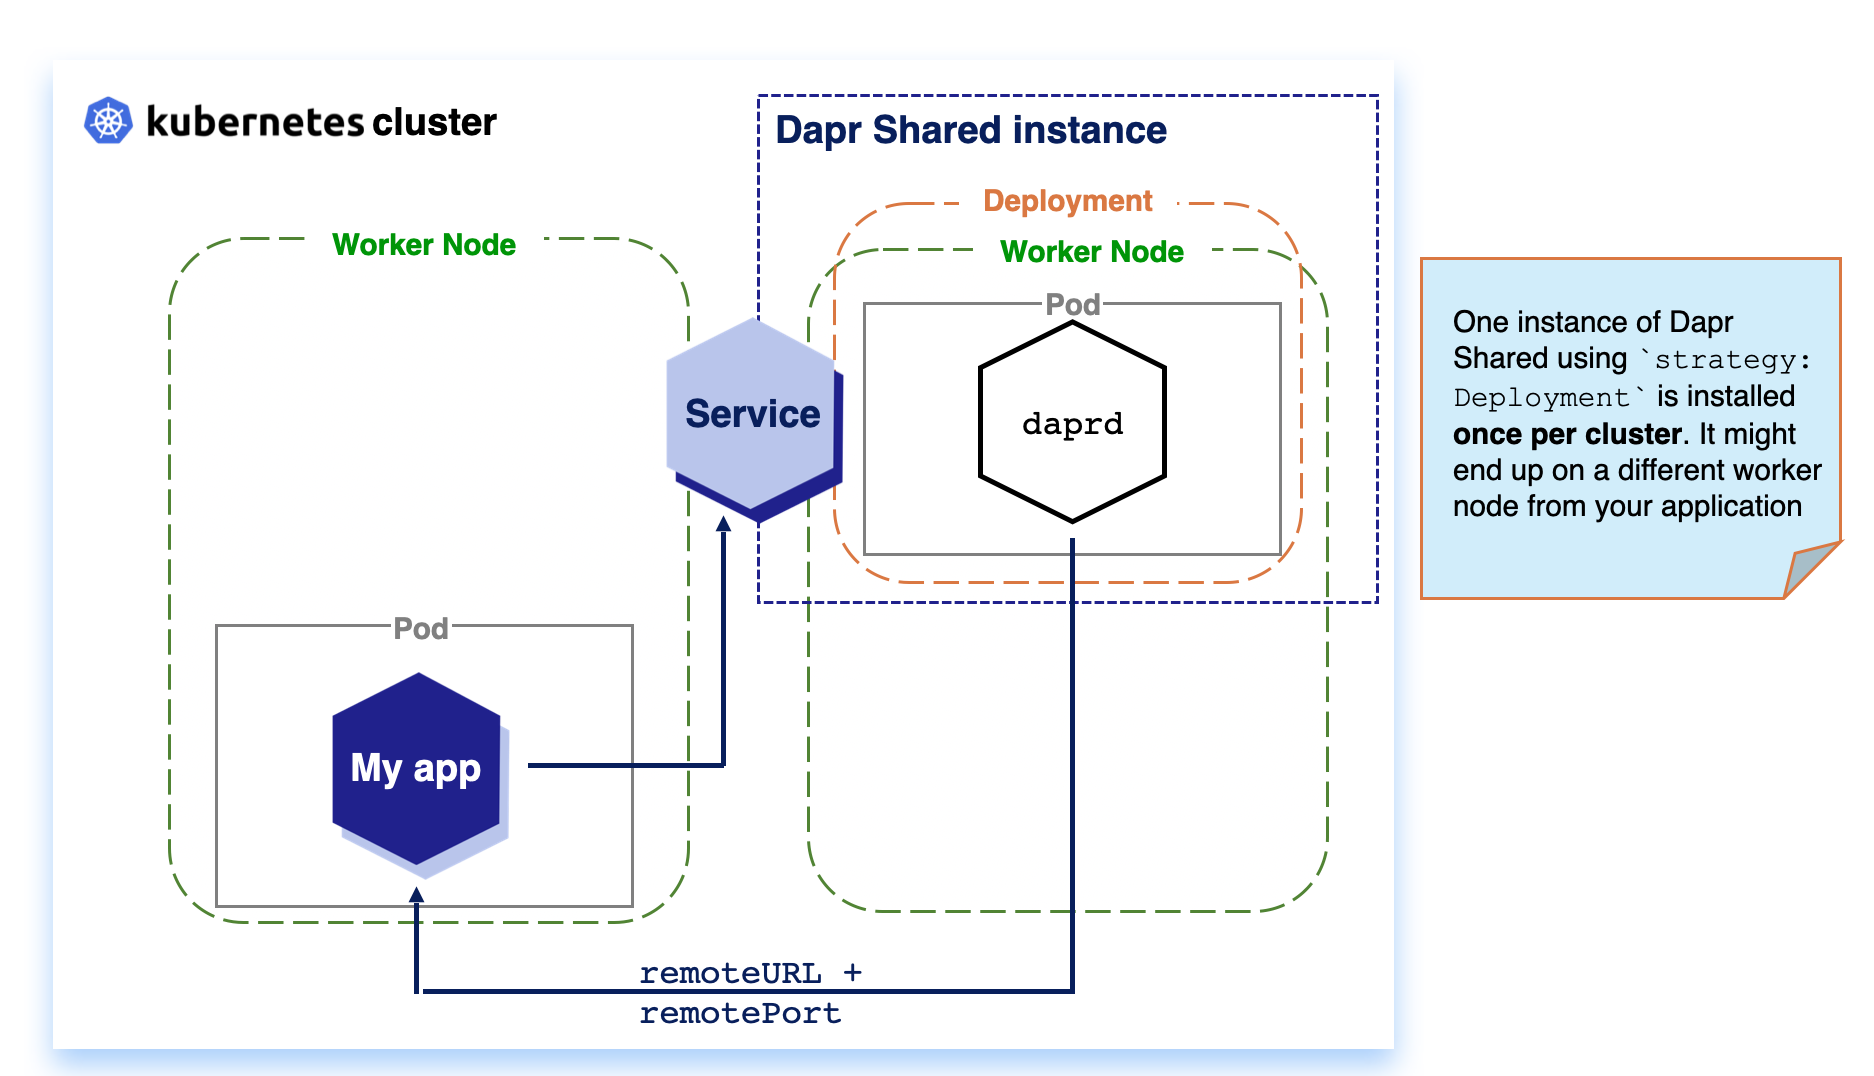
Getting Started with Dapr Shared
Prerequisites
Before installing Dapr Shared, make ensure you have Dapr installed in your cluster.If you want to get started with Dapr Shared, you can create a new Dapr Shared instance by installing the official Helm Chart:
helm install my-shared-instance oci://registry-1.docker.io/daprio/dapr-shared-chart --set shared.appId=<DAPR_APP_ID> --set shared.remoteURL=<REMOTE_URL> --set shared.remotePort=<REMOTE_PORT> --set shared.strategy=deployment
Your Dapr-enabled applications can now make use of the Dapr Shared instance by pointing the Dapr SDKs to or sending requests to the my-shared-instance-dapr Kubernetes service exposed by the Dapr Shared instance.
The
my-shared-instanceabove is the Helm Chart release name.
If you are using the Dapr SDKs, you can set the following environment variables for your application to connect to the Dapr Shared instance (in this case, running on the default namespace):
        env:
        - name: DAPR_HTTP_ENDPOINT
          value: http://my-shared-instance-dapr.default.svc.cluster.local:3500
        - name: DAPR_GRPC_ENDPOINT
          value: http://my-shared-instance-dapr.default.svc.cluster.local:50001
If you are not using the SDKs, you can send HTTP or gRPC requests to those endpoints.
Next steps
- Try the Hello Kubernetes tutorial with Dapr Shared.
- Read more in the Dapr Shared repo
2.2.7 - How-to: Persist Scheduler Jobs
The Scheduler service is responsible for writing jobs to its embedded Etcd database and scheduling them for execution.
By default, the Scheduler service database writes data to a Persistent Volume Claim volume of size 1Gb, using the cluster’s default storage class.
This means that there is no additional parameter required to run the scheduler service reliably on most Kubernetes deployments, although you will need additional configuration if a default StorageClass is not available or when running a production environment.
Warning
The default storage size for the Scheduler is1Gi, which is likely not sufficient for most production deployments.
Remember that the Scheduler is used for Actor Reminders & Workflows, and the Jobs API.
You may want to consider reinstalling Dapr with a larger Scheduler storage of at least 16Gi or more.
For more information, see the ETCD Storage Disk Size section below.Production Setup
ETCD Storage Disk Size
The default storage size for the Scheduler is 1Gb.
This size is likely not sufficient for most production deployments.
When the storage size is exceeded, the Scheduler will log an error similar to the following:
error running scheduler: etcdserver: mvcc: database space exceeded
Knowing the safe upper bound for your storage size is not an exact science, and relies heavily on the number, persistence, and the data payload size of your application jobs. The Job API and Actor Reminders transparently maps one to one to the usage of your applications. Workflows create a large number of jobs as Actor Reminders, however these jobs are short lived- matching the lifecycle of each workflow execution. The data payload of jobs created by Workflows is typically empty or small.
The Scheduler uses Etcd as its storage backend database. By design, Etcd persists historical transactions and data in form of Write-Ahead Logs (WAL) and snapshots. This means the actual disk usage of Scheduler will be higher than the current observable database state, often by a number of multiples.
Setting the Storage Size on Installation
If you need to increase an existing Scheduler storage size, see the Increase Scheduler Storage Size section below.
To increase the storage size (in this example- 16Gi) for a fresh Dapr installation, you can use the following command:
dapr init -k --set dapr_scheduler.cluster.storageSize=16Gi --set dapr_scheduler.etcdSpaceQuota=16Gi
helm upgrade --install dapr dapr/dapr \
--version=1.15 \
--namespace dapr-system \
--create-namespace \
--set dapr_scheduler.cluster.storageSize=16Gi \
--set dapr_scheduler.etcdSpaceQuota=16Gi \
--wait
Note
For storage providers that do NOT support dynamic volume expansion: If Dapr has ever been installed on the cluster before, the Scheduler’s Persistent Volume Claims must be manually uninstalled in order for new ones with increased storage size to be created.
kubectl delete pvc -n dapr-system dapr-scheduler-data-dir-dapr-scheduler-server-0 dapr-scheduler-data-dir-dapr-scheduler-server-1 dapr-scheduler-data-dir-dapr-scheduler-server-2
Persistent Volume Claims are not deleted automatically with an uninstall. This is a deliberate safety measure to prevent accidental data loss.
Increase existing Scheduler Storage Size
Warning
Not all storage providers support dynamic volume expansion. Please see your storage provider documentation to determine if this feature is supported, and what to do if it is not.By default, each Scheduler will create a Persistent Volume and Persistent Volume Claim of size 1Gi against the default standard storage class for each Scheduler replica.
These will look similar to the following, where in this example we are running Scheduler in HA mode.
NAMESPACE     NAME                                              STATUS   VOLUME                                     CAPACITY   ACCESS MODES   STORAGECLASS   VOLUMEATTRIBUTESCLASS   AGE
dapr-system   dapr-scheduler-data-dir-dapr-scheduler-server-0   Bound    pvc-9f699d2e-f347-43b0-aa98-57dcf38229c5   1Gi        RWO            standard       <unset>                 3m25s
dapr-system   dapr-scheduler-data-dir-dapr-scheduler-server-1   Bound    pvc-f4c8be7b-ffbe-407b-954e-7688f2482caa   1Gi        RWO            standard       <unset>                 3m25s
dapr-system   dapr-scheduler-data-dir-dapr-scheduler-server-2   Bound    pvc-eaad5fb1-98e9-42a5-bcc8-d45dba1c4b9f   1Gi        RWO            standard       <unset>                 3m25s
NAME                                       CAPACITY   ACCESS MODES   RECLAIM POLICY   STATUS   CLAIM                                                         STORAGECLASS   VOLUMEATTRIBUTESCLASS   REASON   AGE
pvc-9f699d2e-f347-43b0-aa98-57dcf38229c5   1Gi        RWO            Delete           Bound    dapr-system/dapr-scheduler-data-dir-dapr-scheduler-server-0   standard       <unset>                          4m24s
pvc-eaad5fb1-98e9-42a5-bcc8-d45dba1c4b9f   1Gi        RWO            Delete           Bound    dapr-system/dapr-scheduler-data-dir-dapr-scheduler-server-2   standard       <unset>                          4m24s
pvc-f4c8be7b-ffbe-407b-954e-7688f2482caa   1Gi        RWO            Delete           Bound    dapr-system/dapr-scheduler-data-dir-dapr-scheduler-server-1   standard       <unset>                          4m24s
To expand the storage size of the Scheduler, follow these steps:
- First, ensure that the storage class supports volume expansion, and that the
allowVolumeExpansionfield is set totrueif it is not already.
apiVersion: storage.k8s.io/v1
kind: StorageClass
metadata:
  name: standard
provisioner: my.driver
allowVolumeExpansion: true
...
- Delete the Scheduler StatefulSet whilst preserving the Bound Persistent Volume Claims.
kubectl delete sts -n dapr-system dapr-scheduler-server --cascade=orphan
- Increase the size of the Persistent Volume Claims to the desired size by editing the
spec.resources.requests.storagefield. Again in this case, we are assuming that the Scheduler is running in HA mode with 3 replicas.
kubectl edit pvc -n dapr-system dapr-scheduler-data-dir-dapr-scheduler-server-0 dapr-scheduler-data-dir-dapr-scheduler-server-1 dapr-scheduler-data-dir-dapr-scheduler-server-2
- Recreate the Scheduler StatefulSet by installing Dapr with the desired storage size.
Storage Class
In case your Kubernetes deployment does not have a default storage class or you are configuring a production cluster, defining a storage class is required.
A persistent volume is backed by a real disk that is provided by the hosted Cloud Provider or Kubernetes infrastructure platform. Disk size is determined by how many jobs are expected to be persisted at once; however, 64Gb should be more than sufficient for most production scenarios. Some Kubernetes providers recommend using a CSI driver to provision the underlying disks. Below are a list of useful links to the relevant documentation for creating a persistent disk for the major cloud providers:
- Google Cloud Persistent Disk
- Amazon EBS Volumes
- Azure AKS Storage Options
- Digital Ocean Block Storage
- VMWare vSphere Storage
- OpenShift Persistent Storage
- Alibaba Cloud Disk Storage
Once the storage class is available, you can install Dapr using the following command, with Scheduler configured to use the storage class (replace my-storage-class with the name of the storage class):
Note
If Dapr is already installed, the control plane needs to be completely uninstalled in order for the SchedulerStatefulSet to be recreated with the new persistent volume.dapr init -k --set dapr_scheduler.cluster.storageClassName=my-storage-class
helm upgrade --install dapr dapr/dapr \
--version=1.15 \
--namespace dapr-system \
--create-namespace \
--set dapr_scheduler.cluster.storageClassName=my-storage-class \
--wait
Ephemeral Storage
When running in non-HA mode, the Scheduler can be optionally made to use ephemeral storage, which is in-memory storage that is not resilient to restarts. For example, all jobs data is lost after a Scheduler restart. This is useful in non-production deployments or for testing where storage is not available or required.
Note
If Dapr is already installed, the control plane needs to be completely uninstalled in order for the SchedulerStatefulSet to be recreated without the persistent volume.dapr init -k --set dapr_scheduler.cluster.inMemoryStorage=true
helm upgrade --install dapr dapr/dapr \
--version=1.15 \
--namespace dapr-system \
--create-namespace \
--set dapr_scheduler.cluster.inMemoryStorage=true \
--wait
2.2.8 - Deploy to hybrid Linux/Windows Kubernetes clusters
Dapr supports running your microservices on Kubernetes clusters on:
- Windows
- Linux
- A combination of both
This is especially helpful during a piecemeal migration of a legacy application into a Dapr Kubernetes cluster.
Kubernetes uses a concept called node affinity to denote whether you want your application to be launched on a Linux node or a Windows node. When deploying to a cluster which has both Windows and Linux nodes, you must provide affinity rules for your applications, otherwise the Kubernetes scheduler might launch your application on the wrong type of node.
Prerequisites
Before you begin, set up a Kubernetes cluster with Windows nodes. Many Kubernetes providers support the automatic provisioning of Windows enabled Kubernetes clusters.
Follow your preferred provider’s instructions for setting up a cluster with Windows enabled.
Once you have set up the cluster, verify that both Windows and Linux nodes are available.
kubectl get nodes -o wide

NAME                                STATUS   ROLES   AGE     VERSION   INTERNAL-IP    EXTERNAL-IP      OS-IMAGE                         KERNEL-VERSION      CONTAINER-RUNTIME
aks-nodepool1-11819434-vmss000000   Ready    agent   6d      v1.17.9   10.240.0.4     <none>        Ubuntu 16.04.6    LTS               4.15.0-1092-azure   docker://3.0.10+azure
aks-nodepool1-11819434-vmss000001   Ready    agent   6d      v1.17.9   10.240.0.35    <none>        Ubuntu 16.04.6    LTS               4.15.0-1092-azure   docker://3.0.10+azure
aks-nodepool1-11819434-vmss000002   Ready    agent   5d10h   v1.17.9   10.240.0.129   <none>        Ubuntu 16.04.6    LTS               4.15.0-1092-azure   docker://3.0.10+azure
akswin000000                        Ready    agent   6d      v1.17.9   10.240.0.66    <none>        Windows Server 2019    Datacenter   10.0.17763.1339     docker://19.3.5
akswin000001                        Ready    agent   6d      v1.17.9   10.240.0.97    <none>        Windows Server 2019    Datacenter   10.0.17763.1339     docker://19.3.5
Install the Dapr control plane
If you are installing using the Dapr CLI or via a Helm chart, simply follow the normal deployment procedures: Installing Dapr on a Kubernetes cluster
Affinity will be automatically set for kubernetes.io/os=linux. This will be sufficient for most users, as Kubernetes requires at least one Linux node pool.
Note
Dapr control plane containers are built and tested for both Windows and Linux. However, it’s recommended to use the Linux control plane containers, which tend to be smaller and have a much larger user base.
If you understand the above, but want to deploy the Dapr control plane to Windows, you can do so by setting:
helm install dapr dapr/dapr --set global.daprControlPlaneOs=windows
Install Dapr applications
Windows applications
Once you’ve created a Docker container with your application, create a deployment YAML file with the node affinity set to
kubernetes.io/os: windows. In the exampledeploy_windows.yamldeployment file below:apiVersion: apps/v1 kind: Deployment metadata: name: yourwinapp labels: app: applabel spec: replicas: 1 selector: matchLabels: app: applablel template: metadata: labels: app: applabel annotations: dapr.io/enabled: "true" dapr.io/id: "addapp" dapr.io/port: "6000" dapr.io/config: "appconfig" spec: containers: - name: add image: yourreponsitory/your-windows-dapr-container:your-tag ports: - containerPort: 6000 imagePullPolicy: Always affinity: nodeAffinity: requiredDuringSchedulingIgnoredDuringExecution: nodeSelectorTerms: - matchExpressions: - key: kubernetes.io/os operator: In values: - windowsDeploy the YAML file to your Kubernetes cluster.
kubectl apply -f deploy_windows.yaml
Linux applications
If you already have a Dapr application that runs on Linux, you still need to add affinity rules.
Create a deployment YAML file with the node affinity set to
kubernetes.io/os: linux. In the exampledeploy_linux.yamldeployment file below:apiVersion: apps/v1 kind: Deployment metadata: name: yourlinuxapp labels: app: yourlabel spec: replicas: 1 selector: matchLabels: app: yourlabel template: metadata: labels: app: yourlabel annotations: dapr.io/enabled: "true" dapr.io/id: "addapp" dapr.io/port: "6000" dapr.io/config: "appconfig" spec: containers: - name: add image: yourreponsitory/your-application:your-tag ports: - containerPort: 6000 imagePullPolicy: Always affinity: nodeAffinity: requiredDuringSchedulingIgnoredDuringExecution: nodeSelectorTerms: - matchExpressions: - key: kubernetes.io/os operator: In values: - linuxDeploy the YAML to your Kubernetes cluster.
kubectl apply -f deploy_linux.yaml
That’s it!
Clean up
To remove the deployments from this guide, run the following commands:
kubectl delete -f deploy_linux.yaml
kubectl delete -f deploy_windows.yaml
helm uninstall dapr
Related links
- See the official Kubernetes documentation for examples of more advanced configuration via node affinity
- Get started: Prep Windows for containers
- Setting up a Windows enabled Kubernetes cluster on Azure AKS
- Setting up a Windows enabled Kubernetes cluster on AWS EKS
- Setting up Windows on Google Cloud GKE
2.2.9 - Running Dapr with a Kubernetes Job
The Dapr sidecar is designed to be a long running process. In the context of a Kubernetes Job this behavior can block your job completion.
To address this issue, the Dapr sidecar has an endpoint to Shutdown the sidecar.
When running a basic Kubernetes Job, you need to call the /shutdown endpoint for the sidecar to gracefully stop and the job to be considered Completed.
When a job is finished without calling Shutdown, your job is in a NotReady state with only the daprd container running endlessly.
Stopping the Dapr sidecar causes its readiness and liveness probes to fail in your container.
To prevent Kubernetes from trying to restart your job, set your job’s restartPolicy to Never.
Be sure to use the POST HTTP verb when calling the shutdown HTTP API. For example:
apiVersion: batch/v1
kind: Job
metadata:
  name: job-with-shutdown
spec:
  template:
    metadata:
      annotations:
        dapr.io/enabled: "true"
        dapr.io/app-id: "with-shutdown"
    spec:
      containers:
      - name: job
        image: alpine
        command: ["/bin/sh", "-c", "apk --no-cache add curl && sleep 20 && curl -X POST localhost:3500/v1.0/shutdown"]
      restartPolicy: Never
You can also call the Shutdown from any of the Dapr SDKs. For example, for the Go SDK:
package main

import (
	"context"
	"log"
	"os"

	dapr "github.com/dapr/go-sdk/client"
)

func main() {
  client, err := dapr.NewClient()
  if err != nil {
    log.Panic(err)
  }
  defer client.Close()
  defer client.Shutdown()
  // Job
}
Related links
2.2.10 - How-to: Mount Pod volumes to the Dapr sidecar
The Dapr sidecar can be configured to mount any Kubernetes Volume attached to the application Pod. These Volumes can be accessed by the daprd (sidecar) container in read-only or read-write modes. If a Volume is configured to be mounted but it does not exist in the Pod, Dapr logs a warning and ignores it.
For more information on different types of Volumes, check the Kubernetes documentation.
Configuration
You can set the following annotations in your deployment YAML:
| Annotation | Description |
|---|---|
dapr.io/volume-mounts | For read-only volume mounts |
dapr.io/volume-mounts-rw | For read-write volume mounts |
These annotations are comma separated pairs of volume-name:path/in/container. Verify the corresponding Volumes exist in the Pod spec.
Within the official container images, Dapr runs as a process with user ID (UID) 65532. Make sure that folders and files inside the mounted Volume are writable or readable by user 65532 as appropriate.
Although you can mount a Volume in any folder within the Dapr sidecar container, prevent conflicts and ensure smooth operations going forward by placing all mountpoints within one of the following locations, or in a subfolder within them:
| Location | Description |
|---|---|
/mnt | Recommended for Volumes containing persistent data that the Dapr sidecar process can read and/or write. |
/tmp | Recommended for Volumes containing temporary data, such as scratch disks. |
Examples
Basic deployment resource example
In the example Deployment resource below:
my-volume1is available inside the sidecar container at/mnt/sample1in read-only modemy-volume2is available inside the sidecar container at/mnt/sample2in read-only modemy-volume3is available inside the sidecar container at/tmp/sample3in read-write mode
apiVersion: apps/v1
kind: Deployment
metadata:
  name: myapp
  namespace: default
  labels:
    app: myapp
spec:
  replicas: 1
  selector:
    matchLabels:
      app: myapp
  template:
    metadata:
      labels:
        app: myapp
      annotations:
        dapr.io/enabled: "true"
        dapr.io/app-id: "myapp"
        dapr.io/app-port: "8000"
        dapr.io/volume-mounts: "my-volume1:/mnt/sample1,my-volume2:/mnt/sample2"
        dapr.io/volume-mounts-rw: "my-volume3:/tmp/sample3"
    spec:
      volumes:
        - name: my-volume1
          hostPath:
            path: /sample
        - name: my-volume2
          persistentVolumeClaim:
            claimName: pv-sample
        - name: my-volume3
          emptyDir: {}
...
Custom secrets storage using local file secret store
Since any type of Kubernetes Volume can be attached to the sidecar, you can use the local file secret store to read secrets from a variety of places. For example, if you have a Network File Share (NFS) server running at 10.201.202.203, with secrets stored at /secrets/stage/secrets.json, you can use that as a secrets storage.
Configure the application pod to mount the NFS and attach it to the Dapr sidecar.
apiVersion: apps/v1
kind: Deployment
metadata:
  name: myapp
...
spec:
  ...
  template:
    ...
      annotations:
        dapr.io/enabled: "true"
        dapr.io/app-id: "myapp"
        dapr.io/app-port: "8000"
        dapr.io/volume-mounts: "nfs-secrets-vol:/mnt/secrets"
    spec:
      volumes:
        - name: nfs-secrets-vol
          nfs:
            server: 10.201.202.203
            path: /secrets/stage
...
Point the local file secret store component to the attached file.
apiVersion: dapr.io/v1alpha1
kind: Component
metadata:
  name: local-secret-store
spec:
  type: secretstores.local.file
  version: v1
  metadata:
  - name: secretsFile
    value: /mnt/secrets/secrets.json
Use the secrets.
GET http://localhost:<daprPort>/v1.0/secrets/local-secret-store/my-secret
Related links
2.3 - Run Dapr in a serverless offering
If you’d like to run your Dapr applications without managing any of the underlying infrastructure such as VMs or Kubernetes, you can choose a serverless cloud offering. These platforms integrate with Dapr to make it easy to deploy and manage your applications.
Offerings
2.3.1 - Azure Container Apps
Azure Container Apps is a serverless application hosting service where users do not see nor manage any underlying VMs, orchestrators, or other cloud infrastructure. Azure Container Apps enables you to run your application code packaged in multiple containers and is unopinionated about runtimes or programming models that are used.
Dapr is built-in to Container Apps, enabling you to use the Dapr API building blocks without any manual deployment of the Dapr runtime. You simply deploy your services with their Dapr components.
Learn moreTutorial
Visit the Azure docs to try out a microservices tutorial, where you’ll deploy two Dapr-enabled applications to Azure Container Apps.
 Try out Dapr on Container Apps
3 - Manage Dapr configuration
3.1 - Dapr configuration
Dapr configurations are settings and policies that enable you to change both the behavior of individual Dapr applications, or the global behavior of the Dapr control plane system services.
for more information, read the configuration concept.
Application configuration
Set up application configuration
You can set up application configuration either in self-hosted or Kubernetes mode.
In self hosted mode, the Dapr configuration is a configuration file - for example, config.yaml. By default, the Dapr sidecar looks in the default Dapr folder for the runtime configuration:
- Linux/MacOs:
$HOME/.dapr/config.yaml - Windows:
%USERPROFILE%\.dapr\config.yaml
An application can also apply a configuration by using a --config flag to the file path with dapr run CLI command.
In Kubernetes mode, the Dapr configuration is a Configuration resource, that is applied to the cluster. For example:
kubectl apply -f myappconfig.yaml
You can use the Dapr CLI to list the Configuration resources for applications.
dapr configurations -k
A Dapr sidecar can apply a specific configuration by using a dapr.io/config annotation. For example:
  annotations:
    dapr.io/enabled: "true"
    dapr.io/app-id: "nodeapp"
    dapr.io/app-port: "3000"
    dapr.io/config: "myappconfig"
Note: See all Kubernetes annotations available to configure the Dapr sidecar on activation by sidecar Injector system service.
Application configuration settings
The following menu includes all of the configuration settings you can set on the sidecar.
- Tracing
- Metrics
- Logging
- Middleware
- Name resolution
- Scope secret store access
- Access Control allow lists for building block APIs
- Access Control allow lists for service invocation API
- Disallow usage of certain component types
- Turning on preview features
- Example sidecar configuration
Tracing
Tracing configuration turns on tracing for an application.
The tracing section under the Configuration spec contains the following properties:
tracing:
  samplingRate: "1"
  otel:
    endpointAddress: "otelcollector.observability.svc.cluster.local:4317"
  zipkin:
    endpointAddress: "http://zipkin.default.svc.cluster.local:9411/api/v2/spans"
The following table lists the properties for tracing:
| Property | Type | Description |
|---|---|---|
samplingRate | string | Set sampling rate for tracing to be enabled or disabled. |
stdout | bool | True write more verbose information to the traces |
otel.endpointAddress | string | Set the Open Telemetry (OTEL) server address to send traces to. This may or may not require the https:// or http:// depending on your OTEL provider. |
otel.isSecure | bool | Is the connection to the endpoint address encrypted |
otel.protocol | string | Set to http or grpc protocol |
zipkin.endpointAddress | string | Set the Zipkin server address to send traces to. This should include the protocol (http:// or https://) on the endpoint. |
samplingRate
samplingRate is used to enable or disable the tracing. The valid range of samplingRate is between 0 and 1 inclusive. The sampling rate determines whether a trace span should be sampled or not based on value.
samplingRate : "1" samples all traces. By default, the sampling rate is (0.0001), or 1 in 10,000 traces.
To disable the sampling rate, set samplingRate : "0" in the configuration.
otel
The OpenTelemetry (otel) endpoint can also be configured via an environment variable. The presence of the OTEL_EXPORTER_OTLP_ENDPOINT environment variable
turns on tracing for the sidecar.
| Environment Variable | Description |
|---|---|
OTEL_EXPORTER_OTLP_ENDPOINT | Sets the Open Telemetry (OTEL) server address, turns on tracing |
OTEL_EXPORTER_OTLP_INSECURE | Sets the connection to the endpoint as unencrypted (true/false) |
OTEL_EXPORTER_OTLP_PROTOCOL | Transport protocol (grpc, http/protobuf, http/json) |
See Observability distributed tracing for more information.
Metrics
The metrics section under the Configuration spec can be used to enable or disable metrics for an application.
The metrics section contains the following properties:
metrics:
  enabled: true
  rules: []
  latencyDistributionBuckets: []
  http:
    increasedCardinality: true
    pathMatching:
      - /items
      - /orders/{orderID}
      - /orders/{orderID}/items/{itemID}
      - /payments/{paymentID}
      - /payments/{paymentID}/status
      - /payments/{paymentID}/refund
      - /payments/{paymentID}/details
    excludeVerbs: false
  recordErrorCodes: true
In the examples above, the path filter /orders/{orderID}/items/{itemID} would return a single metric count matching all the orderIDs and all the itemIDs, rather than multiple metrics for each itemID. For more information, see HTTP metrics path matching.
The above example also enables recording error code metrics, which is disabled by default.
The following table lists the properties for metrics:
| Property | Type | Description |
|---|---|---|
enabled | boolean | When set to true, the default, enables metrics collection and the metrics endpoint. |
rules | array | Named rule to filter metrics. Each rule contains a set of labels to filter on and a regex expression to apply to the metrics path. |
latencyDistributionBuckets | array | Array of latency distribution buckets in milliseconds for latency metrics histograms. |
http.increasedCardinality | boolean | When set to true (default), in the Dapr HTTP server each request path causes the creation of a new “bucket” of metrics. This can cause issues, including excessive memory consumption, when there many different requested endpoints (such as when interacting with RESTful APIs).To mitigate high memory usage and egress costs associated with high cardinality metrics with the HTTP server, you should set the metrics.http.increasedCardinality property to false. |
http.pathMatching | array | Array of paths for path matching, allowing users to define matching paths to manage cardinality. |
http.excludeVerbs | boolean | When set to true (default is false), the Dapr HTTP server ignores each request HTTP verb when building the method metric label. |
To further help manage cardinality, path matching allows you to match specified paths according to defined patterns, reducing the number of unique metrics paths and thus controlling metric cardinality. This feature is particularly useful for applications with dynamic URLs, ensuring that metrics remain meaningful and manageable without excessive memory consumption.
Using rules, you can set regular expressions for every metric exposed by the Dapr sidecar. For example:
metrics:
  enabled: true
  rules:
    - name: dapr_runtime_service_invocation_req_sent_total
      labels:
      - name: method
        regex:
          "orders/": "orders/.+"
See metrics documentation for more information.
Logging
The logging section under the Configuration spec is used to configure how logging works in the Dapr Runtime.
The logging section contains the following properties:
logging:
  apiLogging:
    enabled: false
    obfuscateURLs: false
    omitHealthChecks: false
The following table lists the properties for logging:
| Property | Type | Description |
|---|---|---|
apiLogging.enabled | boolean | The default value for the --enable-api-logging flag for daprd (and the corresponding dapr.io/enable-api-logging annotation): the value set in the Configuration spec is used as default unless a true or false value is passed to each Dapr Runtime. Default: false. |
apiLogging.obfuscateURLs | boolean | When enabled, obfuscates the values of URLs in HTTP API logs (if enabled), logging the abstract route name rather than the full path being invoked, which could contain Personal Identifiable Information (PII). Default: false. |
apiLogging.omitHealthChecks | boolean | If true, calls to health check endpoints (e.g. /v1.0/healthz) are not logged when API logging is enabled. This is useful if those calls are adding a lot of noise in your logs. Default: false |
See logging documentation for more information.
Middleware
Middleware configuration sets named HTTP pipeline middleware handlers. The httpPipeline and the appHttpPipeline section under the Configuration spec contain the following properties:
httpPipeline: # for incoming http calls
  handlers:
    - name: oauth2
      type: middleware.http.oauth2
    - name: uppercase
      type: middleware.http.uppercase
appHttpPipeline: # for outgoing http calls
  handlers:
    - name: oauth2
      type: middleware.http.oauth2
    - name: uppercase
      type: middleware.http.uppercase
The following table lists the properties for HTTP handlers:
| Property | Type | Description |
|---|---|---|
name | string | Name of the middleware component |
type | string | Type of middleware component |
See Middleware pipelines for more information.
Name resolution component
You can set name resolution components to use within the configuration file. For example, to set the spec.nameResolution.component property to "sqlite", pass configuration options in the spec.nameResolution.configuration dictionary as shown below.
This is a basic example of a configuration resource:
apiVersion: dapr.io/v1alpha1
kind: Configuration
metadata:
  name: appconfig
spec:
  nameResolution:
    component: "sqlite"
    version: "v1"
    configuration:
      connectionString: "/home/user/.dapr/nr.db"
For more information, see:
- The name resolution component documentation for more examples.
- The Configuration file documentation to learn more about how to configure name resolution per component.
Scope secret store access
See the Scoping secrets guide for information and examples on how to scope secrets to an application.
Access Control allow lists for building block APIs
See the guide for selectively enabling Dapr APIs on the Dapr sidecar for information and examples on how to set access control allow lists (ACLs) on the building block APIs lists.
Access Control allow lists for service invocation API
See the Allow lists for service invocation guide for information and examples on how to set allow lists with ACLs which use the service invocation API.
Disallow usage of certain component types
Using the components.deny property in the Configuration spec you can specify a denylist of component types that cannot be initialized.
For example, the configuration below disallows the initialization of components of type bindings.smtp and secretstores.local.file:
apiVersion: dapr.io/v1alpha1
kind: Configuration
metadata:
  name: myappconfig
spec:
  components:
    deny:
      - bindings.smtp
      - secretstores.local.file
Optionally, you can specify a version to disallow by adding it at the end of the component name. For example, state.in-memory/v1 disables initializing components of type state.in-memory and version v1, but does not disable a (hypothetical) v2 version of the component.
Note
When you add the component type secretstores.kubernetes to the denylist, Dapr forbids the creation of additional components of type secretstores.kubernetes.
However, it does not disable the built-in Kubernetes secret store, which is:
- Created by Dapr automatically
- Used to store secrets specified in Components specs
If you want to disable the built-in Kubernetes secret store, you need to use the dapr.io/disable-builtin-k8s-secret-store annotation.
Turning on preview features
See the preview features guide for information and examples on how to opt-in to preview features for a release.
Enabling preview features unlock new capabilities to be added for dev/test, since they still need more time before becoming generally available (GA) in the runtime.
Example sidecar configuration
The following YAML shows an example configuration file that can be applied to an applications’ Dapr sidecar.
apiVersion: dapr.io/v1alpha1
kind: Configuration
metadata:
  name: myappconfig
  namespace: default
spec:
  tracing:
    samplingRate: "1"
    stdout: true
    otel:
      endpointAddress: "localhost:4317"
      isSecure: false
      protocol: "grpc"
  httpPipeline:
    handlers:
      - name: oauth2
        type: middleware.http.oauth2
  secrets:
    scopes:
      - storeName: localstore
        defaultAccess: allow
        deniedSecrets: ["redis-password"]
  components:
    deny:
      - bindings.smtp
      - secretstores.local.file
  accessControl:
    defaultAction: deny
    trustDomain: "public"
    policies:
      - appId: app1
        defaultAction: deny
        trustDomain: 'public'
        namespace: "default"
        operations:
          - name: /op1
            httpVerb: ['POST', 'GET']
            action: deny
          - name: /op2/*
            httpVerb: ["*"]
            action: allow
Control plane configuration
A single configuration file called daprsystem is installed with the Dapr control plane system services that applies global settings.
This is only set up when Dapr is deployed to Kubernetes.
Control plane configuration settings
A Dapr control plane configuration contains the following sections:
mtlsfor mTLS (Mutual TLS)
mTLS (Mutual TLS)
The mtls section contains properties for mTLS.
| Property | Type | Description |
|---|---|---|
enabled | bool | If true, enables mTLS for communication between services and apps in the cluster. |
allowedClockSkew | string | Allowed tolerance when checking the expiration of TLS certificates, to allow for clock skew. Follows the format used by Go’s time.ParseDuration. Default is 15m (15 minutes). |
workloadCertTTL | string | How long a certificate TLS issued by Dapr is valid for. Follows the format used by Go’s time.ParseDuration. Default is 24h (24 hours). |
sentryAddress | string | Hostname port address for connecting to the Sentry server. |
controlPlaneTrustDomain | string | Trust domain for the control plane. This is used to verify connection to control plane services. |
tokenValidators | array | Additional Sentry token validators to use for authenticating certificate requests. |
See the mTLS how-to and security concepts for more information.
Example control plane configuration
apiVersion: dapr.io/v1alpha1
kind: Configuration
metadata:
  name: daprsystem
  namespace: default
spec:
  mtls:
    enabled: true
    allowedClockSkew: 15m
    workloadCertTTL: 24h
Next steps
Learn about concurrency and rate limits3.2 - How-To: Control concurrency and rate limit applications
Typically, in distributed computing, you may only want to allow for a given number of requests to execute concurrently. Using Dapr’s app-max-concurrency, you can control how many requests and events can invoke your application simultaneously.
Default app-max-concurreny is set to -1, meaning no concurrency limit is enforced.
Different approaches
While this guide focuses on app-max-concurrency, you can also limit request rate per second using the middleware.http.ratelimit middleware. However, it’s important to understand the difference between the two approaches:
middleware.http.ratelimit: Time bound and limits the number of requests per secondapp-max-concurrency: Specifies the max number of concurrent requests (and events) at any point of time.
See Rate limit middleware for more information about that approach.
Demo
Watch this video on how to control concurrency and rate limiting.
Configure app-max-concurrency
Without using Dapr, you would need to create some sort of a semaphore in the application and take care of acquiring and releasing it.
Using Dapr, you don’t need to make any code changes to your application.
Select how you’d like to configure app-max-concurrency.
To set concurrency limits with the Dapr CLI for running on your local dev machine, add the app-max-concurrency flag:
dapr run --app-max-concurrency 1 --app-port 5000 python ./app.py
The above example effectively turns your app into a sequential processing service.
To configure concurrency limits in Kubernetes, add the following annotation to your pod:
apiVersion: apps/v1
kind: Deployment
metadata:
  name: nodesubscriber
  namespace: default
  labels:
    app: nodesubscriber
spec:
  replicas: 1
  selector:
    matchLabels:
      app: nodesubscriber
  template:
    metadata:
      labels:
        app: nodesubscriber
      annotations:
        dapr.io/enabled: "true"
        dapr.io/app-id: "nodesubscriber"
        dapr.io/app-port: "3000"
        dapr.io/app-max-concurrency: "1"
#...
Limitations
Controlling concurrency on external requests
Rate limiting is guaranteed for every event coming from Dapr, including pub/sub events, direct invocation from other services, bindings events, etc. However, Dapr can’t enforce the concurrency policy on requests that are coming to your app externally.
Related links
Next steps
Limit secret store access3.3 - How-To: Limit the secrets that can be read from secret stores
In addition to scoping which applications can access a given component, you can also scope a named secret store component to one or more secrets for an application. By defining allowedSecrets and/or deniedSecrets lists, you restrict applications to access only specific secrets.
In addition to scoping which applications can access a given component, you can also scope a named secret store component to one or more secrets for an application. By defining allowedSecrets and/or deniedSecrets lists, you restrict applications to access only specific secrets.
For more information about configuring a Configuration resource:
- Configuration overview
- Configuration schema For more information about configuring a Configuration resource:
- Configuration overview
- Configuration schema
Configure secrets access
The secrets section under the Configuration spec contains the following properties:
secrets:
  scopes:
    - storeName: kubernetes
      defaultAccess: allow
      allowedSecrets: ["redis-password"]
    - storeName: localstore
      defaultAccess: allow
      deniedSecrets: ["redis-password"]
The following table lists the properties for secret scopes:
| Property | Type | Description |
|---|---|---|
| storeName | string | Name of the secret store component. storeName must be unique within the list |
| defaultAccess | string | Access modifier. Accepted values “allow” (default) or “deny” |
| allowedSecrets | list | List of secret keys that can be accessed |
| deniedSecrets | list | List of secret keys that cannot be accessed |
When an allowedSecrets list is present with at least one element, only those secrets defined in the list can be accessed by the application.
Permission priority
The allowedSecrets and deniedSecrets list values take priority over the defaultAccess. See how this works in the following example scenarios:
| Scenarios | defaultAccess | allowedSecrets | deniedSecrets | permission | |
|---|---|---|---|---|---|
| 1 | Only default access | deny/allow | empty | empty | deny/allow |
| 2 | Default deny with allowed list | deny | ["s1"] | empty | only "s1" can be accessed |
| 3 | Default allow with denied list | allow | empty | ["s1"] | only "s1" cannot be accessed |
| 4 | Default allow with allowed list | allow | ["s1"] | empty | only "s1" can be accessed |
| 5 | Default deny with denied list | deny | empty | ["s1"] | deny |
| 6 | Default deny/allow with both lists | deny/allow | ["s1"] | ["s2"] | only "s1" can be accessed |
Examples
Scenario 1: Deny access to all secrets for a secret store
In a Kubernetes cluster, the native Kubernetes secret store is added to your Dapr application by default. In some scenarios, it may be necessary to deny access to Dapr secrets for a given application. To add this configuration: In a Kubernetes cluster, the native Kubernetes secret store is added to your Dapr application by default. In some scenarios, it may be necessary to deny access to Dapr secrets for a given application. To add this configuration:
Define the following
appconfig.yaml.Define the following
appconfig.yaml.apiVersion: dapr.io/v1alpha1 kind: Configuration metadata: name: appconfig spec: secrets: scopes: - storeName: kubernetes defaultAccess: denyapiVersion: dapr.io/v1alpha1 kind: Configuration metadata: name: appconfig spec: secrets: scopes: - storeName: kubernetes defaultAccess: denyApply it to the Kubernetes cluster using the following command:
kubectl apply -f appconfig.yaml`.
For applications that you need to deny access to the Kubernetes secret store, follow the Kubernetes instructions, adding the following annotation to the application pod.
Apply it to the Kubernetes cluster using the following command:
kubectl apply -f appconfig.yaml`.
For applications that you need to deny access to the Kubernetes secret store, follow the Kubernetes instructions, adding the following annotation to the application pod.
dapr.io/config: appconfig
With this defined, the application no longer has access to Kubernetes secret store.
Scenario 2: Allow access to only certain secrets in a secret store
Scenario 2: Allow access to only certain secrets in a secret store
To allow a Dapr application to have access to only certain secrets, define the following config.yaml:
apiVersion: dapr.io/v1alpha1
kind: Configuration
metadata:
  name: appconfig
spec:
  secrets:
    scopes:
      - storeName: vault
        defaultAccess: deny
        allowedSecrets: ["secret1", "secret2"]
This example defines configuration for secret store named vault. The default access to the secret store is deny. Meanwhile, some secrets are accessible by the application based on the allowedSecrets list. Follow the Sidecar configuration instructions to apply configuration to the sidecar.
This example defines configuration for secret store named vault. The default access to the secret store is deny. Meanwhile, some secrets are accessible by the application based on the allowedSecrets list. Follow the Sidecar configuration instructions to apply configuration to the sidecar.
Scenario 3: Deny access to certain sensitive secrets in a secret store
Define the following config.yaml:
apiVersion: dapr.io/v1alpha1
kind: Configuration
metadata:
  name: appconfig
spec:
  secrets:
    scopes:
      - storeName: vault
        defaultAccess: allow # this is the default value, line can be omitted
        deniedSecrets: ["secret1", "secret2"]
This configuration explicitly denies access to secret1 and secret2 from the secret store named vault, while allowing access to all other secrets. Follow the Sidecar configuration instructions to apply configuration to the sidecar.
Next steps
Service invocation access controlThis configuration explicitly denies access to secret1 and secret2 from the secret store named vault, while allowing access to all other secrets. Follow the Sidecar configuration instructions to apply configuration to the sidecar.
Next steps
Service invocation access control3.4 - How-To: Apply access control list configuration for service invocation
Using access control, you can configure policies that restrict what the operations calling applications can perform, via service invocation, on the called application. You can define an access control policy specification in the Configuration schema to limit access:
- To a called application from specific operations, and
- To HTTP verbs from the calling applications.
An access control policy is specified in Configuration and applied to the Dapr sidecar for the called application. Access to the called app is based on the matched policy action.
You can provide a default global action for all calling applications. If no access control policy is specified, the default behavior is to allow all calling applications to access to the called app.
See examples of access policies.
Terminology
trustDomain
A “trust domain” is a logical group that manages trust relationships. Every application is assigned a trust domain, which can be specified in the access control list policy spec. If no policy spec is defined or an empty trust domain is specified, then a default value “public” is used. This trust domain is used to generate the identity of the application in the TLS cert.
App Identity
Dapr requests the sentry service to generate a SPIFFE ID for all applications. This ID is attached in the TLS cert.
The SPIFFE ID is of the format: **spiffe://\<trustdomain>/ns/\<namespace\>/\<appid\>**.
For matching policies, the trust domain, namespace, and app ID values of the calling app are extracted from the SPIFFE ID in the TLS cert of the calling app. These values are matched against the trust domain, namespace, and app ID values specified in the policy spec. If all three of these match, then more specific policies are further matched.
Configuration properties
The following tables lists the different properties for access control, policies, and operations:
Access Control
| Property | Type | Description |
|---|---|---|
defaultAction | string | Global default action when no other policy is matched |
trustDomain | string | Trust domain assigned to the application. Default is “public”. |
policies | string | Policies to determine what operations the calling app can do on the called app |
Policies
| Property | Type | Description |
|---|---|---|
app | string | AppId of the calling app to allow/deny service invocation from |
namespace | string | Namespace value that needs to be matched with the namespace of the calling app |
trustDomain | string | Trust domain that needs to be matched with the trust domain of the calling app. Default is “public” |
defaultAction | string | App level default action in case the app is found but no specific operation is matched |
operations | string | operations that are allowed from the calling app |
Operations
| Property | Type | Description |
|---|---|---|
name | string | Path name of the operations allowed on the called app. Wildcard “*” can be used in a path to match. Wildcard “**” can be used to match under multiple paths. |
httpVerb | list | List specific http verbs that can be used by the calling app. Wildcard “*” can be used to match any http verb. Unused for grpc invocation. |
action | string | Access modifier. Accepted values “allow” (default) or “deny” |
Policy rules
- If no access policy is specified, the default behavior is to allow all apps to access to all methods on the called app.
- If no global default action is specified and no app specific policies defined, the empty access policy is treated like no access policy is specified. The default behavior is to allow all apps to access to all methods on the called app.
- If no global default action is specified but some app specific policies have been defined, then we resort to a more secure option of assuming the global default action to deny access to all methods on the called app.
- If an access policy is defined and if the incoming app credentials cannot be verified, then the global default action takes effect.
- If either the trust domain or namespace of the incoming app do not match the values specified in the app policy, the app policy is ignored and the global default action takes effect.
Policy priority
The action corresponding to the most specific policy matched takes effect as ordered below:
- Specific HTTP verbs in the case of HTTP or the operation level action in the case of GRPC.
- The default action at the app level
- The default action at the global level
Example scenarios
Below are some example scenarios for using access control list for service invocation. See configuration guidance to understand the available configuration settings for an application sidecar.
Scenario 1:
Deny access to all apps except where trustDomain = public, namespace = default, appId = app1
With this configuration, all calling methods with appId = app1 are allowed. All other invocation requests from other applications are denied.
apiVersion: dapr.io/v1alpha1
kind: Configuration
metadata:
  name: appconfig
spec:
  accessControl:
    defaultAction: deny
    trustDomain: "public"
    policies:
    - appId: app1
      defaultAction: allow
      trustDomain: 'public'
      namespace: "default"
Scenario 2:
Deny access to all apps except trustDomain = public, namespace = default, appId = app1, operation = op1
With this configuration, only the method op1 from appId = app1 is allowed. All other method requests from all other apps, including other methods on app1, are denied.
apiVersion: dapr.io/v1alpha1
kind: Configuration
metadata:
  name: appconfig
spec:
  accessControl:
    defaultAction: deny
    trustDomain: "public"
    policies:
    - appId: app1
      defaultAction: deny
      trustDomain: 'public'
      namespace: "default"
      operations:
      - name: /op1
        httpVerb: ['*']
        action: allow
Scenario 3:
Deny access to all apps except when a specific verb for HTTP and operation for GRPC is matched
With this configuration, only the scenarios below are allowed access. All other method requests from all other apps, including other methods on app1 or app2, are denied.
trustDomain=public,namespace=default,appID=app1,operation=op1,httpVerb=POST/PUTtrustDomain="myDomain",namespace="ns1",appID=app2,operation=op2and application protocol is GRPC
Only the httpVerb POST/PUT on method op1 from appId = app1 are allowe. All other method requests from all other apps, including other methods on app1, are denied.
apiVersion: dapr.io/v1alpha1
kind: Configuration
metadata:
  name: appconfig
spec:
  accessControl:
    defaultAction: deny
    trustDomain: "public"
    policies:
    - appId: app1
      defaultAction: deny
      trustDomain: 'public'
      namespace: "default"
      operations:
      - name: /op1
        httpVerb: ['POST', 'PUT']
        action: allow
    - appId: app2
      defaultAction: deny
      trustDomain: 'myDomain'
      namespace: "ns1"
      operations:
      - name: /op2
        action: allow
Scenario 4:
Allow access to all methods except trustDomain = public, namespace = default, appId = app1, operation = /op1/*, all httpVerb
apiVersion: dapr.io/v1alpha1
kind: Configuration
metadata:
  name: appconfig
spec:
  accessControl:
    defaultAction: allow
    trustDomain: "public"
    policies:
    - appId: app1
      defaultAction: allow
      trustDomain: 'public'
      namespace: "default"
      operations:
      - name: /op1/*
        httpVerb: ['*']
        action: deny
Scenario 5:
Allow access to all methods for trustDomain = public, namespace = ns1, appId = app1 and deny access to all methods for trustDomain = public, namespace = ns2, appId = app1
This scenario shows how applications with the same app ID while belonging to different namespaces can be specified.
apiVersion: dapr.io/v1alpha1
kind: Configuration
metadata:
  name: appconfig
spec:
  accessControl:
    defaultAction: allow
    trustDomain: "public"
    policies:
    - appId: app1
      defaultAction: allow
      trustDomain: 'public'
      namespace: "ns1"
    - appId: app1
      defaultAction: deny
      trustDomain: 'public'
      namespace: "ns2"
Scenario 6:
Allow access to all methods except trustDomain = public, namespace = default, appId = app1, operation = /op1/**/a, all httpVerb
apiVersion: dapr.io/v1alpha1
kind: Configuration
metadata:
  name: appconfig
spec:
  accessControl:
    defaultAction: allow
    trustDomain: "public"
    policies:
    - appId: app1
      defaultAction: allow
      trustDomain: 'public'
      namespace: "default"
      operations:
      - name: /op1/**/a
        httpVerb: ['*']
        action: deny
“hello world” examples
In these examples, you learn how to apply access control to the hello world tutorials.
Access control lists rely on the Dapr Sentry service to generate the TLS certificates with a SPIFFE ID for authentication. This means the Sentry service either has to be running locally or deployed to your hosting environment, such as a Kubernetes cluster.
The nodeappconfig example below shows how to deny access to the neworder method from the pythonapp, where the Python app is in the myDomain trust domain and default namespace. The Node.js app is in the public trust domain.
nodeappconfig.yaml
apiVersion: dapr.io/v1alpha1
kind: Configuration
metadata:
  name: nodeappconfig
spec:
  tracing:
    samplingRate: "1"
  accessControl:
    defaultAction: allow
    trustDomain: "public"
    policies:
    - appId: pythonapp
      defaultAction: allow
      trustDomain: 'myDomain'
      namespace: "default"
      operations:
      - name: /neworder
        httpVerb: ['POST']
        action: deny
pythonappconfig.yaml
apiVersion: dapr.io/v1alpha1
kind: Configuration
metadata:
  name: pythonappconfig
spec:
  tracing:
    samplingRate: "1"
  accessControl:
    defaultAction: allow
    trustDomain: "myDomain"
Self-hosted mode
When walking through this tutorial, you:
- Run the Sentry service locally with mTLS enabled
- Set up necessary environment variables to access certificates
- Launch both the Node app and Python app each referencing the Sentry service to apply the ACLs
Prerequisites
- Become familiar with running Sentry service in self-hosted mode with mTLS enabled
- Clone the hello world tutorial
Run the Node.js app
In a command prompt, set these environment variables:
  ```bash
  export DAPR_TRUST_ANCHORS=`cat $HOME/.dapr/certs/ca.crt`
  export DAPR_CERT_CHAIN=`cat $HOME/.dapr/certs/issuer.crt`
  export DAPR_CERT_KEY=`cat $HOME/.dapr/certs/issuer.key`
  export NAMESPACE=default
  ```
```powershell $env:DAPR_TRUST_ANCHORS=$(Get-Content -raw $env:USERPROFILE\.dapr\certs\ca.crt) $env:DAPR_CERT_CHAIN=$(Get-Content -raw $env:USERPROFILE\.dapr\certs\issuer.crt) $env:DAPR_CERT_KEY=$(Get-Content -raw $env:USERPROFILE\.dapr\certs\issuer.key) $env:NAMESPACE="default" ```Run daprd to launch a Dapr sidecar for the Node.js app with mTLS enabled, referencing the local Sentry service:
daprd --app-id nodeapp --dapr-grpc-port 50002 -dapr-http-port 3501 --log-level debug --app-port 3000 --enable-mtls --sentry-address localhost:50001 --config nodeappconfig.yamlRun the Node.js app in a separate command prompt:
node app.js
Run the Python app
In another command prompt, set these environment variables:
```bash export DAPR_TRUST_ANCHORS=`cat $HOME/.dapr/certs/ca.crt` export DAPR_CERT_CHAIN=`cat $HOME/.dapr/certs/issuer.crt` export DAPR_CERT_KEY=`cat $HOME/.dapr/certs/issuer.key` export NAMESPACE=default$env:DAPR_TRUST_ANCHORS=$(Get-Content -raw $env:USERPROFILE\.dapr\certs\ca.crt) $env:DAPR_CERT_CHAIN=$(Get-Content -raw $env:USERPROFILE\.dapr\certs\issuer.crt) $env:DAPR_CERT_KEY=$(Get-Content -raw $env:USERPROFILE\.dapr\certs\issuer.key) $env:NAMESPACE="default"Run daprd to launch a Dapr sidecar for the Python app with mTLS enabled, referencing the local Sentry service:
daprd --app-id pythonapp --dapr-grpc-port 50003 --metrics-port 9092 --log-level debug --enable-mtls --sentry-address localhost:50001 --config pythonappconfig.yamlRun the Python app in a separate command prompt:
python app.py
You should see the calls to the Node.js app fail in the Python app command prompt, due to the deny operation action in the nodeappconfig file. Change this action to allow and re-run the apps to see this call succeed.
Kubernetes mode
Prerequisites
- Become familiar with running Sentry service in self-hosted mode with mTLS enabled
- Clone the hello world tutorial
Configure the Node.js and Python apps
You can create and apply the above nodeappconfig.yaml and pythonappconfig.yaml configuration files, as described in the configuration.
For example, the Kubernetes Deployment below is how the Python app is deployed to Kubernetes in the default namespace with this pythonappconfig configuration file.
Do the same for the Node.js deployment and look at the logs for the Python app to see the calls fail due to the deny operation action set in the nodeappconfig file.
Change this action to allow and re-deploy the apps to see this call succeed.
Deployment YAML example
apiVersion: apps/v1
kind: Deployment
metadata:
name: pythonapp
namespace: default
labels:
app: python
spec:
replicas: 1
selector:
matchLabels:
app: python
template:
metadata:
labels:
app: python
annotations:
dapr.io/enabled: "true"
dapr.io/app-id: "pythonapp"
dapr.io/config: "pythonappconfig"
spec:
containers:
- name: python
image: dapriosamples/hello-k8s-python:edge
Demo
Watch this video on how to apply access control list for service invocation.
Next steps
Dapr APIs allow list3.5 - How-To: Selectively enable Dapr APIs on the Dapr sidecar
In scenarios such as zero trust networks or when exposing the Dapr sidecar to external traffic through a frontend, it’s recommended to only enable the Dapr sidecar APIs being used by the app. Doing so reduces the attack surface and helps keep the Dapr APIs scoped to the actual needs of the application.
Dapr allows you to control which APIs are accessible to the application by setting an API allowlist or denylist using a Dapr Configuration.
Default behavior
If no API allowlist or denylist is specified, the default behavior is to allow access to all Dapr APIs.
- If you’ve only defined a denylist, all Dapr APIs are allowed except those defined in the denylist
- If you’ve only defined an allowlist, only the Dapr APIs listed in the allowlist are allowed
- If you’ve defined both an allowlist and a denylist, the denylist overrides the allowlist for APIs that are defined in both.
- If neither is defined, all APIs are allowed.
For example, the following configuration enables all APIs for both HTTP and gRPC:
apiVersion: dapr.io/v1alpha1
kind: Configuration
metadata:
name: myappconfig
namespace: default
spec:
tracing:
samplingRate: "1"
Using an allowlist
Enabling specific HTTP APIs
The following example enables the state v1.0 HTTP API and blocks all other HTTP APIs:
apiVersion: dapr.io/v1alpha1
kind: Configuration
metadata:
name: myappconfig
namespace: default
spec:
api:
allowed:
- name: state
version: v1.0
protocol: http
Enabling specific gRPC APIs
The following example enables the state v1 gRPC API and blocks all other gRPC APIs:
apiVersion: dapr.io/v1alpha1
kind: Configuration
metadata:
name: myappconfig
namespace: default
spec:
api:
allowed:
- name: state
version: v1
protocol: grpc
Using a denylist
Disabling specific HTTP APIs
The following example disables the state v1.0 HTTP API, allowing all other HTTP APIs:
apiVersion: dapr.io/v1alpha1
kind: Configuration
metadata:
name: myappconfig
namespace: default
spec:
api:
denied:
- name: state
version: v1.0
protocol: http
Disabling specific gRPC APIs
The following example disables the state v1 gRPC API, allowing all other gRPC APIs:
apiVersion: dapr.io/v1alpha1
kind: Configuration
metadata:
name: myappconfig
namespace: default
spec:
api:
denied:
- name: state
version: v1
protocol: grpc
List of Dapr APIs
The name field takes the name of the Dapr API you would like to enable.
See this list of values corresponding to the different Dapr APIs:
| API group | HTTP API | gRPC API |
|---|---|---|
| Service Invocation | invoke (v1.0) | invoke (v1) |
| State | state (v1.0 and v1.0-alpha1) | state (v1 and v1alpha1) |
| Pub/Sub | publish (v1.0 and v1.0-alpha1) | publish (v1 and v1alpha1) |
| Output Bindings | bindings (v1.0) | bindings (v1) |
| Subscribe | n/a | subscribe (v1alpha1) |
| Secrets | secrets (v1.0) | secrets (v1) |
| Actors | actors (v1.0) | actors (v1) |
| Metadata | metadata (v1.0) | metadata (v1) |
| Configuration | configuration (v1.0 and v1.0-alpha1) | configuration (v1 and v1alpha1) |
| Distributed Lock | lock (v1.0-alpha1)unlock (v1.0-alpha1) | lock (v1alpha1)unlock (v1alpha1) |
| Cryptography | crypto (v1.0-alpha1) | crypto (v1alpha1) |
| Workflow | workflows (v1.0) | workflows (v1) |
| Conversation | conversation (v1.0-alpha1) | conversation (v1alpha1) |
| Health | healthz (v1.0) | n/a |
| Shutdown | shutdown (v1.0) | shutdown (v1) |
Next steps
Configure Dapr to use gRPC3.6 - How-To: Configure Dapr to use gRPC
Dapr implements both an HTTP and a gRPC API for local calls. gRPC is useful for low-latency, high performance scenarios and has language integration using the proto clients. You can see the full list of auto-generated clients (Dapr SDKs).
The Dapr runtime implements a proto service that apps can communicate with via gRPC.
Not only can you call Dapr via gRPC, Dapr can communicate with an application via gRPC. To do that, the app needs to host a gRPC server and implement the Dapr appcallback service
Configuring Dapr to communicate with an app via gRPC
When running in self hosted mode, use the --app-protocol flag to tell Dapr to use gRPC to talk to the app:
dapr run --app-protocol grpc --app-port 5005 node app.js
This tells Dapr to communicate with your app via gRPC over port 5005.
On Kubernetes, set the following annotations in your deployment YAML:
apiVersion: apps/v1
kind: Deployment
metadata:
name: myapp
namespace: default
labels:
app: myapp
spec:
replicas: 1
selector:
matchLabels:
app: myapp
template:
metadata:
labels:
app: myapp
annotations:
dapr.io/enabled: "true"
dapr.io/app-id: "myapp"
dapr.io/app-protocol: "grpc"
dapr.io/app-port: "5005"
#...
Next steps
Handle large HTTP header sizes3.7 - How-To: Handle large HTTP header size
Dapr has a default limit of 4KB for the HTTP header read buffer size. If you’re sending HTTP headers larger than the default 4KB, you may encounter a Too big request header service invocation error.
You can increase the HTTP header size by using:
- The
dapr.io/http-read-buffer-sizeannotation, or - The
--dapr-http-read-buffer-sizeflag when using the CLI.
When running in self-hosted mode, use the --dapr-http-read-buffer-size flag to configure Dapr to use non-default http header size:
dapr run --dapr-http-read-buffer-size 16 node app.js
This tells Dapr to set maximum read buffer size to 16 KB.
On Kubernetes, set the following annotations in your deployment YAML:
apiVersion: apps/v1
kind: Deployment
metadata:
name: myapp
namespace: default
labels:
app: myapp
spec:
replicas: 1
selector:
matchLabels:
app: myapp
template:
metadata:
labels:
app: myapp
annotations:
dapr.io/enabled: "true"
dapr.io/app-id: "myapp"
dapr.io/app-port: "8000"
dapr.io/http-read-buffer-size: "16"
#...
Related links
Dapr Kubernetes pod annotations spec
Next steps
Handle large HTTP body requests3.8 - How-To: Handle large http body requests
By default, Dapr has a limit for the request body size, set to 4MB. You can change this by defining:
- The
dapr.io/http-max-request-sizeannotation, or - The
--dapr-http-max-request-sizeflag.
When running in self-hosted mode, use the --dapr-http-max-request-size flag to configure Dapr to use non-default request body size:
dapr run --dapr-http-max-request-size 16 node app.js
This tells Dapr to set maximum request body size to 16 MB.
On Kubernetes, set the following annotations in your deployment YAML:
apiVersion: apps/v1
kind: Deployment
metadata:
name: myapp
namespace: default
labels:
app: myapp
spec:
replicas: 1
selector:
matchLabels:
app: myapp
template:
metadata:
labels:
app: myapp
annotations:
dapr.io/enabled: "true"
dapr.io/app-id: "myapp"
dapr.io/app-port: "8000"
dapr.io/http-max-request-size: "16"
#...
Related links
Dapr Kubernetes pod annotations spec
Next steps
Install sidecar certificates3.9 - How-To: Install certificates in the Dapr sidecar
The Dapr sidecar can be configured to trust certificates for communicating with external services. This is useful in scenarios where a self-signed certificate needs to be trusted, such as:
- Using an HTTP binding
- Configuring an outbound proxy for the sidecar
Both certificate authority (CA) certificates and leaf certificates are supported.
You can make the following configurations when the sidecar is running as a container.
- Configure certificates to be available to the sidecar container using volume mounts.
- Point the environment variable
SSL_CERT_DIRin the sidecar container to the directory containing the certificates.
Note: For Windows containers, make sure the container is running with administrator privileges so it can install the certificates.
The following example uses Docker Compose to install certificates (present locally in the ./certificates directory) in the sidecar container:
version: '3'
services:
dapr-sidecar:
image: "daprio/daprd:edge" # dapr version must be at least v1.8
command: [
"./daprd",
"-app-id", "myapp",
"-app-port", "3000",
]
volumes:
- "./components/:/components"
- "./certificates:/certificates" # (STEP 1) Mount the certificates folder to the sidecar container
environment:
- "SSL_CERT_DIR=/certificates" # (STEP 2) Set the environment variable to the path of the certificates folder
# Uncomment the line below for Windows containers
# user: ContainerAdministrator
Note: When the sidecar is not running inside a container, certificates must be directly installed on the host operating system.
On Kubernetes:
- Configure certificates to be available to the sidecar container using a volume mount.
- Point the environment variable
SSL_CERT_DIRin the sidecar container to the directory containing the certificates.
The following example YAML shows a deployment that:
- Attaches a pod volume to the sidecar
- Sets
SSL_CERT_DIRto install the certificates
apiVersion: apps/v1
kind: Deployment
metadata:
name: myapp
namespace: default
labels:
app: myapp
spec:
replicas: 1
selector:
matchLabels:
app: myapp
template:
metadata:
labels:
app: myapp
annotations:
dapr.io/enabled: "true"
dapr.io/app-id: "myapp"
dapr.io/app-port: "8000"
dapr.io/volume-mounts: "certificates-vol:/tmp/certificates" # (STEP 1) Mount the certificates folder to the sidecar container
dapr.io/env: "SSL_CERT_DIR=/tmp/certificates" # (STEP 2) Set the environment variable to the path of the certificates folder
spec:
volumes:
- name: certificates-vol
hostPath:
path: /certificates
#...
Note: When using Windows containers, the sidecar container is started with admin privileges, which is required to install the certificates. This does not apply to Linux containers.
After following these steps, all the certificates in the directory pointed by SSL_CERT_DIR are installed.
- On Linux containers: All the certificate extensions supported by OpenSSL are supported. Learn more.
- On Windows container: All the certificate extensions supported by
certoc.exeare supported. See certoc.exe present in Windows Server Core.
Demo
Watch the demo on using installing SSL certificates and securely using the HTTP binding in community call 64:
Related links
- HTTP binding spec
- (Kubernetes) How-to: Mount Pod volumes to the Dapr sidecar
- Dapr Kubernetes pod annotations spec
Next steps
Enable preview features3.10 - How-To: Enable preview features
Preview features in Dapr are considered experimental when they are first released. These preview features require you to explicitly opt-in to use them. You specify this opt-in in Dapr’s Configuration file.
Preview features are enabled on a per application basis by setting configuration when running an application instance.
Configuration properties
The features section under the Configuration spec contains the following properties:
| Property | Type | Description |
|---|---|---|
name | string | The name of the preview feature that is enabled/disabled |
enabled | bool | Boolean specifying if the feature is enabled or disabled |
Enabling a preview feature
Preview features are specified in the configuration. Here is an example of a full configuration that contains multiple features:
apiVersion: dapr.io/v1alpha1
kind: Configuration
metadata:
name: featureconfig
spec:
tracing:
samplingRate: "1"
zipkin:
endpointAddress: "http://zipkin.default.svc.cluster.local:9411/api/v2/spans"
features:
- name: Feature1
enabled: true
- name: Feature2
enabled: true
To enable preview features when running Dapr locally, either update the default configuration or specify a separate config file using dapr run.
The default Dapr config is created when you run dapr init, and is located at:
- Windows:
%USERPROFILE%\.dapr\config.yaml - Linux/macOS:
~/.dapr/config.yaml
Alternately, you can update preview features on all apps run locally by specifying the --config flag in dapr run and pointing to a separate Dapr config file:
dapr run --app-id myApp --config ./previewConfig.yaml ./app
In Kubernetes mode, the configuration must be provided via a configuration component. Using the same configuration as above, apply it via kubectl:
kubectl apply -f previewConfig.yaml
This configuration component can then be referenced in any application by modifying the application’s configuration to reference that specific configuration component via the dapr.io/config element. For example:
apiVersion: apps/v1
kind: Deployment
metadata:
name: nodeapp
labels:
app: node
spec:
replicas: 1
selector:
matchLabels:
app: node
template:
metadata:
labels:
app: node
annotations:
dapr.io/enabled: "true"
dapr.io/app-id: "nodeapp"
dapr.io/app-port: "3000"
dapr.io/config: "featureconfig"
spec:
containers:
- name: node
image: dapriosamples/hello-k8s-node:latest
ports:
- containerPort: 3000
imagePullPolicy: Always
Next steps
Configuration schema3.11 - How-To: Configure Environment Variables from Secrets for Dapr sidecar
In special cases, the Dapr sidecar needs an environment variable injected into it. This use case may be required by a component, a 3rd party library, or a module that uses environment variables to configure the said component or customize its behavior. This can be useful for both production and non-production environments.
Overview
In Dapr 1.15, the new dapr.io/env-from-secret annotation was introduced, similar to dapr.io/env.
With this annotation, you can inject an environment variable into the Dapr sidecar, with a value from a secret.
Annotation format
The values of this annotation are formatted like so:
- Single key secret:
<ENV_VAR_NAME>=<SECRET_NAME> - Multi key/value secret:
<ENV_VAR_NAME>=<SECRET_NAME>:<SECRET_KEY>
<ENV_VAR_NAME> is required to follow the C_IDENTIFIER format and captured by the [A-Za-z_][A-Za-z0-9_]* regex:
- Must start with a letter or underscore
- The rest of the identifier contains letters, digits, or underscores
The name field is required due to the restriction of the secretKeyRef, so both name and key must be set. Learn more from the “env.valueFrom.secretKeyRef.name” section in this Kubernetes documentation.
In this case, Dapr sets both to the same value.
Configuring single key secret environment variable
In the following example, the dapr.io/env-from-secret annotation is added to the Deployment.
apiVersion: apps/v1
kind: Deployment
metadata:
name: nodeapp
spec:
template:
metadata:
annotations:
dapr.io/enabled: "true"
dapr.io/app-id: "nodeapp"
dapr.io/app-port: "3000"
dapr.io/env-from-secret: "AUTH_TOKEN=auth-headers-secret"
spec:
containers:
- name: node
image: dapriosamples/hello-k8s-node:latest
ports:
- containerPort: 3000
imagePullPolicy: Always
The dapr.io/env-from-secret annotation with a value of "AUTH_TOKEN=auth-headers-secret" is injected as:
env:
- name: AUTH_TOKEN
valueFrom:
secretKeyRef:
name: auth-headers-secret
key: auth-headers-secret
This requires the secret to have both name and key fields with the same value, “auth-headers-secret”.
Example secret
Note: The following example is for demo purposes only. It’s not recommended to store secrets in plain text.
apiVersion: v1
kind: Secret
metadata:
name: auth-headers-secret
type: Opaque
stringData:
auth-headers-secret: "AUTH=mykey"
Configuring multi-key secret environment variable
In the following example, the dapr.io/env-from-secret annotation is added to the Deployment.
apiVersion: apps/v1
kind: Deployment
metadata:
name: nodeapp
spec:
template:
metadata:
annotations:
dapr.io/enabled: "true"
dapr.io/app-id: "nodeapp"
dapr.io/app-port: "3000"
dapr.io/env-from-secret: "AUTH_TOKEN=auth-headers-secret:auth-header-value"
spec:
containers:
- name: node
image: dapriosamples/hello-k8s-node:latest
ports:
- containerPort: 3000
imagePullPolicy: Always
The dapr.io/env-from-secret annotation with a value of "AUTH_TOKEN=auth-headers-secret:auth-header-value" is injected as:
env:
- name: AUTH_TOKEN
valueFrom:
secretKeyRef:
name: auth-headers-secret
key: auth-header-value
Example secret
Note: The following example is for demo purposes only. It’s not recommended to store secrets in plain text.
apiVersion: v1
kind: Secret
metadata:
name: auth-headers-secret
type: Opaque
stringData:
auth-header-value: "AUTH=mykey"
4 - Managing components in Dapr
4.1 - Certification lifecycle
Note
Certification lifecycle only applies to built-in components and does not apply to pluggable components.Overview
Dapr uses a modular design where functionality is delivered as a component. Each component has an interface definition. All of the components are interchangeable, so that in ideal scenarios, you can swap out one component with the same interface for another. Each component used in production maintains a certain set of technical requirements to ensure functional compatibility and robustness.
In general a component needs to be:
- Compliant with the defined Dapr interfaces
- Functionally correct and robust
- Well documented and maintained
To make sure a component conforms to the standards set by Dapr, there are a set of tests run against a component in a Dapr maintainers managed environment. Once the tests pass consistently, the maturity level can be determined for a component.
Certification levels
The levels are as follows:
Alpha
- The component implements the required interface and works as described in the specification
- The component has documentation
- The component might be buggy or might expose bugs on integration
- The component may not pass all conformance tests
- The component may not have conformance tests
- Recommended for only non-business-critical uses because of potential for incompatible changes in subsequent releases
All components start at the Alpha stage.
Beta
- The component must pass all the component conformance tests defined to satisfy the component specification
- The component conformance tests have been run in a Dapr maintainers managed environment
- The component contains a record of the conformance test result reviewed and approved by Dapr maintainers with specific components-contrib version
- Recommended for only non-business-critical uses because of potential for incompatible changes in subsequent releases
Note
A component may skip the Beta stage and conformance test requirement per the discretion of the Maintainer if:
- The component is a binding
- The certification tests are comprehensive
Stable
- The component must have component certification tests validating functionality and resiliency
- The component is maintained by Dapr maintainers and supported by the community
- The component is well documented and tested
- The component has been available as Alpha or Beta for at least 1 minor version release of Dapr runtime prior
- A maintainer will address component security, core functionality and test issues according to the Dapr support policy and issue a patch release that includes the patched stable component
Note
Stable Dapr components are based on Dapr certification and conformance tests and are not a guarantee of support by any specific vendor, where the vendor’s SDK is used as part of the component.
Dapr component tests guarantee the stability of a component independent of a third party vendor’s declared stability status for any SDKs used. This is because the meaning of stable (for example alpha, beta, stable) can vary for each vendor.
Previous Generally Available (GA) components
Any component that was previously certified as GA is allowed into Stable even if the new requirements are not met.
Conformance tests
Each component in the components-contrib repository needs to adhere to a set of interfaces defined by Dapr. Conformance tests are tests that are run on these component definitions with their associated backing services such that the component is tested to be conformant with the Dapr interface specifications and behavior.
The conformance tests are defined for the following building blocks:
- State store
- Secret store
- Bindings
- Pub/Sub
To understand more about them see the readme here.
Test requirements
- The tests should validate the functional behavior and robustness of component based on the component specification
- All the details needed to reproduce the tests are added as part of the component conformance test documentation
Certification tests
Each stable component in the components-contrib repository must have a certification test plan and automated certification tests validating all features supported by the component via Dapr.
Test plan for stable components should include the following scenarios:
- Client reconnection: in case the client library cannot connect to the service for a moment, Dapr sidecar should not require a restart once the service is back online.
- Authentication options: validate the component can authenticate with all the supported options.
- Validate resource provisioning: validate if the component automatically provisions resources on initialization, if applicable.
- All scenarios relevant to the corresponding building block and component.
The test plan must be approved by a Dapr maintainer and be published in a README.md file along with the component code.
Test requirements
- The tests should validate the functional behavior and robustness of the component based on the component specification, reflecting the scenarios from the test plan
- The tests must run successfully as part of the continuous integration of the components-contrib repository
Component certification process
In order for a component to be certified, tests are run in an environment maintained by the Dapr project.
New component certification: Alpha->Beta
For a new component requiring a certification change from Alpha to Beta, a request for component certification follows these steps:
- Requestor creates an issue in the components-contrib repository for certification of the component with the current and the new certification levels
- Requestor submits a PR to integrate the component with the defined conformance test suite, if not already included
- The user details the environment setup in the issue created, so a Dapr maintainer can setup the service in a managed environment
- After the environment setup is complete, Dapr maintainers review the PR and if approved merges that PR
- Requestor submits a PR in the docs repository, updating the component’s certification level
New component certification: Beta->Stable
For a new component requiring a certification change from Beta to Stable, a request for component certification follows these steps:
- Requestor creates an issue in the components-contrib repository for certification of the component with the current and the new certification levels
- Requestor submits a PR for the test plan as a
README.mdfile in the component’s source code directory- The requestor details the test environment requirements in the created PR, including any manual steps or credentials needed
- A Dapr maintainer reviews the test plan, provides feedback or approves it, and eventually merges the PR
- Requestor submits a PR for the automated certification tests, including scripts to provision resources when applicable
- After the test environment setup is completed and credentials provisioned, Dapr maintainers review the PR and, if approved, merges the PR
- Requestor submits a PR in the docs repository, updating the component’s certification level
4.2 - Updating components
When making an update to an existing deployed component used by an application, Dapr does not update the component automatically unless the HotReload feature gate is enabled.
The Dapr sidecar needs to be restarted in order to pick up the latest version of the component.
How this is done depends on the hosting environment.
Kubernetes
When running in Kubernetes, the process of updating a component involves two steps:
- Apply the new component YAML to the desired namespace
- Unless the
HotReloadfeature gate is enabled, perform a rollout restart operation on your deployments to pick up the latest component
Self Hosted
Unless the HotReload feature gate is enabled, the process of updating a component involves a single step of stopping and restarting the daprd process to pick up the latest component.
Hot Reloading (Preview Feature)
This feature is currently in preview. Hot reloading is enabled by via the
HotReloadfeature gate.
Dapr can be made to “hot reload” components whereby component updates are picked up automatically without the need to restart the Dapr sidecar process or Kubernetes pod. This means creating, updating, or deleting a component manifest will be reflected in the Dapr sidecar during runtime.
Updating Components
When a component is updated it is first closed, and then re-initialized using the new configuration. This causes the component to be unavailable for a short period of time during this process.Initialization Errors
If the initialization processes errors when a component is created or updated through hot reloading, the Dapr sidecar respects the component field spec.ignoreErrors.
That is, the behaviour is the same as when the sidecar loads components on boot.
spec.ignoreErrors=false(default): the sidecar gracefully shuts down.spec.ignoreErrors=true: the sidecar continues to run with neither the old or new component configuration registered.
All components are supported for hot reloading except for the following types. Any create, update, or deletion of these component types is ignored by the sidecar with a restart required to pick up changes.
Further reading
4.3 - How-To: Scope components to one or more applications
Dapr components are namespaced (separate from the Kubernetes namespace concept), meaning a Dapr runtime instance can only access components that have been deployed to the same namespace.
When Dapr runs, it matches it’s own configured namespace with the namespace of the components that it loads and initializes only the ones matching its namespaces. All other components in a different namespace are not loaded.
Namespaces
Namespaces can be used to limit component access to particular Dapr instances.
In self hosted mode, a developer can specify the namespace to a Dapr instance by setting the NAMESPACE environment variable.
If the NAMESPACE environment variable is set, Dapr does not load any component that does not specify the same namespace in its metadata.
For example given this component in the production namespace
apiVersion: dapr.io/v1alpha1
kind: Component
metadata:
name: statestore
namespace: production
spec:
type: state.redis
version: v1
metadata:
- name: redisHost
value: redis-master:6379
To tell Dapr which namespace it is deployed to, set the environment variable:
MacOS/Linux:
export NAMESPACE=production
# run Dapr as usual
Windows:
setx NAMESPACE "production"
# run Dapr as usual
Let’s consider the following component in Kubernetes:
apiVersion: dapr.io/v1alpha1
kind: Component
metadata:
name: statestore
namespace: production
spec:
type: state.redis
version: v1
metadata:
- name: redisHost
value: redis-master:6379
In this example, the Redis component is only accessible to Dapr instances running inside the production namespace.
Note
The component YAML applied to namespace “A” can reference the implementation in namespace “B”. For example, a component YAML for Redis in namespace “production-A” can point the Redis host address to the Redis instance deployed in namespace “production-B”.
See Configure Pub/Sub components with multiple namespaces for an example.
Application access to components with scopes
Developers and operators might want to limit access to one database from a certain application, or a specific set of applications.
To achieve this, Dapr allows you to specify scopes on the component YAML. Application scopes added to a component limit only the applications with specific IDs from using the component.
The following example shows how to give access to two Dapr enabled apps, with the app IDs of app1 and app2 to the Redis component named statestore which itself is in the production namespace
apiVersion: dapr.io/v1alpha1
kind: Component
metadata:
name: statestore
namespace: production
spec:
type: state.redis
version: v1
metadata:
- name: redisHost
value: redis-master:6379
scopes:
- app1
- app2
Community call demo
Using namespaces with service invocation
Read Service invocation across namespaces for more information on using namespaces when calling between services.
Using namespaces with pub/sub
Read Configure Pub/Sub components with multiple namespaces for more information on using namespaces with pub/sub.
Related links
4.4 - How-To: Reference secrets in components
Overview
Components can reference secrets for the spec.metadata section within the components definition.
In order to reference a secret, you need to set the auth.secretStore field to specify the name of the secret store that holds the secrets.
When running in Kubernetes, if the auth.secretStore is empty, the Kubernetes secret store is assumed.
Supported secret stores
Go to this link to see all the secret stores supported by Dapr, along with information on how to configure and use them.
Referencing secrets
While you have the option to use plain text secrets (like MyPassword), as shown in the yaml below for the value of redisPassword, this is not recommended for production:
apiVersion: dapr.io/v1alpha1
kind: Component
metadata:
name: statestore
spec:
type: state.redis
version: v1
metadata:
- name: redisHost
value: localhost:6379
- name: redisPassword
value: MyPassword
Instead create the secret in your secret store and reference it in the component definition. There are two cases for this shown below – the “Secret contains an embedded key” and the “Secret is a string”.
The “Secret contains an embedded key” case applies when there is a key embedded within the secret, i.e. the secret is not an entire connection string. This is shown in the following component definition yaml.
apiVersion: dapr.io/v1alpha1
kind: Component
metadata:
name: statestore
spec:
type: state.redis
version: v1
metadata:
- name: redisHost
value: localhost:6379
- name: redisPassword
secretKeyRef:
name: redis-secret
key: redis-password
auth:
secretStore: <SECRET_STORE_NAME>
SECRET_STORE_NAME is the name of the configured secret store component. When running in Kubernetes and using a Kubernetes secret store, the field auth.SecretStore defaults to kubernetes and can be left empty.
The above component definition tells Dapr to extract a secret named redis-secret from the defined secretStore and assign the value associated with the redis-password key embedded in the secret to the redisPassword field in the component. One use of this case is when your code is constructing a connection string, for example putting together a URL, a secret, plus other information as necessary, into a string.
On the other hand, the below “Secret is a string” case applies when there is NOT a key embedded in the secret. Rather, the secret is just a string. Therefore, in the secretKeyRef section both the secret name and the secret key will be identical. This is the case when the secret itself is an entire connection string with no embedded key whose value needs to be extracted. Typically a connection string consists of connection information, some sort of secret to allow connection, plus perhaps other information and does not require a separate “secret”. This case is shown in the below component definition yaml.
apiVersion: dapr.io/v1alpha1
kind: Component
metadata:
name: servicec-inputq-azkvsecret-asbqueue
spec:
type: bindings.azure.servicebusqueues
version: v1
metadata:
- name: connectionString
secretKeyRef:
name: asbNsConnString
key: asbNsConnString
- name: queueName
value: servicec-inputq
auth:
secretStore: <SECRET_STORE_NAME>
The above “Secret is a string” case yaml tells Dapr to extract a connection string named asbNsConnstring from the defined secretStore and assign the value to the connectionString field in the component since there is no key embedded in the “secret” from the secretStore because it is a plain string. This requires the secret name and secret key to be identical.
Example
Referencing a Kubernetes secret
The following example shows you how to create a Kubernetes secret to hold the connection string for an Event Hubs binding.
First, create the Kubernetes secret:
kubectl create secret generic eventhubs-secret --from-literal=connectionString=*********Next, reference the secret in your binding:
apiVersion: dapr.io/v1alpha1 kind: Component metadata: name: eventhubs spec: type: bindings.azure.eventhubs version: v1 metadata: - name: connectionString secretKeyRef: name: eventhubs-secret key: connectionStringFinally, apply the component to the Kubernetes cluster:
kubectl apply -f ./eventhubs.yaml
Scoping access to secrets
Dapr can restrict access to secrets in a secret store using its configuration. Read How To: Use secret scoping and How-To: Limit the secrets that can be read from secret stores for more information. This is the recommended way to limit access to secrets using Dapr.
Kubernetes permissions
Default namespace
When running in Kubernetes, Dapr, during installation, defines default Role and RoleBinding for secrets access from Kubernetes secret store in the default namespace. For Dapr enabled apps that fetch secrets from default namespace, a secret can be defined and referenced in components as shown in the example above.
Non-default namespaces
If your Dapr enabled apps are using components that fetch secrets from non-default namespaces, apply the following resources to that namespace:
---
apiVersion: rbac.authorization.k8s.io/v1
kind: Role
metadata:
name: secret-reader
namespace: <NAMESPACE>
rules:
- apiGroups: [""]
resources: ["secrets"]
verbs: ["get", "list"]
---
kind: RoleBinding
apiVersion: rbac.authorization.k8s.io/v1
metadata:
name: dapr-secret-reader
namespace: <NAMESPACE>
subjects:
- kind: ServiceAccount
name: default
roleRef:
kind: Role
name: secret-reader
apiGroup: rbac.authorization.k8s.io
These resources grant Dapr permissions to get secrets from the Kubernetes secret store for the namespace defined in the Role and RoleBinding.
Note
In production scenario to limit Dapr’s access to certain secret resources alone, you can use theresourceNames field. See this link for further explanation.Related links
4.5 - State stores components
Dapr integrates with existing databases to provide apps with state management capabilities for CRUD operations, transactions and more. It also supports the configuration of multiple, named, state store components per application.
State stores are extensible and can be found in the components-contrib repo.
A state store in Dapr is described using a Component file:
apiVersion: dapr.io/v1alpha1
kind: Component
metadata:
name: statestore
spec:
type: state.<DATABASE>
version: v1
metadata:
- name: <KEY>
value: <VALUE>
- name: <KEY>
value: <VALUE>
...
The type of database is determined by the type field, and things like connection strings and other metadata are put in the .metadata section.
Even though metadata values can contain secrets in plain text, it is recommended you use a secret store.
Visit this guide on how to configure a state store component.
Supported state stores
Visit this reference to see all of the supported state stores in Dapr.
Related topics
4.6 - Pub/Sub brokers
Dapr integrates with pub/sub message buses to provide applications with the ability to create event-driven, loosely coupled architectures where producers send events to consumers via topics.
Dapr supports the configuration of multiple, named, pub/sub components per application. Each pub/sub component has a name and this name is used when publishing a message topic. Read the API reference for details on how to publish and subscribe to topics.
Pub/sub components are extensible. A list of support pub/sub components is here and the implementations can be found in the components-contrib repo.
Component files
A pub/sub is described using a Component file:
apiVersion: dapr.io/v1alpha1
kind: Component
metadata:
name: pubsub
namespace: default
spec:
type: pubsub.<NAME>
version: v1
metadata:
- name: <KEY>
value: <VALUE>
- name: <KEY>
value: <VALUE>
...
The type of pub/sub is determined by the type field, and properties such as connection strings and other metadata are put in the .metadata section.
Even though metadata values can contain secrets in plain text, it is recommended you use a secret store using a secretKeyRef.
Topic creation
Depending on the pub/sub message bus you are using and how it is configured, topics may be created automatically. Even if the message bus supports automatic topic creation, it is a common governance practice to disable it in production environments. You may still need to use a CLI, admin console, or request form to manually create the topics required by your application.While all pub/sub components support consumerID metadata, the runtime creates a consumer ID if you do not supply one. All component metadata field values can carry templated metadata values, which are resolved on Dapr sidecar startup.
For example, you can choose to use {namespace} as the consumerGroup to enable using the same appId in different namespaces using the same topics as described in this article.
Visit this guide for instructions on configuring and using pub/sub components.
Related links
- Overview of the Dapr Pub/Sub building block
- Try the Pub/Sub quickstart sample
- Read the guide on publishing and subscribing
- Learn about topic scoping
- Learn about message time-to-live
- Learn how to configure Pub/Sub components with multiple namespaces
- List of pub/sub components
- Read the API reference
4.6.1 - HowTo: Configure Pub/Sub components with multiple namespaces
In some scenarios, applications can be spread across namespaces and share a queue or topic via PubSub. In this case, the PubSub component must be provisioned on each namespace.
Note
Namespaces are a Dapr concept used for scoping applications and components. This example uses Kubernetes namespaces, however the Dapr component namespace scoping can be used on any supported platform. Read How-To: Scope components to one or more applications for more information on scoping components.This example uses the PubSub sample. The Redis installation and the subscribers are in namespace-a while the publisher UI is in namespace-b. This solution will also work if Redis is installed on another namespace or if you use a managed cloud service like Azure ServiceBus, AWS SNS/SQS or GCP PubSub.
This is a diagram of the example using namespaces.
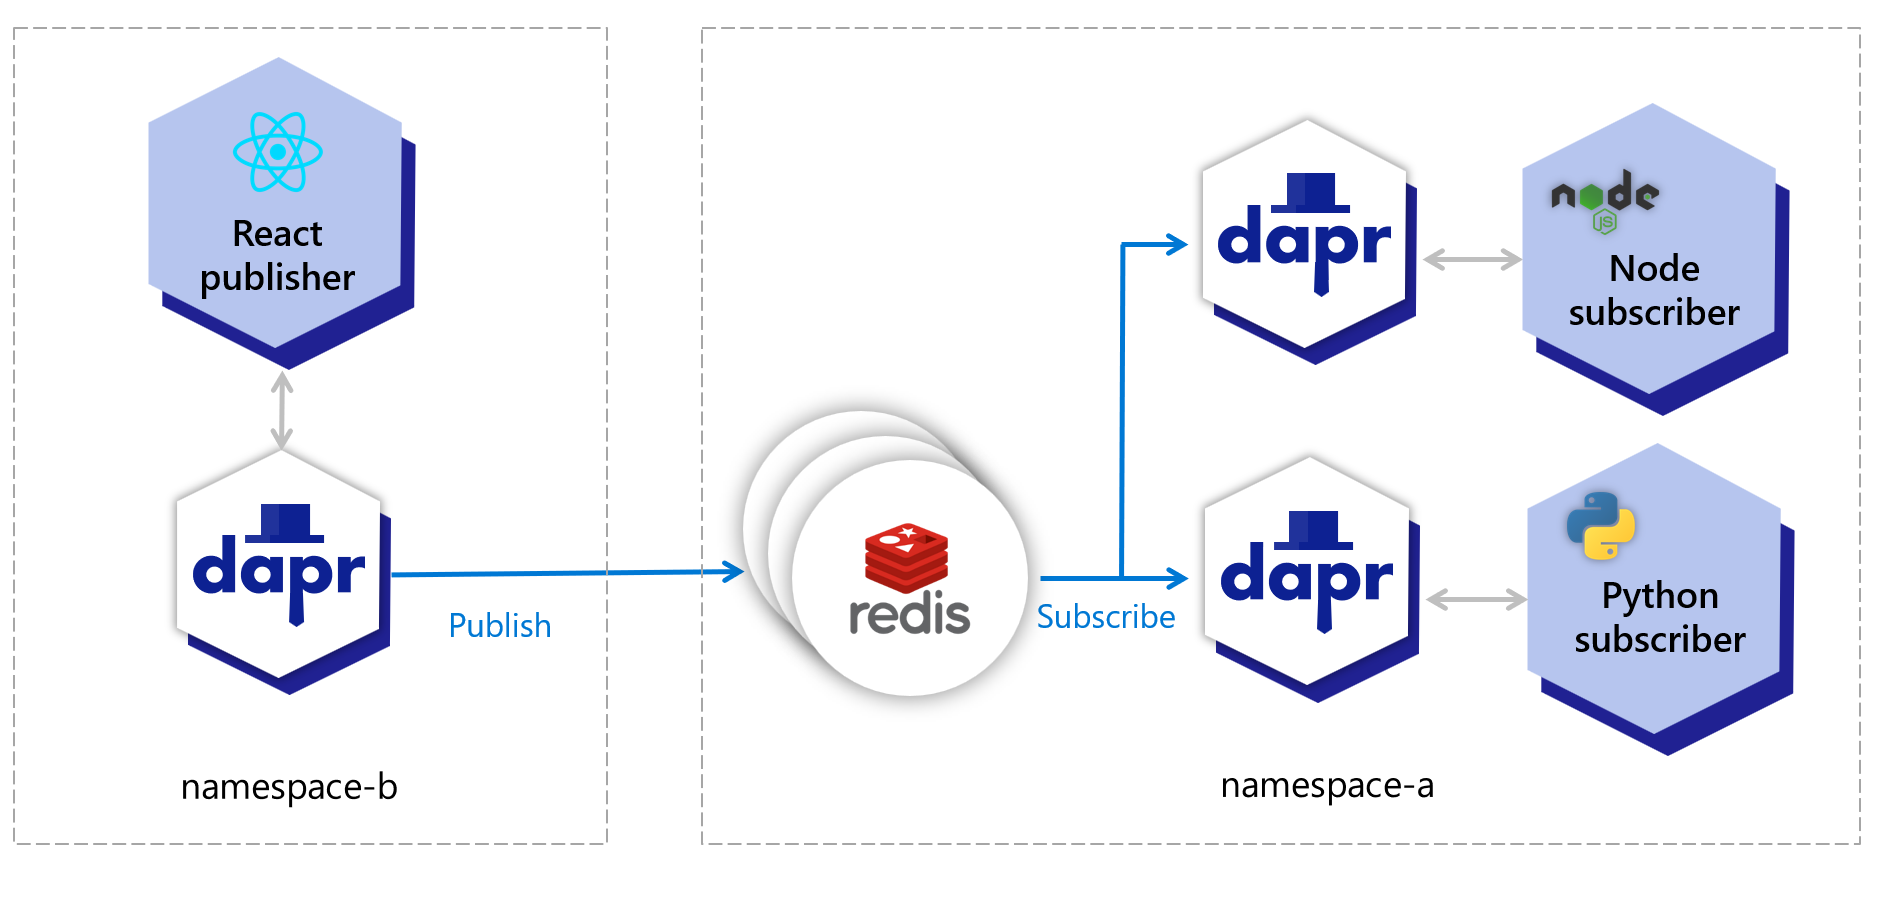
The table below shows which resources are deployed to which namespaces:
| Resource | namespace-a | namespace-b |
|---|---|---|
| Redis master | ✅ | ❌ |
| Redis replicas | ✅ | ❌ |
| Dapr’s PubSub component | ✅ | ✅ |
| Node subscriber | ✅ | ❌ |
| Python subscriber | ✅ | ❌ |
| React UI publisher | ❌ | ✅ |
Note
All pub/sub components support limiting pub/sub topics to specific applications using namespace or component scopes.Pre-requisites
- Dapr installed on Kubernetes in any namespace since Dapr works at the cluster level.
- Checkout and cd into the directory for PubSub quickstart.
Setup namespace-a
Create namespace and switch kubectl to use it.
kubectl create namespace namespace-a
kubectl config set-context --current --namespace=namespace-a
Install Redis (master and slave) on namespace-a, following these instructions.
Now, configure deploy/redis.yaml, paying attention to the hostname containing namespace-a.
apiVersion: dapr.io/v1alpha1
kind: Component
metadata:
name: pubsub
spec:
type: pubsub.redis
version: v1
metadata:
- name: "redisHost"
value: "redis-master.namespace-a.svc:6379"
- name: "redisPassword"
value: "YOUR_PASSWORD"
Deploy resources to namespace-a:
kubectl apply -f deploy/redis.yaml
kubectl apply -f deploy/node-subscriber.yaml
kubectl apply -f deploy/python-subscriber.yaml
Setup namespace-b
Create namespace and switch kubectl to use it.
kubectl create namespace namespace-b
kubectl config set-context --current --namespace=namespace-b
Deploy resources to namespace-b, including the Redis component:
kubectl apply -f deploy/redis.yaml
kubectl apply -f deploy/react-form.yaml
Now, find the IP address for react-form, open it on your browser and publish messages to each topic (A, B and C).
kubectl get service -A
Confirm subscribers received the messages.
Switch back to namespace-a:
kubectl config set-context --current --namespace=namespace-a
Find the POD names:
kubectl get pod # Copy POD names and use in the next commands.
Display logs:
kubectl logs node-subscriber-XYZ node-subscriber
kubectl logs python-subscriber-XYZ python-subscriber
The messages published on the browser should show in the corresponding subscriber’s logs. The Node.js subscriber receives messages of type “A” and “B”, while the Python subscriber receives messages of type “A” and “C”.
Clean up
kubectl delete -f deploy/redis.yaml --namespace namespace-a
kubectl delete -f deploy/node-subscriber.yaml --namespace namespace-a
kubectl delete -f deploy/python-subscriber.yaml --namespace namespace-a
kubectl delete -f deploy/react-form.yaml --namespace namespace-b
kubectl delete -f deploy/redis.yaml --namespace namespace-b
kubectl config set-context --current --namespace=default
kubectl delete namespace namespace-a
kubectl delete namespace namespace-b
Related links
4.7 - Secret store components
Dapr integrates with secret stores to provide apps and other components with secure storage and access to secrets such as access keys and passwords. Each secret store component has a name and this name is used when accessing a secret.
As with other building block components, secret store components are extensible and can be found in the components-contrib repo.
A secret store in Dapr is described using a Component file with the following fields:
apiVersion: dapr.io/v1alpha1
kind: Component
metadata:
name: secretstore
spec:
type: secretstores.<NAME>
version: v1
metadata:
- name: <KEY>
value: <VALUE>
- name: <KEY>
value: <VALUE>
...
The type of secret store is determined by the type field, and things like connection strings and other metadata are put in the .metadata section.
Different supported secret stores will have different specific fields that would need to be configured. For example, when configuring a secret store which uses AWS Secrets Manager the file would look like this:
apiVersion: dapr.io/v1alpha1
kind: Component
metadata:
name: awssecretmanager
spec:
type: secretstores.aws.secretmanager
version: v1
metadata:
- name: region
value: "[aws_region]"
- name: accessKey
value: "[aws_access_key]"
- name: secretKey
value: "[aws_secret_key]"
- name: sessionToken
value: "[aws_session_token]"
Important
When running the Dapr sidecar (daprd) with your application on EKS (AWS Kubernetes), if you’re using a node/pod that has already been attached to an IAM policy defining access to AWS resources, you must not provide AWS access-key, secret-key, and tokens in the definition of the component spec you’re using.Apply the configuration
Once you have created the component’s YAML file, follow these instructions to apply it based on your hosting environment:
To run locally, create a components dir containing the YAML file and provide the path to the dapr run command with the flag --resources-path.
To deploy in Kubernetes, assuming your component file is named secret-store.yaml, run:
kubectl apply -f secret-store.yaml
Supported secret stores
Visit the secret stores reference for a full list of supported secret stores.
Related links
4.8 - Bindings components
Dapr integrates with external resources to allow apps to both be triggered by external events and interact with the resources. Each binding component has a name and this name is used when interacting with the resource.
As with other building block components, binding components are extensible and can be found in the components-contrib repo.
A binding in Dapr is described using a Component file with the following fields:
apiVersion: dapr.io/v1alpha1
kind: Component
metadata:
name: <NAME>
namespace: <NAMESPACE>
spec:
type: bindings.<NAME>
version: v1
metadata:
- name: <KEY>
value: <VALUE>
- name: <KEY>
value: <VALUE>
...
The type of binding is determined by the type field, and things like connection strings and other metadata are put in the .metadata section.
Different supported bindings will have different specific fields that would need to be configured. For example, when configuring a binding for Azure Blob Storage, the file would look like this:
apiVersion: dapr.io/v1alpha1
kind: Component
metadata:
name: <NAME>
spec:
type: bindings.azure.blobstorage
version: v1
metadata:
- name: storageAccount
value: myStorageAccountName
- name: storageAccessKey
value: ***********
- name: container
value: container1
- name: decodeBase64
value: <bool>
- name: getBlobRetryCount
value: <integer>
Apply the configuration
Once you have created the component’s YAML file, follow these instructions to apply it based on your hosting environment:
To run locally, create a components dir containing the YAML file and provide the path to the dapr run command with the flag --resources-path.
To deploy in Kubernetes, assuming your component file is named mybinding.yaml, run:
kubectl apply -f mybinding.yaml
Supported bindings
Visit the bindings reference for a full list of supported resources.
Related links
4.9 - How-To: Register a pluggable component
Component registration process
Pluggable, gRPC-based components are typically run as containers or processes that need to communicate with the Dapr runtime via Unix Domain Sockets (or UDS for short). They are automatically discovered and registered in the runtime with the following steps:
- The component listens to an Unix Domain Socket placed on the shared volume.
- The Dapr runtime lists all Unix Domain Socket in the shared volume.
- The Dapr runtime connects with each socket and uses gRPC reflection to discover all proto services from a given building block API that the component implements.
A single component can implement multiple component interfaces at once.
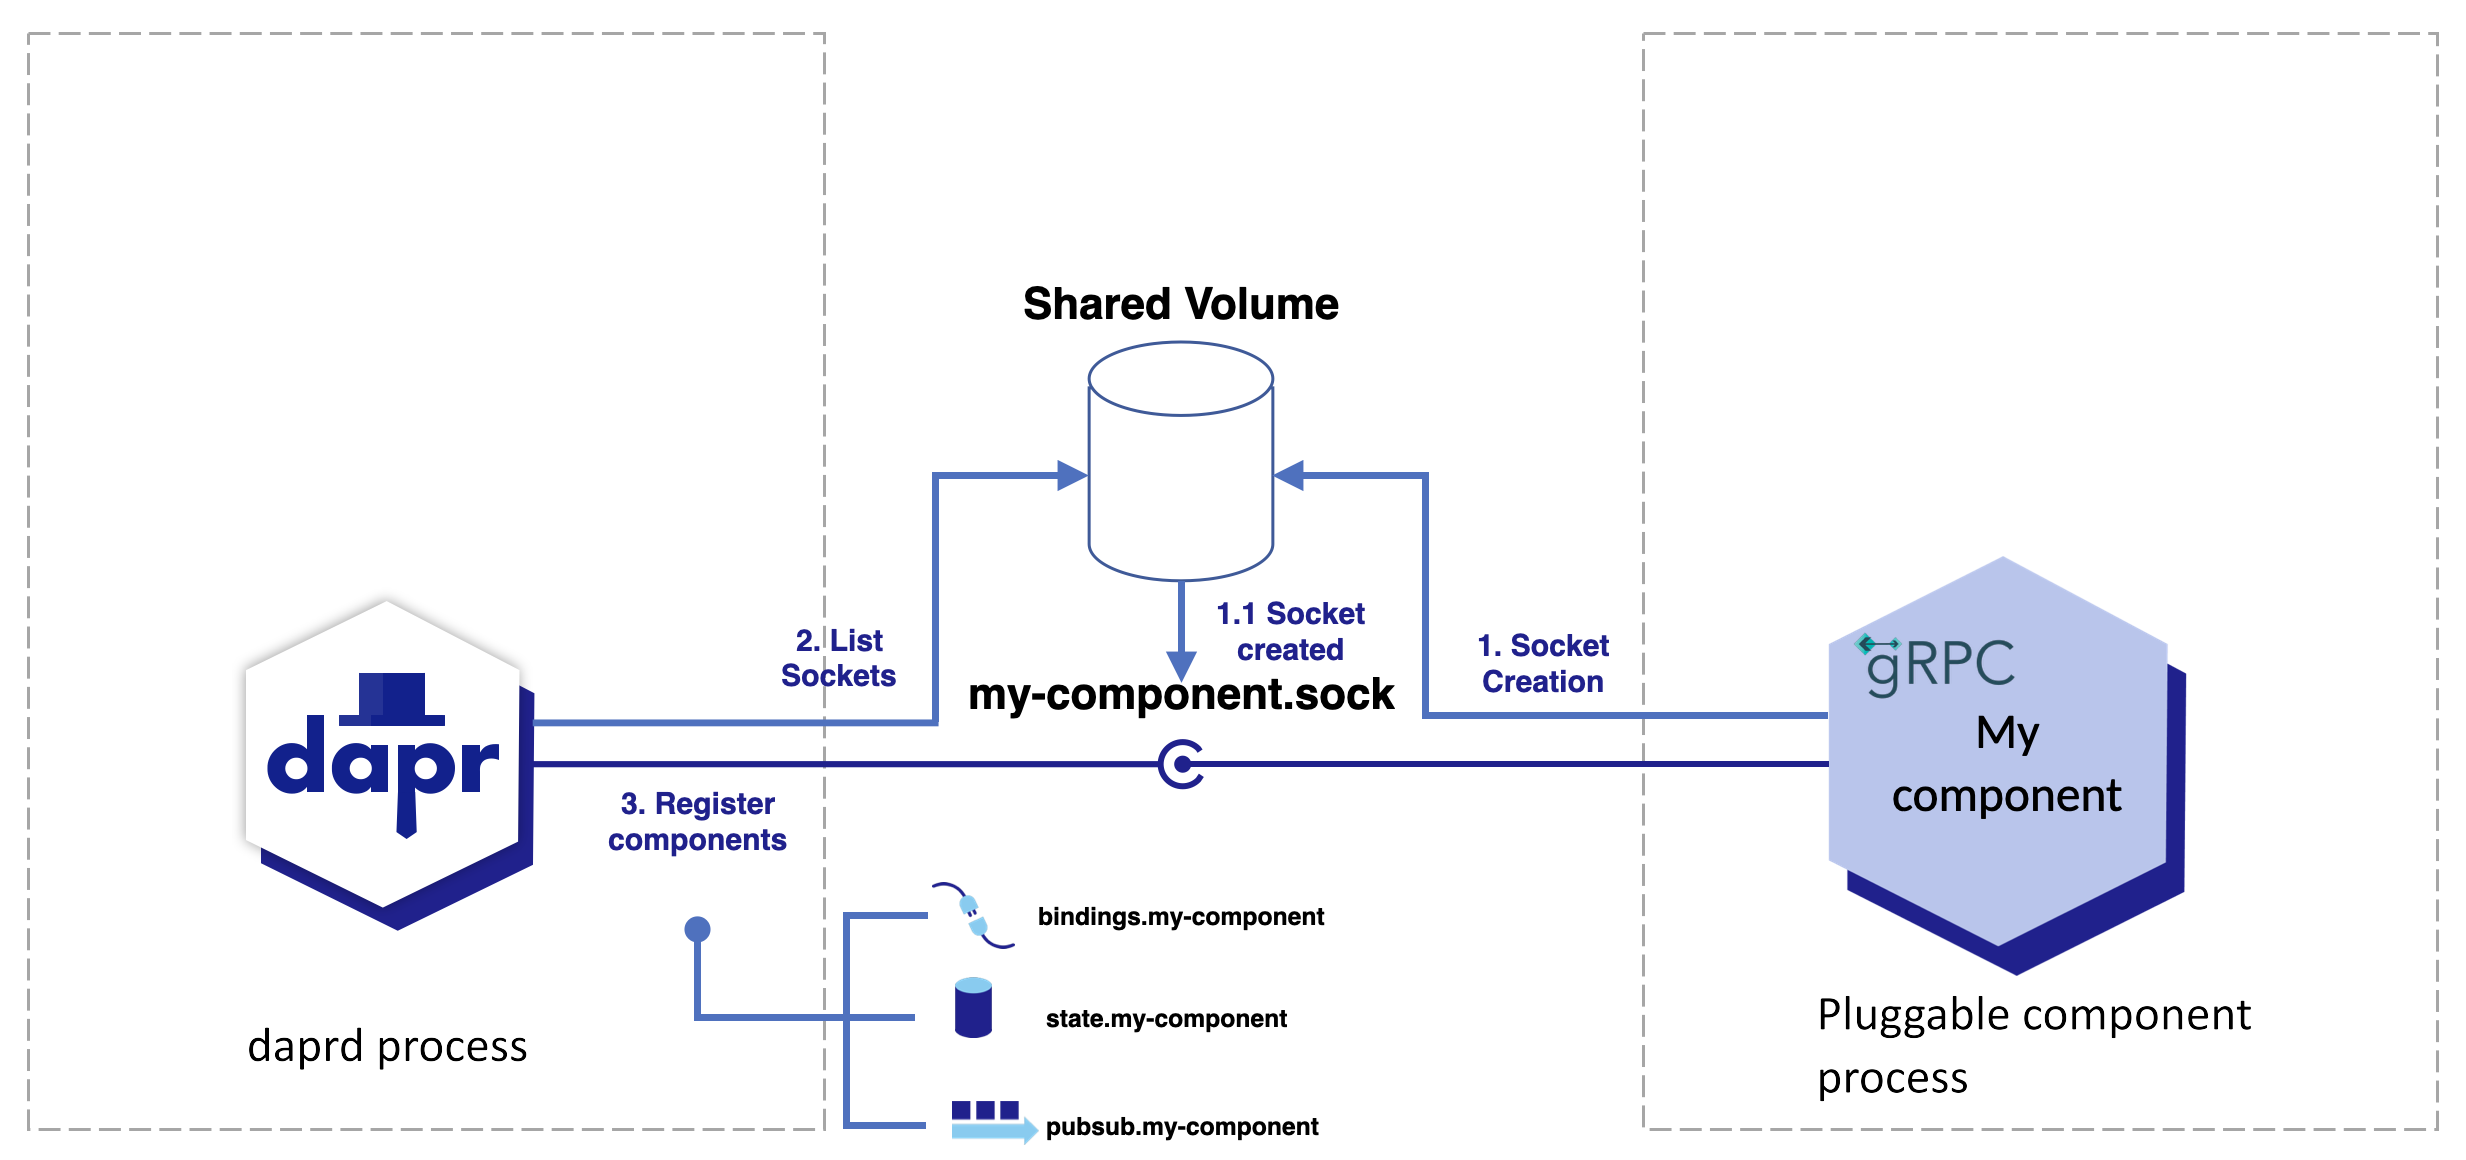
While Dapr’s built-in components come included with the runtime, pluggable components require a few setup steps before they can be used with Dapr.
- Pluggable components need to be started and ready to take requests before Dapr itself is started.
- The Unix Domain Socket file used for the pluggable component communication need to be made accessible to both Dapr and pluggable component.
In standalone mode, pluggable components run as processes or containers. On Kubernetes, pluggable components run as containers and are automatically injected to the application’s pod by Dapr’s sidecar injector, allowing customization via the standard Kubernetes Container spec.
This also changes the approach to share Unix Domain Socket files between Dapr and pluggable components.
Note
As a prerequisite the operating system must supports Unix Domain Sockets, any UNIX or UNIX-like system (Mac, Linux, or for local development WSL for Windows users) should be sufficient.Select your environment to begin making your component discoverable.
Run the component
Both your component and the Unix Socket must be running before Dapr starts.
By default, Dapr sidecar looks for components as Unix Domain Socket files in /tmp/dapr-components-sockets.
Filenames in this folder are significant for component registration. They must be formed by appending the component’s name with a file extension of your choice, more commonly .sock. For example, the filename my-component.sock is a valid Unix Domain Socket file name for a component named my-component.
Since you are running Dapr in the same host as the component, verify that this folder and the files within it are accessible and writable by both your component and Dapr. If you are using Dapr’s sidecar injector capability, this volume is created and mounted automatically.
Component discovery and multiplexing
A pluggable component accessible through a Unix Domain Socket (UDS) can host multiple distinct component APIs. During the components’ initial discovery process, Dapr uses reflection to enumerate all the component APIs behind a UDS. The my-component pluggable component in the example above can contain both state store (state) and a pub/sub (pubsub) component APIs.
Typically, a pluggable component implements a single component API for packaging and deployment. However, at the expense of increasing its dependencies and broadening its security attack surface, a pluggable component can have multiple component APIs implemented. This could be done to ease the deployment and monitoring burden. Best practice for isolation, fault tolerance, and security is a single component API implementation for each pluggable component.
Define the component
Define your component using a component spec. Your component’s spec.type value is made by concatenating the following 2 parts with a .:
- The component’s API (
state,pubsub,bindingsetc) - The component’s name, which is derived from the Unix Domain Socket filename, without the file extension.
You will need to define one component spec for each API exposed by your pluggable component’s Unix Domain Socket. The Unix Domain Socket my-component.sock from the previous example exposes a pluggable component named my-component with both a state and a pubsub API. Two components specs, each in their own YAML file, placed in the resources-path, will be required: one for state.my-component and another for pubsub.my-component.
For instance, the component spec for state.my-component could be:
apiVersion: dapr.io/v1alpha1
kind: Component
metadata:
name: my-production-state-store
spec:
type: state.my-component
version: v1
metadata:
In the sample above, notice the following:
- The contents of the field
spec.typeisstate.my-component, referring to a state store being exposed as a pluggable component namedmy-component. - The field
metadata.name, which is the name of the state store being defined here, is not related to the pluggable component name.
Save this file as component.yaml in Dapr’s component configuration folder. Just like the contents of metadata.name field, the filename for this YAML file has no impact and does not depend on the pluggable component name.
Run Dapr
Initialize Dapr, and make sure that your component file is placed in the right folder.
Note
Dapr 1.9.0 is the minimum version that supports pluggable components. As of version 1.11.0, automatic injection of the containers is supported for pluggable components.
That’s it! Now you’re able to call the state store APIs via Dapr API. See it in action by running the following. Replace $PORT with the Dapr HTTP port:
curl -X POST -H "Content-Type: application/json" -d '[{ "key": "name", "value": "Bruce Wayne", "metadata": {}}]' http://localhost:$PORT/v1.0/state/prod-mystore
Retrieve the value, replacing $PORT with the Dapr HTTP port:
curl http://localhost:$PORT/v1.0/state/prod-mystore/name
Build and publish a container for your pluggable component
Make sure your component is running as a container, published first and accessible to your Kubernetes cluster.
Deploy Dapr on a Kubernetes cluster
Follow the steps provided in the Deploy Dapr on a Kubernetes cluster docs.
Add the pluggable component container in your deployments
Pluggable components are deployed as containers in the same pod as your application.
Since pluggable components are backed by Unix Domain Sockets, make the socket created by your pluggable component accessible by Dapr runtime. Configure the deployment spec to:
- Mount volumes
- Hint to Dapr the mounted Unix socket volume location
- Attach volume to your pluggable component container
In the following example, your configured pluggable component is deployed as a container within the same pod as your application container.
apiVersion: apps/v1
kind: Deployment
metadata:
name: app
labels:
app: app
spec:
replicas: 1
selector:
matchLabels:
app: app
template:
metadata:
labels:
app: app
annotations:
# Recommended to automatically inject pluggable components.
dapr.io/inject-pluggable-components: "true"
dapr.io/app-id: "my-app"
dapr.io/enabled: "true"
spec:
containers:
# Your application's container spec, as usual.
- name: app
image: YOUR_APP_IMAGE:YOUR_APP_IMAGE_VERSION
The dapr.io/inject-pluggable-components annotation is recommended to be set to “true”, indicating Dapr’s sidecar injector that this application’s pod will have additional containers for pluggable components.
Alternatively, you can skip Dapr’s sidecar injection capability and manually add the pluggable component’s container and annotate your pod, telling Dapr which containers within that pod are pluggable components, like in the example below:
apiVersion: apps/v1
kind: Deployment
metadata:
name: app
labels:
app: app
spec:
replicas: 1
selector:
matchLabels:
app: app
template:
metadata:
labels:
app: app
annotations:
dapr.io/pluggable-components: "component" ## the name of the pluggable component container separated by `,`, e.g "componentA,componentB".
dapr.io/app-id: "my-app"
dapr.io/enabled: "true"
spec:
containers:
### --------------------- YOUR APPLICATION CONTAINER GOES HERE -----------
- name: app
image: YOUR_APP_IMAGE:YOUR_APP_IMAGE_VERSION
### --------------------- YOUR PLUGGABLE COMPONENT CONTAINER GOES HERE -----------
- name: component
image: YOUR_IMAGE_GOES_HERE:YOUR_IMAGE_VERSION
Before applying the deployment, let’s add one more configuration: the component spec.
Define a component
Pluggable components are defined using a component spec. The component type is derived from the socket name (without the file extension). In the following example YAML, replace:
your_socket_goes_herewith your component socket name (no extension)your_component_typewith your component type
apiVersion: dapr.io/v1alpha1
kind: Component
metadata:
name: prod-mystore
# When running on Kubernetes and automatic container injection, add annotation below:
annotations:
dapr.io/component-container: >
{
"name": "my-component",
"image": "<registry>/<image_name>:<image_tag>"
}
spec:
type: your_component_type.your_socket_goes_here
version: v1
metadata:
scopes:
- backend
The dapr.io/component-container annotation is mandatory on Kubernetes when you want Dapr’s sidecar injector to handle the container and volume injection for the pluggable component. At minimum, you’ll need the name and image attributes for the Dapr’s sidecar injector to successfully add the container to the Application’s pod. Volume for Unix Domain Socket is automatically created and mounted by Dapr’s sidecar injector.
Scope your component to make sure that only the target application can connect with the pluggable component, since it will only be running in its deployment. Otherwise the runtime fails when initializing the component.
That’s it! Apply the created manifests to your Kubernetes cluster, and call the state store APIs via Dapr API.
Use Kubernetes pod forwarder to access the daprd runtime.
See it in action by running the following. Replace $PORT with the Dapr HTTP port:
curl -X POST -H "Content-Type: application/json" -d '[{ "key": "name", "value": "Bruce Wayne", "metadata": {}}]' http://localhost:$PORT/v1.0/state/prod-mystore
Retrieve the value, replacing $PORT with the Dapr HTTP port:
curl http://localhost:$PORT/v1.0/state/prod-mystore/name
Next Steps
Get started with developing .NET pluggable component using this sample code
4.10 - Configure middleware components
Dapr allows custom processing pipelines to be defined by chaining a series of middleware components. There are two places that you can use a middleware pipeline:
- Building block APIs - HTTP middleware components are executed when invoking any Dapr HTTP APIs.
- Service-to-Service invocation - HTTP middleware components are applied to service-to-service invocation calls.
Configure API middleware pipelines
When launched, a Dapr sidecar constructs a middleware processing pipeline for incoming HTTP calls. By default, the pipeline consists of the tracing and CORS middlewares. Additional middlewares, configured by a Dapr Configuration, can be added to the pipeline in the order they are defined. The pipeline applies to all Dapr API endpoints, including state, pub/sub, service invocation, bindings, secrets, configuration, distributed lock, etc.
A request goes through all the defined middleware components before it’s routed to user code, and then goes through the defined middleware, in reverse order, before it’s returned to the client, as shown in the following diagram.
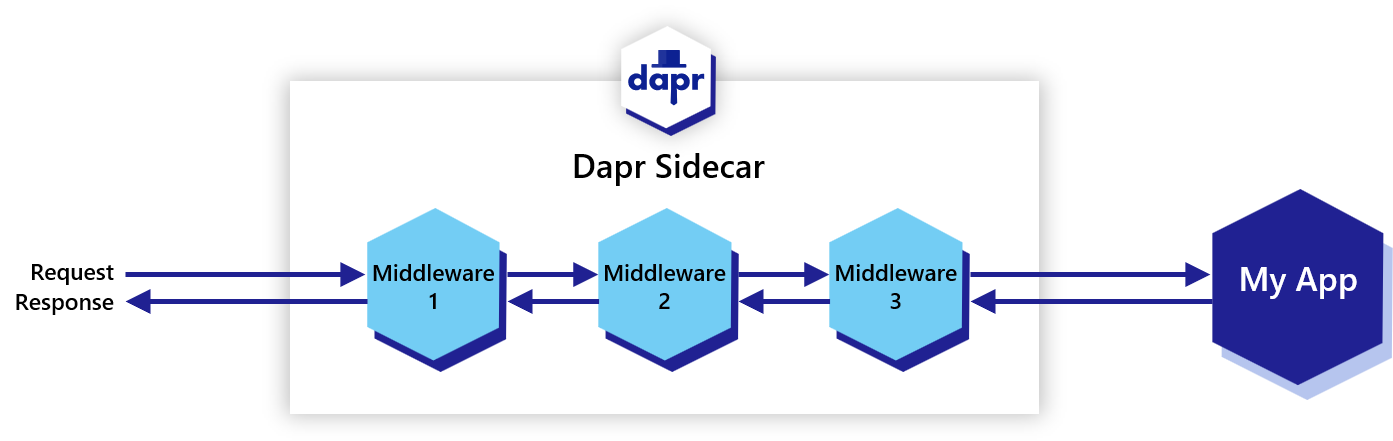
HTTP middleware components are executed when invoking Dapr HTTP APIs using the httpPipeline configuration.
The following configuration example defines a custom pipeline that uses an OAuth 2.0 middleware and an uppercase middleware component. In this case, all requests are authorized through the OAuth 2.0 protocol, and transformed to uppercase text, before they are forwarded to user code.
apiVersion: dapr.io/v1alpha1
kind: Configuration
metadata:
name: pipeline
namespace: default
spec:
httpPipeline:
handlers:
- name: oauth2
type: middleware.http.oauth2
- name: uppercase
type: middleware.http.uppercase
As with other components, middleware components can be found in the supported Middleware reference and in the dapr/components-contrib repo.
Configure app middleware pipelines
You can also use any middleware component when making service-to-service invocation calls. For example, to add token validation in a zero-trust environment, to transform a request for a specific app endpoint, or to apply OAuth policies.
Service-to-service invocation middleware components apply to all outgoing calls from a Dapr sidecar to the receiving application (service), as shown in the diagram below.
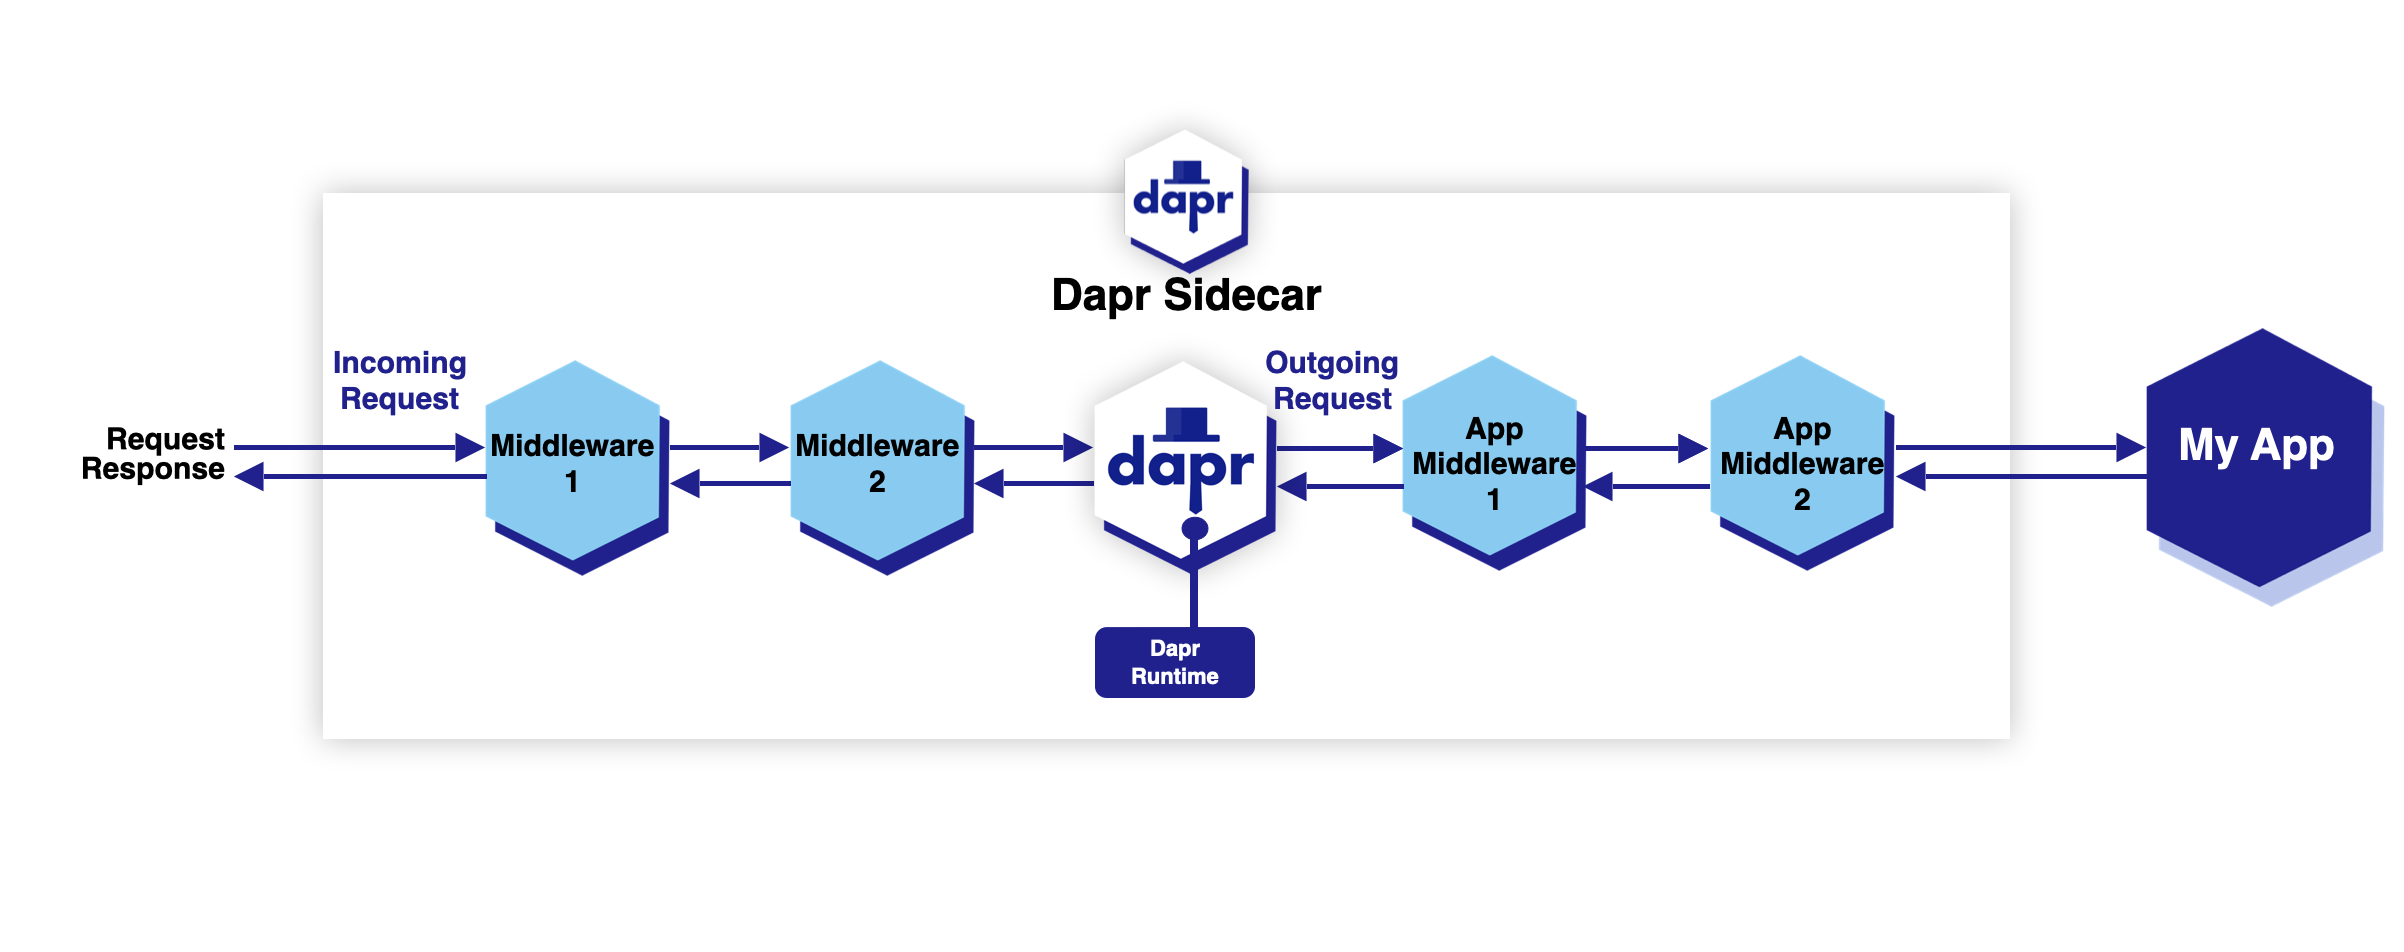
Any middleware component that can be used as HTTP middleware can also be applied to service-to-service invocation calls as a middleware component using the appHttpPipeline configuration. The example below adds the uppercase middleware component for all outgoing calls from the Dapr sidecar (target of service invocation) to the application that this configuration is applied to.
apiVersion: dapr.io/v1alpha1
kind: Configuration
metadata:
name: pipeline
namespace: default
spec:
appHttpPipeline:
handlers:
- name: uppercase
type: middleware.http.uppercase
Related links
5 - Securing Dapr deployments
5.1 - Setup & configure mTLS certificates
Dapr supports in-transit encryption of communication between Dapr instances using the Dapr control plane, Sentry service, which is a central Certificate Authority (CA).
Dapr allows operators and developers to bring in their own certificates, or instead let Dapr automatically create and persist self-signed root and issuer certificates.
For detailed information on mTLS, read the security concepts section.
If custom certificates have not been provided, Dapr automatically creates and persist self-signed certs valid for one year. In Kubernetes, the certs are persisted to a secret that resides in the namespace of the Dapr system pods, accessible only to them. In self-hosted mode, the certs are persisted to disk.
Control plane Sentry service configuration
The mTLS settings reside in a Dapr control plane configuration file. For example when you deploy the Dapr control plane to Kubernetes this configuration file is automatically created and then you can edit this. The following file shows the available settings for mTLS in a configuration resource, deployed in the daprsystem namespace:
apiVersion: dapr.io/v1alpha1
kind: Configuration
metadata:
name: daprsystem
namespace: default
spec:
mtls:
enabled: true
workloadCertTTL: "24h"
allowedClockSkew: "15m"
The file here shows the default daprsystem configuration settings. The examples below show you how to change and apply this configuration to the control plane Sentry service either in Kubernetes and self-hosted modes.
Kubernetes
Setting up mTLS with the configuration resource
In Kubernetes, Dapr creates a default control plane configuration resource with mTLS enabled.
The Sentry service, the certificate authority system pod, is installed both with Helm and with the Dapr CLI using dapr init --kubernetes.
You can view the control plane configuration resource with the following command:
kubectl get configurations/daprsystem --namespace <DAPR_NAMESPACE> -o yaml.
To make changes to the control plane configuration resource, run the following command to edit it:
kubectl edit configurations/daprsystem --namespace <DAPR_NAMESPACE>
Once the changes are saved, perform a rolling update to the control plane:
kubectl rollout restart deploy/dapr-sentry -n <DAPR_NAMESPACE>
kubectl rollout restart deploy/dapr-operator -n <DAPR_NAMESPACE>
kubectl rollout restart statefulsets/dapr-placement-server -n <DAPR_NAMESPACE>
Note: the control plane Sidecar Injector service does not need to be redeployed
Disabling mTLS with Helm
The control plane will continue to use mTLS
kubectl create ns dapr-system
helm install \
--set global.mtls.enabled=false \
--namespace dapr-system \
dapr \
dapr/dapr
Disabling mTLS with the CLI
The control plane will continue to use mTLS
dapr init --kubernetes --enable-mtls=false
Viewing logs
In order to view the Sentry service logs, run the following command:
kubectl logs --selector=app=dapr-sentry --namespace <DAPR_NAMESPACE>
Bringing your own certificates
Using Helm, you can provide the PEM encoded root cert, issuer cert and private key that will be populated into the Kubernetes secret used by the Sentry service.
Avoiding downtime
To avoid downtime when rotating expiring certificates always sign your certificates with the same private root key.Note: This example uses the OpenSSL command line tool, this is a widely distributed package, easily installed on Linux via the package manager. On Windows OpenSSL can be installed using chocolatey. On MacOS it can be installed using brew brew install openssl
Create config files for generating the certificates, this is necessary for generating v3 certificates with the SAN (Subject Alt Name) extension fields. First save the following to a file named root.conf:
[req]
distinguished_name = req_distinguished_name
x509_extensions = v3_req
prompt = no
[req_distinguished_name]
C = US
ST = VA
L = Daprville
O = dapr.io/sentry
OU = dapr.io/sentry
CN = cluster.local
[v3_req]
basicConstraints = critical, CA:true
keyUsage = critical, digitalSignature, cRLSign, keyCertSign
extendedKeyUsage = serverAuth, clientAuth
subjectAltName = @alt_names
[alt_names]
DNS.1 = cluster.local
Repeat this for issuer.conf, paste the same contents into the file, but add pathlen:0 to the end of the basicConstraints line, as shown below:
basicConstraints = critical, CA:true, pathlen:0
Run the following to generate the root cert and key
# skip the following line to reuse an existing root key, required for rotating expiring certificates
openssl ecparam -genkey -name prime256v1 | openssl ec -out root.key
openssl req -new -nodes -sha256 -key root.key -out root.csr -config root.conf -extensions v3_req
openssl x509 -req -sha256 -days 365 -in root.csr -signkey root.key -outform PEM -out root.pem -extfile root.conf -extensions v3_req
Next run the following to generate the issuer cert and key:
# skip the following line to reuse an existing issuer key, required for rotating expiring certificates
openssl ecparam -genkey -name prime256v1 | openssl ec -out issuer.key
openssl req -new -sha256 -key issuer.key -out issuer.csr -config issuer.conf -extensions v3_req
openssl x509 -req -in issuer.csr -CA root.pem -CAkey root.key -CAcreateserial -outform PEM -out issuer.pem -days 365 -sha256 -extfile issuer.conf -extensions v3_req
Install Helm and pass the root cert, issuer cert and issuer key to Sentry via configuration:
kubectl create ns dapr-system
helm install \
--set-file dapr_sentry.tls.issuer.certPEM=issuer.pem \
--set-file dapr_sentry.tls.issuer.keyPEM=issuer.key \
--set-file dapr_sentry.tls.root.certPEM=root.pem \
--namespace dapr-system \
dapr \
dapr/dapr
Root and issuer certificate upgrade using CLI (Recommended)
The CLI commands below can be used to renew root and issuer certificates in your Kubernetes cluster.
Generate brand new certificates
- The command below generates brand new root and issuer certificates, signed by a newly generated private root key.
Note: The
Dapr sentry servicefollowed by rest of the control plane services must be restarted for them to be able to read the new certificates. This can be done by supplying--restartflag to the command.
dapr mtls renew-certificate -k --valid-until <days> --restart
- The command below generates brand new root and issuer certificates, signed by provided private root key.
Note: If your existing deployed certificates are signed by this same private root key, the
Dapr Sentry servicecan then read these new certificates without restarting.
dapr mtls renew-certificate -k --private-key <private_key_file_path> --valid-until <days>
Renew certificates by using provided custom certificates
To update the provided certificates in the Kubernetes cluster, the CLI command below can be used.
Note - It does not support
valid-untilflag to specify validity for new certificates.
dapr mtls renew-certificate -k --ca-root-certificate <ca.crt> --issuer-private-key <issuer.key> --issuer-public-certificate <issuer.crt> --restart
Restart Dapr-enabled pods
Irrespective of which command was used to renew the certificates, you must restart all Dapr-enabled pods. Due to certificate mismatches, you might experience some downtime till all deployments have successfully been restarted.kubectl rollout restart deploy/myapp
Updating root or issuer certs using Kubectl
If the Root or Issuer certs are about to expire, you can update them and restart the required system services.
Avoiding downtime when rotating certificates
To avoid downtime when rotating expiring certificates your new certificates must be signed with the same private root key as the previous certificates. This is not currently possible using self-signed certificates generated by Dapr.Dapr-generated self-signed certificates
- Clear the existing Dapr Trust Bundle secret by saving the following YAML to a file (e.g.
clear-trust-bundle.yaml) and applying this secret.
apiVersion: v1
kind: Secret
metadata:
name: dapr-trust-bundle
labels:
app: dapr-sentry
data:
kubectl apply -f `clear-trust-bundle.yaml` -n <DAPR_NAMESPACE>
- Restart the Dapr Sentry service. This will generate a new certificate bundle and update the
dapr-trust-bundleKubernetes secret.
kubectl rollout restart -n <DAPR_NAMESPACE> deployment/dapr-sentry
- Once the Sentry service has been restarted, restart the rest of the Dapr control plane to pick up the new Dapr Trust Bundle.
kubectl rollout restart deploy/dapr-operator -n <DAPR_NAMESPACE>
kubectl rollout restart statefulsets/dapr-placement-server -n <DAPR_NAMESPACE>
kubectl rollout restart deploy/dapr-sidecar-injector -n <DAPR_NAMESPACE>
kubectl rollout restart deploy/dapr-scheduler-server -n <DAPR_NAMESPACE>
- Restart your Dapr applications to pick up the latest trust bundle.
Potential application downtime with mTLS enabled.
Restarts of deployments using service to service invocation using mTLS will fail until the callee service has also been restarted (thereby loading the new Dapr Trust Bundle). Additionally, the placement service will not be able to assign new actors (while existing actors remain unaffected) until applications have been restarted to load the new Dapr Trust Bundle.kubectl rollout restart deployment/mydaprservice1 kubectl deployment/myotherdaprservice2
Custom certificates (bring your own)
First, issue new certificates using the step above in Bringing your own certificates.
Now that you have the new certificates, use Helm to upgrade the certificates:
helm upgrade \
--set-file dapr_sentry.tls.issuer.certPEM=issuer.pem \
--set-file dapr_sentry.tls.issuer.keyPEM=issuer.key \
--set-file dapr_sentry.tls.root.certPEM=root.pem \
--namespace dapr-system \
dapr \
dapr/dapr
Alternatively, you can update the Kubernetes secret that holds them:
kubectl edit secret dapr-trust-bundle -n <DAPR_NAMESPACE>
Replace the ca.crt, issuer.crt and issuer.key keys in the Kubernetes secret with their corresponding values from the new certificates.
Note: The values must be base64 encoded
If you signed the new cert root with the same private key the Dapr Sentry service will pick up the new certificates automatically. You can restart your application deployments using kubectl rollout restart with zero downtime. It is not necessary to restart all deployments at once, as long as deployments are restarted before original certificate expiration.
If you signed the new cert root with a different private key, you must restart the Dapr Sentry service, followed by the remainder of the Dapr control plane service.
kubectl rollout restart deploy/dapr-sentry -n <DAPR_NAMESPACE>
Once Sentry has been completely restarted run:
kubectl rollout restart deploy/dapr-operator -n <DAPR_NAMESPACE>
kubectl rollout restart statefulsets/dapr-placement-server -n <DAPR_NAMESPACE>
Next, you must restart all Dapr-enabled pods. The recommended way to do this is to perform a rollout restart of your deployment:
kubectl rollout restart deploy/myapp
You will experience potential downtime due to mismatching certificates until all deployments have successfully been restarted (and hence loaded the new Dapr certificates).
Kubernetes video demo
Watch this video to show how to update mTLS certificates on Kubernetes
Set up monitoring for Dapr control plane mTLS certificate expiration
Beginning 30 days prior to mTLS root certificate expiration the Dapr sentry service will emit hourly warning level logs indicating that the root certificate is about to expire.
As an operational best practice for running Dapr in production we recommend configuring monitoring for these particular sentry service logs so that you are aware of the upcoming certificate expiration.
"Dapr root certificate expiration warning: certificate expires in 2 days and 15 hours"
Once the certificate has expired you will see the following message:
"Dapr root certificate expiration warning: certificate has expired."
In Kubernetes you can view the sentry service logs like so:
kubectl logs deployment/dapr-sentry -n dapr-system
The log output will appear like the following:"
{"instance":"dapr-sentry-68cbf79bb9-gdqdv","level":"warning","msg":"Dapr root certificate expiration warning: certificate expires in 2 days and 15 hours","scope":"dapr.sentry","time":"2022-04-01T23:43:35.931825236Z","type":"log","ver":"1.6.0"}
As an additional tool to alert you to the upcoming certificate expiration beginning with release 1.7.0 the CLI now prints the certificate expiration status whenever you interact with a Kubernetes-based deployment.
Example:
dapr status -k
NAME NAMESPACE HEALTHY STATUS REPLICAS VERSION AGE CREATED
dapr-operator dapr-system True Running 1 1.15.1 4m 2025-02-19 17:36.26
dapr-placement-server dapr-system True Running 1 1.15.1 4m 2025-02-19 17:36.27
dapr-dashboard dapr-system True Running 1 0.15.0 4m 2025-02-19 17:36.27
dapr-sentry dapr-system True Running 1 1.15.1 4m 2025-02-19 17:36.26
dapr-scheduler-server dapr-system True Running 3 1.15.1 4m 2025-02-19 17:36.27
dapr-sidecar-injector dapr-system True Running 1 1.15.1 4m 2025-02-19 17:36.26
⚠ Dapr root certificate of your Kubernetes cluster expires in 2 days. Expiry date: Mon, 04 Apr 2025 15:01:03 UTC.
Please see docs.dapr.io for certificate renewal instructions to avoid service interruptions.
Self hosted
Running the control plane Sentry service
In order to run the Sentry service, you can either build from source, or download a release binary from here.
When building from source, please refer to this guide on how to build Dapr.
Second, create a directory for the Sentry service to create the self signed root certs:
mkdir -p $HOME/.dapr/certs
Run the Sentry service locally with the following command:
./sentry --issuer-credentials $HOME/.dapr/certs --trust-domain cluster.local
If successful, the Sentry service runs and creates the root certs in the given directory. This command uses default configuration values as no custom config file was given. See below on how to start the Sentry service with a custom configuration.
Setting up mTLS with the configuration resource
Dapr instance configuration
When running Dapr in self hosted mode, mTLS is disabled by default. you can enable it by creating the following configuration file:
apiVersion: dapr.io/v1alpha1
kind: Configuration
metadata:
name: daprsystem
namespace: default
spec:
mtls:
enabled: true
In addition to the Dapr configuration, you also need to provide the TLS certificates to each Dapr sidecar instance. You can do so by setting the following environment variables before running the Dapr instance:
export DAPR_TRUST_ANCHORS=`cat $HOME/.dapr/certs/ca.crt`
export DAPR_CERT_CHAIN=`cat $HOME/.dapr/certs/issuer.crt`
export DAPR_CERT_KEY=`cat $HOME/.dapr/certs/issuer.key`
export NAMESPACE=default
$env:DAPR_TRUST_ANCHORS=$(Get-Content -raw $env:USERPROFILE\.dapr\certs\ca.crt)
$env:DAPR_CERT_CHAIN=$(Get-Content -raw $env:USERPROFILE\.dapr\certs\issuer.crt)
$env:DAPR_CERT_KEY=$(Get-Content -raw $env:USERPROFILE\.dapr\certs\issuer.key)
$env:NAMESPACE="default"
If using the Dapr CLI, point Dapr to the config file above to run the Dapr instance with mTLS enabled:
dapr run --app-id myapp --config ./config.yaml node myapp.js
If using daprd directly, use the following flags to enable mTLS:
daprd --app-id myapp --enable-mtls --sentry-address localhost:50001 --config=./config.yaml
Sentry service configuration
Here’s an example of a configuration for Sentry that changes the workload cert TTL to 25 seconds:
apiVersion: dapr.io/v1alpha1
kind: Configuration
metadata:
name: daprsystem
namespace: default
spec:
mtls:
enabled: true
workloadCertTTL: "25s"
In order to start Sentry service with a custom config, use the following flag:
./sentry --issuer-credentials $HOME/.dapr/certs --trust-domain cluster.local --config=./config.yaml
Bringing your own certificates
In order to provide your own credentials, create ECDSA PEM encoded root and issuer certificates and place them on the file system.
Tell the Sentry service where to load the certificates from using the --issuer-credentials flag.
The next examples creates root and issuer certs and loads them with the Sentry service.
Note: This example uses the step tool to create the certificates. You can install step tool from here. Windows binaries available here
Create the root certificate:
step certificate create cluster.local ca.crt ca.key --profile root-ca --no-password --insecure
Create the issuer certificate:
step certificate create cluster.local issuer.crt issuer.key --ca ca.crt --ca-key ca.key --profile intermediate-ca --not-after 8760h --no-password --insecure
This creates the root and issuer certs and keys.
Place ca.crt, issuer.crt and issuer.key in a desired path ($HOME/.dapr/certs in the example below), and launch Sentry:
./sentry --issuer-credentials $HOME/.dapr/certs --trust-domain cluster.local
Updating root or issuer certificates
If the Root or Issuer certs are about to expire, you can update them and restart the required system services.
To have Dapr generate new certificates, delete the existing certificates at $HOME/.dapr/certs and restart the sentry service to generate new certificates.
./sentry --issuer-credentials $HOME/.dapr/certs --trust-domain cluster.local --config=./config.yaml
To replace with your own certificates, first generate new certificates using the step above in Bringing your own certificates.
Copy ca.crt, issuer.crt and issuer.key to the filesystem path of every configured system service, and restart the process or container.
By default, system services will look for the credentials in /var/run/dapr/credentials. The examples above use $HOME/.dapr/certs as a custom location.
Note: If you signed the cert root with a different private key, restart the Dapr instances.
Community call video on certificate rotation
Watch this video on how to perform certificate rotation if your certificates are expiring.
Sentry Token Validators
Tokens are often used for authentication and authorization purposes. Token validators are components responsible for verifying the validity and authenticity of these tokens. For example in Kubernetes environments, a common approach to token validation is through the Kubernetes bound service account mechanism. This validator checks bound service account tokens against Kubernetes to ensure their legitimacy.
Sentry service can be configured to:
- Enable extra token validators beyond the Kubernetes bound Service Account validator
- Replace the
insecurevalidator enabled by default in self hosted mode
Sentry token validators are used for joining extra non-Kubernetes clients to the Dapr cluster running in Kubernetes mode, or replace the insecure “allow all” validator in self hosted mode to enable proper identity validation. It is not expected that you will need to configure a token validator unless you are using an exotic deployment scenario.
The only token validator currently supported is the
jwksvalidator.
JWKS
The jwks validator enables Sentry service to validate JWT tokens using a JWKS endpoint.
The contents of the token must contain the sub claim which matches the SPIFFE identity of the Dapr client, in the same Dapr format spiffe://<trust-domain>/ns/<namespace>/<app-id>.
The audience of the token must by the SPIFFE ID of the Sentry identity, For example, spiffe://cluster.local/ns/dapr-system/dapr-sentry.
Other basic JWT rules regarding signature, expiry etc. apply.
The jwks validator can accept either a remote source to fetch the public key list or a static array for public keys.
The configuration below enables the jwks token validator with a remote source.
This remote source uses HTTPS so the caCertificate field contains the root of trust for the remote source.
kind: Configuration
apiVersion: dapr.io/v1alpha1
metadata:
name: sentryconfig
spec:
mtls:
enabled: true
tokenValidators:
- name: jwks
options:
minRefreshInterval: 2m
requestTimeout: 1m
source: "https://localhost:1234/"
caCertificate: "<optional ca certificate bundle string>"
The configuration below enables the jwks token validator with a static array of public keys.
kind: Configuration
apiVersion: dapr.io/v1alpha1
metadata:
name: sentryconfig
spec:
mtls:
enabled: true
tokenValidators:
- name: jwks
options:
minRefreshInterval: 2m
requestTimeout: 1m
source: |
{"keys":[ "12345.." ]}
5.2 - Configure endpoint authorization with OAuth
Dapr OAuth 2.0 middleware allows you to enable OAuth authorization on Dapr endpoints for your web APIs using the Authorization Code Grant flow. You can also inject authorization tokens into your endpoint APIs which can be used for authorization towards external APIs called by your APIs using the Client Credentials Grant flow. When the middleware is enabled any method invocation through Dapr needs to be authorized before getting passed to the user code.
The main difference between the two flows is that the Authorization Code Grant flow needs user interaction and authorizes a user where the Client Credentials Grant flow doesn’t need a user interaction and authorizes a service/application.
Register your application with an authorization server
Different authorization servers provide different application registration experiences. Here are some samples:
To configure the Dapr OAuth middleware, you’ll need to collect the following information:
Authorization/Token URLs of some of the popular authorization servers:
Define the middleware component definition
Define an Authorization Code Grant component
An OAuth middleware (Authorization Code) is defined by a component:
apiVersion: dapr.io/v1alpha1
kind: Component
metadata:
name: oauth2
namespace: default
spec:
type: middleware.http.oauth2
version: v1
metadata:
- name: clientId
value: "<your client ID>"
- name: clientSecret
value: "<your client secret>"
- name: scopes
value: "<comma-separated scope names>"
- name: authURL
value: "<authorization URL>"
- name: tokenURL
value: "<token exchange URL>"
- name: redirectURL
value: "<redirect URL>"
- name: authHeaderName
value: "<header name under which the secret token is saved>"
# forceHTTPS:
# This key is used to set HTTPS schema on redirect to your API method
# after Dapr successfully received Access Token from Identity Provider.
# By default, Dapr will use HTTP on this redirect.
- name: forceHTTPS
value: "<set to true if you invoke an API method through Dapr from https origin>"
Define a custom pipeline for an Authorization Code Grant
To use the OAuth middleware (Authorization Code), you should create a custom pipeline using Dapr configuration, as shown in the following sample:
apiVersion: dapr.io/v1alpha1
kind: Configuration
metadata:
name: pipeline
namespace: default
spec:
httpPipeline:
handlers:
- name: oauth2
type: middleware.http.oauth2
Define a Client Credentials Grant component
An OAuth (Client Credentials) middleware is defined by a component:
apiVersion: dapr.io/v1alpha1
kind: Component
metadata:
name: myComponent
spec:
type: middleware.http.oauth2clientcredentials
version: v1
metadata:
- name: clientId
value: "<your client ID>"
- name: clientSecret
value: "<your client secret>"
- name: scopes
value: "<comma-separated scope names>"
- name: tokenURL
value: "<token issuing URL>"
- name: headerName
value: "<header name under which the secret token is saved>"
- name: endpointParamsQuery
value: "<list of additional key=value settings separated by ampersands or semicolons forwarded to the token issuing service>"
# authStyle:
# "0" means to auto-detect which authentication
# style the provider wants by trying both ways and caching
# the successful way for the future.
# "1" sends the "client_id" and "client_secret"
# in the POST body as application/x-www-form-urlencoded parameters.
# "2" sends the client_id and client_password
# using HTTP Basic Authorization. This is an optional style
# described in the OAuth2 RFC 6749 section 2.3.1.
- name: authStyle
value: "<see comment>"
Define a custom pipeline for a Client Credentials Grant
To use the OAuth middleware (Client Credentials), you should create a custom pipeline using Dapr configuration, as shown in the following sample:
apiVersion: dapr.io/v1alpha1
kind: Configuration
metadata:
name: pipeline
namespace: default
spec:
httpPipeline:
handlers:
- name: myComponent
type: middleware.http.oauth2clientcredentials
Apply the configuration
To apply the above configuration (regardless of grant type)
to your Dapr sidecar, add a dapr.io/config annotation to your pod spec:
apiVersion: apps/v1
kind: Deployment
...
spec:
...
template:
metadata:
...
annotations:
dapr.io/enabled: "true"
...
dapr.io/config: "pipeline"
...
Accessing the access token
Authorization Code Grant
Once everything is in place, whenever a client tries to invoke an API method through Dapr sidecar (such as calling the v1.0/invoke/ endpoint), it will be redirected to the authorization’s consent page if an access token is not found. Otherwise, the access token is written to the authHeaderName header and made available to the app code.
Client Credentials Grant
Once everything is in place, whenever a client tries to invoke an API method through Dapr sidecar (such as calling the v1.0/invoke/ endpoint), it will retrieve a new access token if an existing valid one is not found. The access token is written to the headerName header and made available to the app code. In that way the app can forward the token in the authorization header in calls towards the external API requesting that token.
5.3 - Enable API token authentication in Dapr
By default, Dapr relies on the network boundary to limit access to its public API. If you plan on exposing the Dapr API outside of that boundary, or if your deployment demands an additional level of security, consider enabling the token authentication for Dapr APIs. This will cause Dapr to require every incoming gRPC and HTTP request for its APIs for to include authentication token, before allowing that request to pass through.
Create a token
Dapr uses shared tokens for API authentication. You are free to define the API token to use.
Although Dapr does not impose any format for the shared token, a good idea is to generate a random byte sequence and encode it to Base64. For example, this command generates a random 32-byte key and encodes that as Base64:
openssl rand 16 | base64
Configure API token authentication in Dapr
The token authentication configuration is slightly different for either Kubernetes or self-hosted Dapr deployments:
Self-hosted
In self-hosting scenario, Dapr looks for the presence of DAPR_API_TOKEN environment variable. If that environment variable is set when the daprd process launches, Dapr enforces authentication on its public APIs:
export DAPR_API_TOKEN=<token>
To rotate the configured token, update the DAPR_API_TOKEN environment variable to the new value and restart the daprd process.
Kubernetes
In a Kubernetes deployment, Dapr leverages Kubernetes secrets store to hold the shared token. To configure Dapr APIs authentication, start by creating a new secret:
kubectl create secret generic dapr-api-token --from-literal=token=<token>
Note, the above secret needs to be created in each namespace in which you want to enable Dapr token authentication.
To indicate to Dapr to use that secret to secure its public APIs, add an annotation to your Deployment template spec:
annotations:
dapr.io/enabled: "true"
dapr.io/api-token-secret: "dapr-api-token" # name of the Kubernetes secret
When deployed, Dapr sidecar injector will automatically create a secret reference and inject the actual value into DAPR_API_TOKEN environment variable.
Rotate a token
Self-hosted
To rotate the configured token in self-hosted, update the DAPR_API_TOKEN environment variable to the new value and restart the daprd process.
Kubernetes
To rotate the configured token in Kubernetes, update the previously-created secret with the new token in each namespace. You can do that using kubectl patch command, but a simpler way to update these in each namespace is by using a manifest:
apiVersion: v1
kind: Secret
metadata:
name: dapr-api-token
type: Opaque
data:
token: <your-new-token>
And then apply it to each namespace:
kubectl apply --file token-secret.yaml --namespace <namespace-name>
To tell Dapr to start using the new token, trigger a rolling upgrade to each one of your deployments:
kubectl rollout restart deployment/<deployment-name> --namespace <namespace-name>
Assuming your service is configured with more than one replica, the key rotation process does not result in any downtime.
Adding API token to client API invocations
Once token authentication is configured in Dapr, all clients invoking Dapr API need to append the dapr-api-token token to every request.
Note: The Dapr SDKs read the DAPR_API_TOKEN environment variable and set it for you by default.
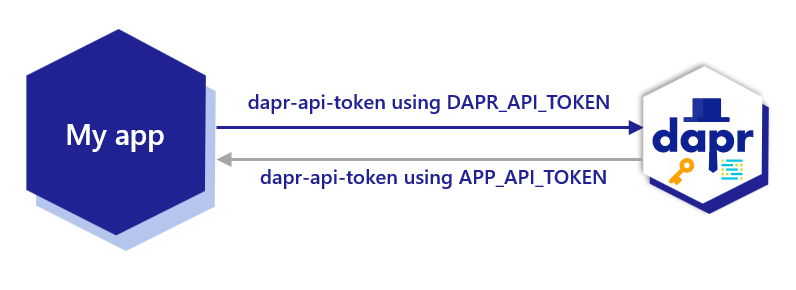
HTTP
In case of HTTP, Dapr requires the API token in the dapr-api-token header. For example:
GET http://<daprAddress>/v1.0/metadata
dapr-api-token: <token>
Using curl, you can pass the header using the --header (or -H) option. For example:
curl http://localhost:3500/v1.0/metadata \
--header "dapr-api-token: my-token"
gRPC
When using gRPC protocol, Dapr will inspect the incoming calls for the API token on the gRPC metadata:
dapr-api-token[0].
Accessing the token from the app
Kubernetes
In Kubernetes, it’s recommended to mount the secret to your pod as an environment variable, as shown in the example below, where a Kubernetes secret with the name dapr-api-token is used to hold the token.
containers:
- name: mycontainer
image: myregistry/myapp
envFrom:
- secretRef:
name: dapr-api-token
Self-hosted
In self-hosted mode, you can set the token as an environment variable for your app:
export DAPR_API_TOKEN=<my-dapr-token>
Related Links
5.4 - Authenticate requests from Dapr using token authentication
For some building blocks such as pub/sub, service invocation and input bindings, Dapr communicates with an app over HTTP or gRPC. To enable the application to authenticate requests that are arriving from the Dapr sidecar, you can configure Dapr to send an API token as a header (in HTTP requests) or metadata (in gRPC requests).
Create a token
Dapr uses shared tokens for API authentication. You are free to define the API token to use.
Although Dapr does not impose any format for the shared token, a good idea is to generate a random byte sequence and encode it to Base64. For example, this command generates a random 32-byte key and encodes that as Base64:
openssl rand 16 | base64
Configure app API token authentication in Dapr
The token authentication configuration is slightly different for either Kubernetes or self-hosted Dapr deployments:
Self-hosted
In self-hosting scenario, Dapr looks for the presence of APP_API_TOKEN environment variable. If that environment variable is set when the daprd process launches, Dapr includes the token when calling an app:
export APP_API_TOKEN=<token>
To rotate the configured token, update the APP_API_TOKEN environment variable to the new value and restart the daprd process.
Kubernetes
In a Kubernetes deployment, Dapr leverages Kubernetes secrets store to hold the shared token. To start, create a new secret:
kubectl create secret generic app-api-token --from-literal=token=<token>
Note, the above secret needs to be created in each namespace in which you want to enable app token authentication
To indicate to Dapr to use the token in the secret when sending requests to the app, add an annotation to your Deployment template spec:
annotations:
dapr.io/enabled: "true"
dapr.io/app-token-secret: "app-api-token" # name of the Kubernetes secret
When deployed, the Dapr Sidecar Injector automatically creates a secret reference and injects the actual value into APP_API_TOKEN environment variable.
Rotate a token
Self-hosted
To rotate the configured token in self-hosted, update the APP_API_TOKEN environment variable to the new value and restart the daprd process.
Kubernetes
To rotate the configured token in Kubernetes, update the previously-created secret with the new token in each namespace. You can do that using kubectl patch command, but a simpler way to update these in each namespace is by using a manifest:
apiVersion: v1
kind: Secret
metadata:
name: app-api-token
type: Opaque
data:
token: <your-new-token>
And then apply it to each namespace:
kubectl apply --file token-secret.yaml --namespace <namespace-name>
To tell Dapr to start using the new token, trigger a rolling upgrade to each one of your deployments:
kubectl rollout restart deployment/<deployment-name> --namespace <namespace-name>
Assuming your service is configured with more than one replica, the key rotation process does not result in any downtime.
Authenticating requests from Dapr
Once app token authentication is configured using the environment variable or Kubernetes secret app-api-token, the Dapr sidecar always includes the HTTP header/gRPC metadata dapr-api-token: <token> in the calls to the app. From the app side, ensure you are authenticating using the dapr-api-token value which uses the app-api-token you set to authenticate requests from Dapr.
HTTP
In your code, look for the HTTP header dapr-api-token in incoming requests:
dapr-api-token: <token>
gRPC
When using gRPC protocol, inspect the incoming calls for the API token on the gRPC metadata:
dapr-api-token[0].
Accessing the token from the app
Kubernetes
In Kubernetes, it’s recommended to mount the secret to your pod as an environment variable.
Assuming we created a secret with the name app-api-token to hold the token:
containers:
- name: mycontainer
image: myregistry/myapp
envFrom:
- secretRef:
name: app-api-token
Self-hosted
In self-hosted mode, you can set the token as an environment variable for your app:
export APP_API_TOKEN=<my-app-token>
Related Links
- Learn about Dapr security concepts
- Learn HowTo Enable API token authentication in Dapr
6 - Error recovery using resiliency policies
6.1 - Overview
Dapr provides the capability for defining and applying fault tolerance resiliency policies via a resiliency spec. Resiliency specs are saved in the same location as components specs and are applied when the Dapr sidecar starts. The sidecar determines how to apply resiliency policies to your Dapr API calls.
- In self-hosted mode: The resiliency spec must be named
resiliency.yaml. - In Kubernetes: Dapr finds the named resiliency specs used by your application.
Policies
You can configure Dapr resiliency policies with the following parts:
- Metadata defining where the policy applies (like namespace and scope)
- Policies specifying the resiliency name and behaviors, like:
- Targets determining which interactions these policies act on, including:
- Apps via service invocation
- Components
- Actors
Once defined, you can apply this configuration to your local Dapr components directory, or to your Kubernetes cluster using:
kubectl apply -f <resiliency-spec-name>.yaml
Additionally, you can scope resiliency policies to specific apps.
See known limitations.
Resiliency policy structure
Below is the general structure of a resiliency policy:
apiVersion: dapr.io/v1alpha1
kind: Resiliency
metadata:
name: myresiliency
scopes:
# optionally scope the policy to specific apps
spec:
policies:
timeouts:
# timeout policy definitions
retries:
# retry policy definitions
circuitBreakers:
# circuit breaker policy definitions
targets:
apps:
# apps and their applied policies here
actors:
# actor types and their applied policies here
components:
# components and their applied policies here
Complete example policy
apiVersion: dapr.io/v1alpha1
kind: Resiliency
metadata:
name: myresiliency
# similar to subscription and configuration specs, scopes lists the Dapr App IDs that this
# resiliency spec can be used by.
scopes:
- app1
- app2
spec:
# policies is where timeouts, retries and circuit breaker policies are defined.
# each is given a name so they can be referred to from the targets section in the resiliency spec.
policies:
# timeouts are simple named durations.
timeouts:
general: 5s
important: 60s
largeResponse: 10s
# retries are named templates for retry configurations and are instantiated for life of the operation.
retries:
pubsubRetry:
policy: constant
duration: 5s
maxRetries: 10
retryForever:
policy: exponential
maxInterval: 15s
maxRetries: -1 # retry indefinitely
important:
policy: constant
duration: 5s
maxRetries: 30
someOperation:
policy: exponential
maxInterval: 15s
largeResponse:
policy: constant
duration: 5s
maxRetries: 3
# circuit breakers are automatically instantiated per component and app instance.
# circuit breakers maintain counters that live as long as the Dapr sidecar is running. They are not persisted.
circuitBreakers:
simpleCB:
maxRequests: 1
timeout: 30s
trip: consecutiveFailures >= 5
pubsubCB:
maxRequests: 1
interval: 8s
timeout: 45s
trip: consecutiveFailures > 8
# targets are what named policies are applied to. Dapr supports 3 target types - apps, components and actors
targets:
apps:
appB:
timeout: general
retry: important
# circuit breakers for services are scoped app instance.
# when a breaker is tripped, that route is removed from load balancing for the configured `timeout` duration.
circuitBreaker: simpleCB
actors:
myActorType: # custom Actor Type Name
timeout: general
retry: important
# circuit breakers for actors are scoped by type, id, or both.
# when a breaker is tripped, that type or id is removed from the placement table for the configured `timeout` duration.
circuitBreaker: simpleCB
circuitBreakerScope: both ##
circuitBreakerCacheSize: 5000
components:
# for state stores, policies apply to saving and retrieving state.
statestore1: # any component name -- happens to be a state store here
outbound:
timeout: general
retry: retryForever
# circuit breakers for components are scoped per component configuration/instance. For example myRediscomponent.
# when this breaker is tripped, all interaction to that component is prevented for the configured `timeout` duration.
circuitBreaker: simpleCB
pubsub1: # any component name -- happens to be a pubsub broker here
outbound:
retry: pubsubRetry
circuitBreaker: pubsubCB
pubsub2: # any component name -- happens to be another pubsub broker here
outbound:
retry: pubsubRetry
circuitBreaker: pubsubCB
inbound: # inbound only applies to delivery from sidecar to app
timeout: general
retry: important
circuitBreaker: pubsubCB
Limitations
- Service invocation via gRPC: Currently, resiliency policies are not supported for service invocation via gRPC.
Demos
Watch this video for how to use resiliency:
Learn more about how to write resilient microservices with Dapr.
Next steps
Learn more about resiliency policies and targets:
Related links
Try out one of the Resiliency quickstarts:
6.2 - Resiliency policies
Define timeouts, retries, and circuit breaker policies under policies. Each policy is given a name so you can refer to them from the targets section in the resiliency spec.
6.2.1 - Timeout resiliency policies
Network calls can fail for many reasons, causing your application to wait indefinitely for responses. By setting a timeout duration, you can cut off those unresponsive services, freeing up resources to handle new requests.
Timeouts are optional policies that can be used to early-terminate long-running operations. Set a realistic timeout duration that reflects actual response times in production. If you’ve exceeded a timeout duration:
- The operation in progress is terminated (if possible).
- An error is returned.
Timeout policy format
spec:
policies:
# Timeouts are simple named durations.
timeouts:
timeoutName: timeout1
general: 5s
important: 60s
largeResponse: 10s
Spec metadata
| Field | Details | Example |
| timeoutName | Name of the timeout policy | timeout1 |
| general | Time duration for timeouts marked as “general”. Uses Go’s time.ParseDuration format. No set maximum value. | 15s, 2m, 1h30m |
| important | Time duration for timeouts marked as “important”. Uses Go’s time.ParseDuration format. No set maximum value. | 15s, 2m, 1h30m |
| largeResponse | Time duration for timeouts awaiting a large response. Uses Go’s time.ParseDuration format. No set maximum value. | 15s, 2m, 1h30m |
If you don’t specify a timeout value, the policy does not enforce a time and defaults to whatever you set up per the request client.
Next steps
Related links
Try out one of the Resiliency quickstarts:
6.2.2 - Retry and back-off resiliency policies
6.2.2.1 - Retry resiliency policies
Requests can fail due to transient errors, like encountering network congestion, reroutes to overloaded instances, and more. Sometimes, requests can fail due to other resiliency policies set in place, like triggering a defined timeout or circuit breaker policy.
In these cases, configuring retries can either:
- Send the same request to a different instance, or
- Retry sending the request after the condition has cleared.
Retries and timeouts work together, with timeouts ensuring your system fails fast when needed, and retries recovering from temporary glitches.
Dapr provides default resiliency policies, which you can overwrite with user-defined retry policies.
Important
Each pub/sub component has its own built-in retry behaviors. Explicity applying a Dapr resiliency policy doesn’t override these implicit retry policies. Rather, the resiliency policy augments the built-in retry, which can cause repetitive clustering of messages.Retry policy format
Example 1
spec:
policies:
# Retries are named templates for retry configurations and are instantiated for life of the operation.
retries:
pubsubRetry:
policy: constant
duration: 5s
maxRetries: 10
retryForever:
policy: exponential
maxInterval: 15s
maxRetries: -1 # Retry indefinitely
Example 2
spec:
policies:
retries:
retry5xxOnly:
policy: constant
duration: 5s
maxRetries: 3
matching:
httpStatusCodes: "429,500-599" # retry the HTTP status codes in this range. All others are not retried.
gRPCStatusCodes: "1-4,8-11,13,14" # retry gRPC status codes in these ranges and separate single codes.
Spec metadata
The following retry options are configurable:
| Retry option | Description |
|---|---|
policy | Determines the back-off and retry interval strategy. Valid values are constant and exponential.Defaults to constant. |
duration | Determines the time interval between retries. Only applies to the constant policy.Valid values are of the form 200ms, 15s, 2m, etc.Defaults to 5s. |
maxInterval | Determines the maximum interval between retries to which the exponential back-off policy can grow.Additional retries always occur after a duration of maxInterval. Defaults to 60s. Valid values are of the form 5s, 1m, 1m30s, etc |
maxRetries | The maximum number of retries to attempt.-1 denotes an unlimited number of retries, while 0 means the request will not be retried (essentially behaving as if the retry policy were not set).Defaults to -1. |
matching.httpStatusCodes | Optional: a comma-separated string of HTTP status codes or code ranges to retry. Status codes not listed are not retried. Valid values: 100-599, Reference Format: <code> or range <start>-<end>Example: “429,501-503” Default: empty string "" or field is not set. Retries on all HTTP errors. |
matching.gRPCStatusCodes | Optional: a comma-separated string of gRPC status codes or code ranges to retry. Status codes not listed are not retried. Valid values: 0-16, Reference Format: <code> or range <start>-<end>Example: “4,8,14” Default: empty string "" or field is not set. Retries on all gRPC errors. |
Exponential back-off policy
The exponential back-off window uses the following formula:
BackOffDuration = PreviousBackOffDuration * (Random value from 0.5 to 1.5) * 1.5
if BackOffDuration > maxInterval {
BackoffDuration = maxInterval
}
Retry status codes
When applications span multiple services, especially on dynamic environments like Kubernetes, services can disappear for all kinds of reasons and network calls can start hanging. Status codes provide a glimpse into our operations and where they may have failed in production.
HTTP
The following table includes some examples of HTTP status codes you may receive and whether you should or should not retry certain operations.
| HTTP Status Code | Retry Recommended? | Description |
|---|---|---|
| 404 Not Found | ❌ No | The resource doesn’t exist. |
| 400 Bad Request | ❌ No | Your request is invalid. |
| 401 Unauthorized | ❌ No | Try getting new credentials. |
| 408 Request Timeout | ✅ Yes | The server timed out waiting for the request. |
| 429 Too Many Requests | ✅ Yes | (Respect the Retry-After header, if present). |
| 500 Internal Server Error | ✅ Yes | The server encountered an unexpected condition. |
| 502 Bad Gateway | ✅ Yes | A gateway or proxy received an invalid response. |
| 503 Service Unavailable | ✅ Yes | Service might recover. |
| 504 Gateway Timeout | ✅ Yes | Temporary network issue. |
gRPC
The following table includes some examples of gRPC status codes you may receive and whether you should or should not retry certain operations.
| gRPC Status Code | Retry Recommended? | Description |
|---|---|---|
| Code 1 CANCELLED | ❌ No | N/A |
| Code 3 INVALID_ARGUMENT | ❌ No | N/A |
| Code 4 DEADLINE_EXCEEDED | ✅ Yes | Retry with backoff |
| Code 5 NOT_FOUND | ❌ No | N/A |
| Code 8 RESOURCE_EXHAUSTED | ✅ Yes | Retry with backoff |
| Code 14 UNAVAILABLE | ✅ Yes | Retry with backoff |
Retry filter based on status codes
The retry filter enables granular control over retry policies by allowing users to specify HTTP and gRPC status codes or ranges for which retries should apply.
spec:
policies:
retries:
retry5xxOnly:
# ...
matching:
httpStatusCodes: "429,500-599" # retry the HTTP status codes in this range. All others are not retried.
gRPCStatusCodes: "4,8-11,13,14" # retry gRPC status codes in these ranges and separate single codes.
Note
Field values for status codes must follow the format specified above. An incorrectly formatted value produces an error log (“Could not read resiliency policy”) and thedaprd startup sequence will proceed.Demo
Watch a demo presented during Diagrid’s Dapr v1.15 celebration to see how to set retry status code filters using Diagrid Conductor
Next steps
- [Learn how to override default retry policies for specific APIs.]({[< ref override-default-retries.md >]})
- Learn how to target your retry policies from the resiliency spec.
- Learn more about:
Related links
Try out one of the Resiliency quickstarts:
6.2.2.2 - Override default retry resiliency policies
Dapr provides default retries for any unsuccessful request, such as failures and transient errors. Within a resiliency spec, you have the option to override Dapr’s default retry logic by defining policies with reserved, named keywords. For example, defining a policy with the name DaprBuiltInServiceRetries, overrides the default retries for failures between sidecars via service-to-service requests. Policy overrides are not applied to specific targets.
Note: Although you can override default values with more robust retries, you cannot override with lesser values than the provided default value, or completely remove default retries. This prevents unexpected downtime.
Below is a table that describes Dapr’s default retries and the policy keywords to override them:
| Capability | Override Keyword | Default Retry Behavior | Description |
|---|---|---|---|
| Service Invocation | DaprBuiltInServiceRetries | Per call retries are performed with a backoff interval of 1 second, up to a threshold of 3 times. | Sidecar-to-sidecar requests (a service invocation method call) that fail and result in a gRPC code Unavailable or Unauthenticated |
| Actors | DaprBuiltInActorRetries | Per call retries are performed with a backoff interval of 1 second, up to a threshold of 3 times. | Sidecar-to-sidecar requests (an actor method call) that fail and result in a gRPC code Unavailable or Unauthenticated |
| Actor Reminders | DaprBuiltInActorReminderRetries | Per call retries are performed with an exponential backoff with an initial interval of 500ms, up to a maximum of 60s for a duration of 15mins | Requests that fail to persist an actor reminder to a state store |
| Initialization Retries | DaprBuiltInInitializationRetries | Per call retries are performed 3 times with an exponential backoff, an initial interval of 500ms and for a duration of 10s | Failures when making a request to an application to retrieve a given spec. For example, failure to retrieve a subscription, component or resiliency specification |
The resiliency spec example below shows overriding the default retries for all service invocation requests by using the reserved, named keyword ‘DaprBuiltInServiceRetries’.
Also defined is a retry policy called ‘retryForever’ that is only applied to the appB target. appB uses the ‘retryForever’ retry policy, while all other application service invocation retry failures use the overridden ‘DaprBuiltInServiceRetries’ default policy.
spec:
policies:
retries:
DaprBuiltInServiceRetries: # Overrides default retry behavior for service-to-service calls
policy: constant
duration: 5s
maxRetries: 10
retryForever: # A user defined retry policy replaces default retries. Targets rely solely on the applied policy.
policy: exponential
maxInterval: 15s
maxRetries: -1 # Retry indefinitely
targets:
apps:
appB: # app-id of the target service
retry: retryForever
Related links
Try out one of the Resiliency quickstarts:
6.2.3 - Circuit breaker resiliency policies
Circuit breaker policies are used when other applications/services/components are experiencing elevated failure rates. Circuit breakers reduce load by monitoring the requests and shutting off all traffic to the impacted service when a certain criteria is met.
After a certain number of requests fail, circuit breakers “trip” or open to prevent cascading failures. By doing this, circuit breakers give the service time to recover from their outage instead of flooding it with events.
The circuit breaker can also enter a “half-open” state, allowing partial traffic through to see if the system has healed.
Once requests resume being successful, the circuit breaker gets into “closed” state and allows traffic to completely resume.
Circuit breaker policy format
spec:
policies:
circuitBreakers:
pubsubCB:
maxRequests: 1
interval: 8s
timeout: 45s
trip: consecutiveFailures > 8
Spec metadata
| Retry option | Description |
|---|---|
maxRequests | The maximum number of requests allowed to pass through when the circuit breaker is half-open (recovering from failure). Defaults to 1. |
interval | The cyclical period of time used by the circuit breaker to clear its internal counts. If set to 0 seconds, this never clears. Defaults to 0s. |
timeout | The period of the open state (directly after failure) until the circuit breaker switches to half-open. Defaults to 60s. |
trip | A Common Expression Language (CEL) statement that is evaluated by the circuit breaker. When the statement evaluates to true, the circuit breaker trips and becomes open. Defaults to consecutiveFailures > 5. Other possible values are requests and totalFailures where requests represents the number of either successful or failed calls before the circuit opens and totalFailures represents the total (not necessarily consecutive) number of failed attempts before the circuit opens. Example: requests > 5 and totalFailures >3. |
Next steps
Related links
Try out one of the Resiliency quickstarts:
6.2.4 - Default resiliency policies
In resiliency, you can set default policies, which have a broad scope. This is done through reserved keywords that let Dapr know when to apply the policy. There are 3 default policy types:
DefaultRetryPolicyDefaultTimeoutPolicyDefaultCircuitBreakerPolicy
If these policies are defined, they are used for every operation to a service, application, or component. They can also be modified to be more specific through the appending of additional keywords. The specific policies follow the following pattern, Default%sRetryPolicy, Default%sTimeoutPolicy, and Default%sCircuitBreakerPolicy. Where the %s is replaced by a target of the policy.
Below is a table of all possible default policy keywords and how they translate into a policy name.
| Keyword | Target Operation | Example Policy Name |
|---|---|---|
App | Service invocation. | DefaultAppRetryPolicy |
Actor | Actor invocation. | DefaultActorTimeoutPolicy |
Component | All component operations. | DefaultComponentCircuitBreakerPolicy |
ComponentInbound | All inbound component operations. | DefaultComponentInboundRetryPolicy |
ComponentOutbound | All outbound component operations. | DefaultComponentOutboundTimeoutPolicy |
StatestoreComponentOutbound | All statestore component operations. | DefaultStatestoreComponentOutboundCircuitBreakerPolicy |
PubsubComponentOutbound | All outbound pubusub (publish) component operations. | DefaultPubsubComponentOutboundRetryPolicy |
PubsubComponentInbound | All inbound pubsub (subscribe) component operations. | DefaultPubsubComponentInboundTimeoutPolicy |
BindingComponentOutbound | All outbound binding (invoke) component operations. | DefaultBindingComponentOutboundCircuitBreakerPolicy |
BindingComponentInbound | All inbound binding (read) component operations. | DefaultBindingComponentInboundRetryPolicy |
SecretstoreComponentOutbound | All secretstore component operations. | DefaultSecretstoreComponentTimeoutPolicy |
ConfigurationComponentOutbound | All configuration component operations. | DefaultConfigurationComponentOutboundCircuitBreakerPolicy |
LockComponentOutbound | All lock component operations. | DefaultLockComponentOutboundRetryPolicy |
Policy hierarchy resolution
Default policies are applied if the operation being executed matches the policy type and if there is no more specific policy targeting it. For each target type (app, actor, and component), the policy with the highest priority is a Named Policy, one that targets that construct specifically.
If none exists, the policies are applied from most specific to most broad.
How default policies and built-in retries work together
In the case of the built-in retries, default policies do not stop the built-in retry policies from running. Both are used together but only under specific circumstances.
For service and actor invocation, the built-in retries deal specifically with issues connecting to the remote sidecar (when needed). As these are important to the stability of the Dapr runtime, they are not disabled unless a named policy is specifically referenced for an operation. In some instances, there may be additional retries from both the built-in retry and the default retry policy, but this prevents an overly weak default policy from reducing the sidecar’s availability/success rate.
Policy resolution hierarchy for applications, from most specific to most broad:
- Named Policies in App Targets
- Default App Policies / Built-In Service Retries
- Default Policies / Built-In Service Retries
Policy resolution hierarchy for actors, from most specific to most broad:
- Named Policies in Actor Targets
- Default Actor Policies / Built-In Actor Retries
- Default Policies / Built-In Actor Retries
Policy resolution hierarchy for components, from most specific to most broad:
- Named Policies in Component Targets
- Default Component Type + Component Direction Policies / Built-In Actor Reminder Retries (if applicable)
- Default Component Direction Policies / Built-In Actor Reminder Retries (if applicable)
- Default Component Policies / Built-In Actor Reminder Retries (if applicable)
- Default Policies / Built-In Actor Reminder Retries (if applicable)
As an example, take the following solution consisting of three applications, three components and two actor types:
Applications:
- AppA
- AppB
- AppC
Components:
- Redis Pubsub: pubsub
- Redis statestore: statestore
- CosmosDB Statestore: actorstore
Actors:
- EventActor
- SummaryActor
Below is policy that uses both default and named policies as applies these to the targets.
spec:
policies:
retries:
# Global Retry Policy
DefaultRetryPolicy:
policy: constant
duration: 1s
maxRetries: 3
# Global Retry Policy for Apps
DefaultAppRetryPolicy:
policy: constant
duration: 100ms
maxRetries: 5
# Global Retry Policy for Apps
DefaultActorRetryPolicy:
policy: exponential
maxInterval: 15s
maxRetries: 10
# Global Retry Policy for Inbound Component operations
DefaultComponentInboundRetryPolicy:
policy: constant
duration: 5s
maxRetries: 5
# Global Retry Policy for Statestores
DefaultStatestoreComponentOutboundRetryPolicy:
policy: exponential
maxInterval: 60s
maxRetries: -1
# Named policy
fastRetries:
policy: constant
duration: 10ms
maxRetries: 3
# Named policy
retryForever:
policy: exponential
maxInterval: 10s
maxRetries: -1
targets:
apps:
appA:
retry: fastRetries
appB:
retry: retryForever
actors:
EventActor:
retry: retryForever
components:
actorstore:
retry: fastRetries
The table below is a break down of which policies are applied when attempting to call the various targets in this solution.
| Target | Policy Used |
|---|---|
| AppA | fastRetries |
| AppB | retryForever |
| AppC | DefaultAppRetryPolicy / DaprBuiltInActorRetries |
| pubsub - Publish | DefaultRetryPolicy |
| pubsub - Subscribe | DefaultComponentInboundRetryPolicy |
| statestore | DefaultStatestoreComponentOutboundRetryPolicy |
| actorstore | fastRetries |
| EventActor | retryForever |
| SummaryActor | DefaultActorRetryPolicy |
Next steps
Learn how to override default retry policies.
Related links
Try out one of the Resiliency quickstarts:
6.3 - Targets
Targets
Named policies are applied to targets. Dapr supports three target types that apply all Dapr building block APIs:
appscomponentsactors
Apps
With the apps target, you can apply retry, timeout, and circuitBreaker policies to service invocation calls between Dapr apps. Under targets/apps, policies are applied to each target service’s app-id. The policies are invoked when a failure occurs in communication between sidecars, as shown in the diagram below.
Dapr provides built-in service invocation retries, so any applied
retrypolicies are additional.
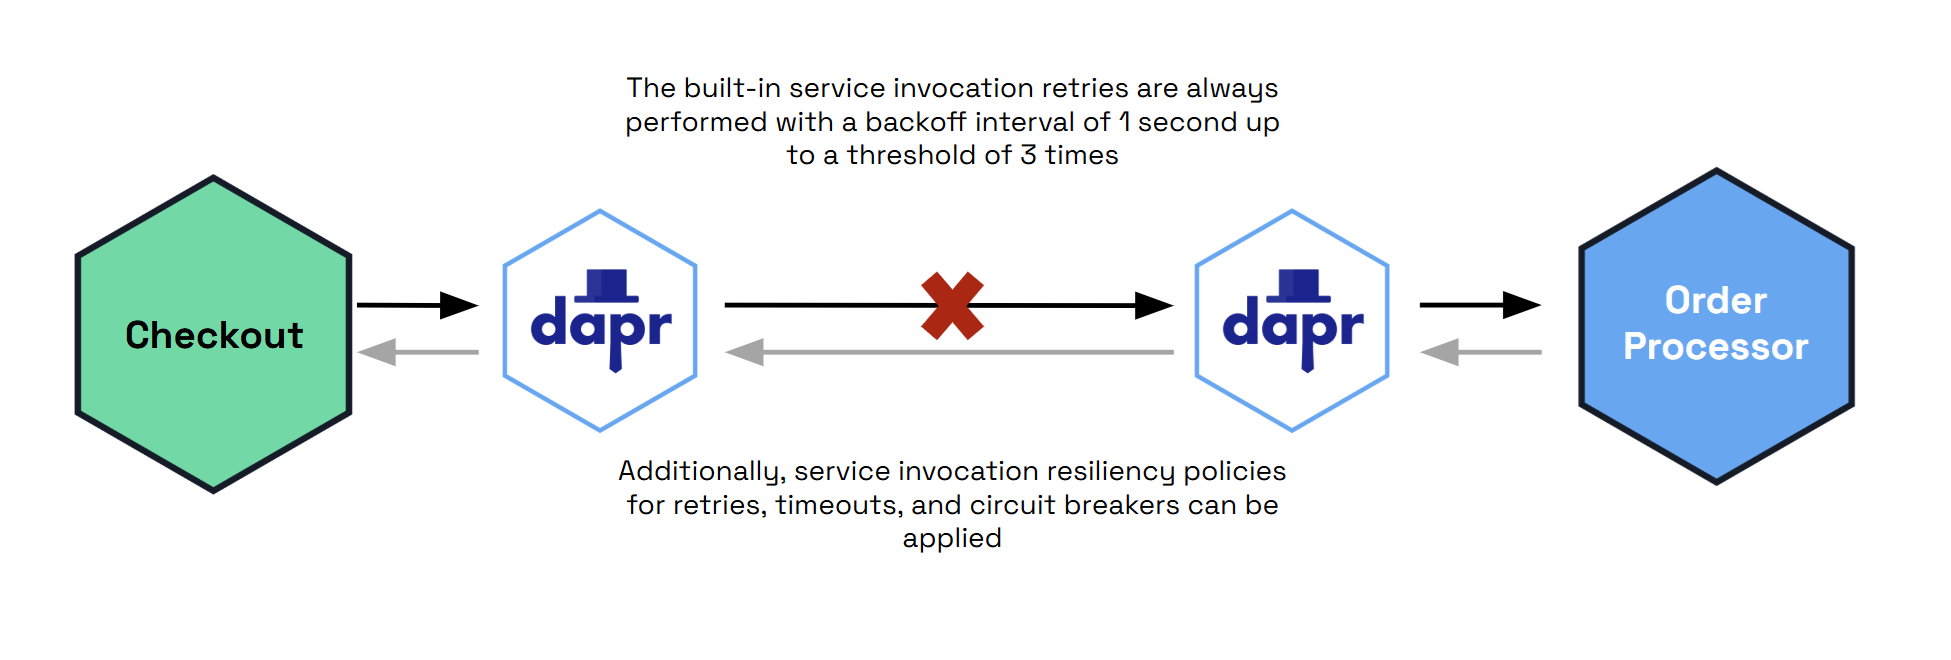
Example of policies to a target app with the app-id “appB”:
specs:
targets:
apps:
appB: # app-id of the target service
timeout: general
retry: general
circuitBreaker: general
Components
With the components target, you can apply retry, timeout and circuitBreaker policies to component operations.
Policies can be applied for outbound operations (calls to the Dapr sidecar) and/or inbound (the sidecar calling your app).
Outbound
outbound operations are calls from the sidecar to a component, such as:
- Persisting or retrieving state.
- Publishing a message on a PubSub component.
- Invoking an output binding.
Some components may have built-in retry capabilities and are configured on a per-component basis.
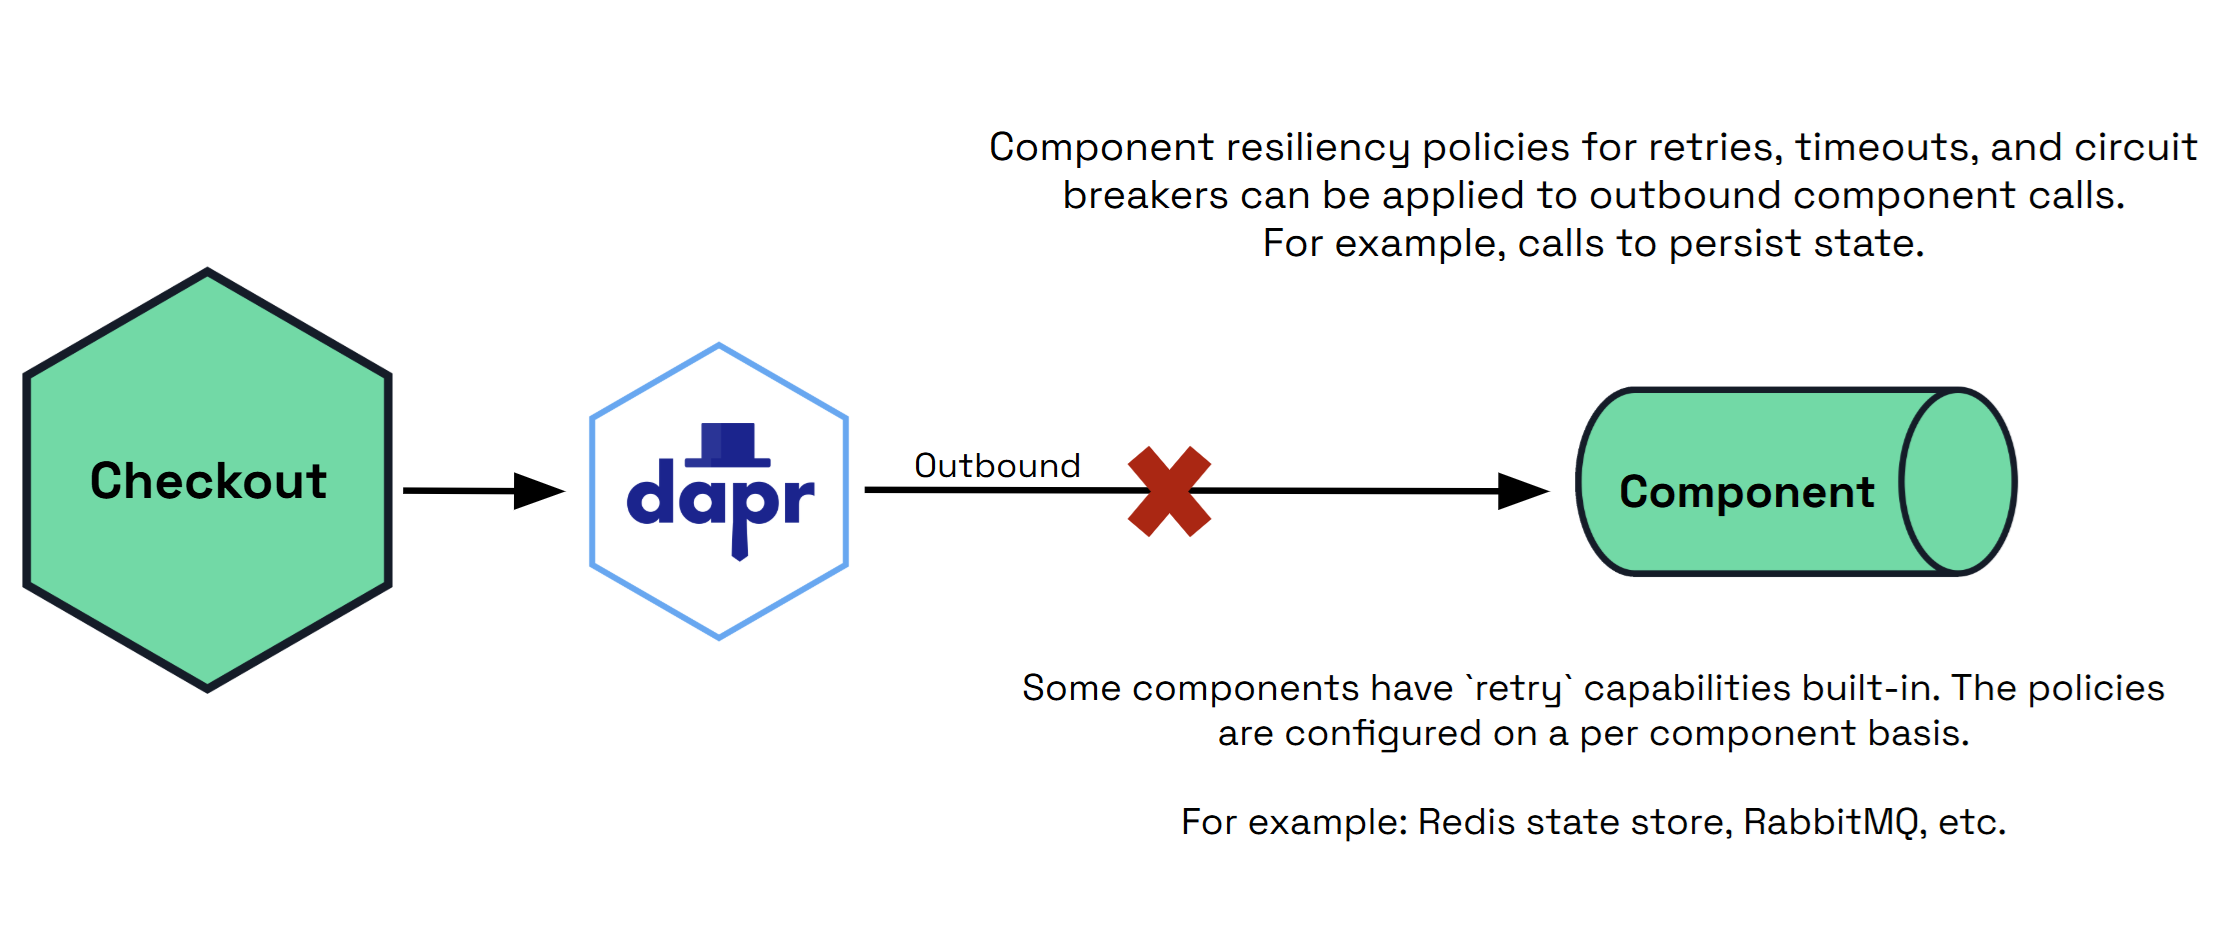
spec:
targets:
components:
myStateStore:
outbound:
retry: retryForever
circuitBreaker: simpleCB
Inbound
inbound operations are calls from the sidecar to your application, such as:
- PubSub subscriptions when delivering a message.
- Input bindings.
Some components may have built-in retry capabilities and are configured on a per-component basis.
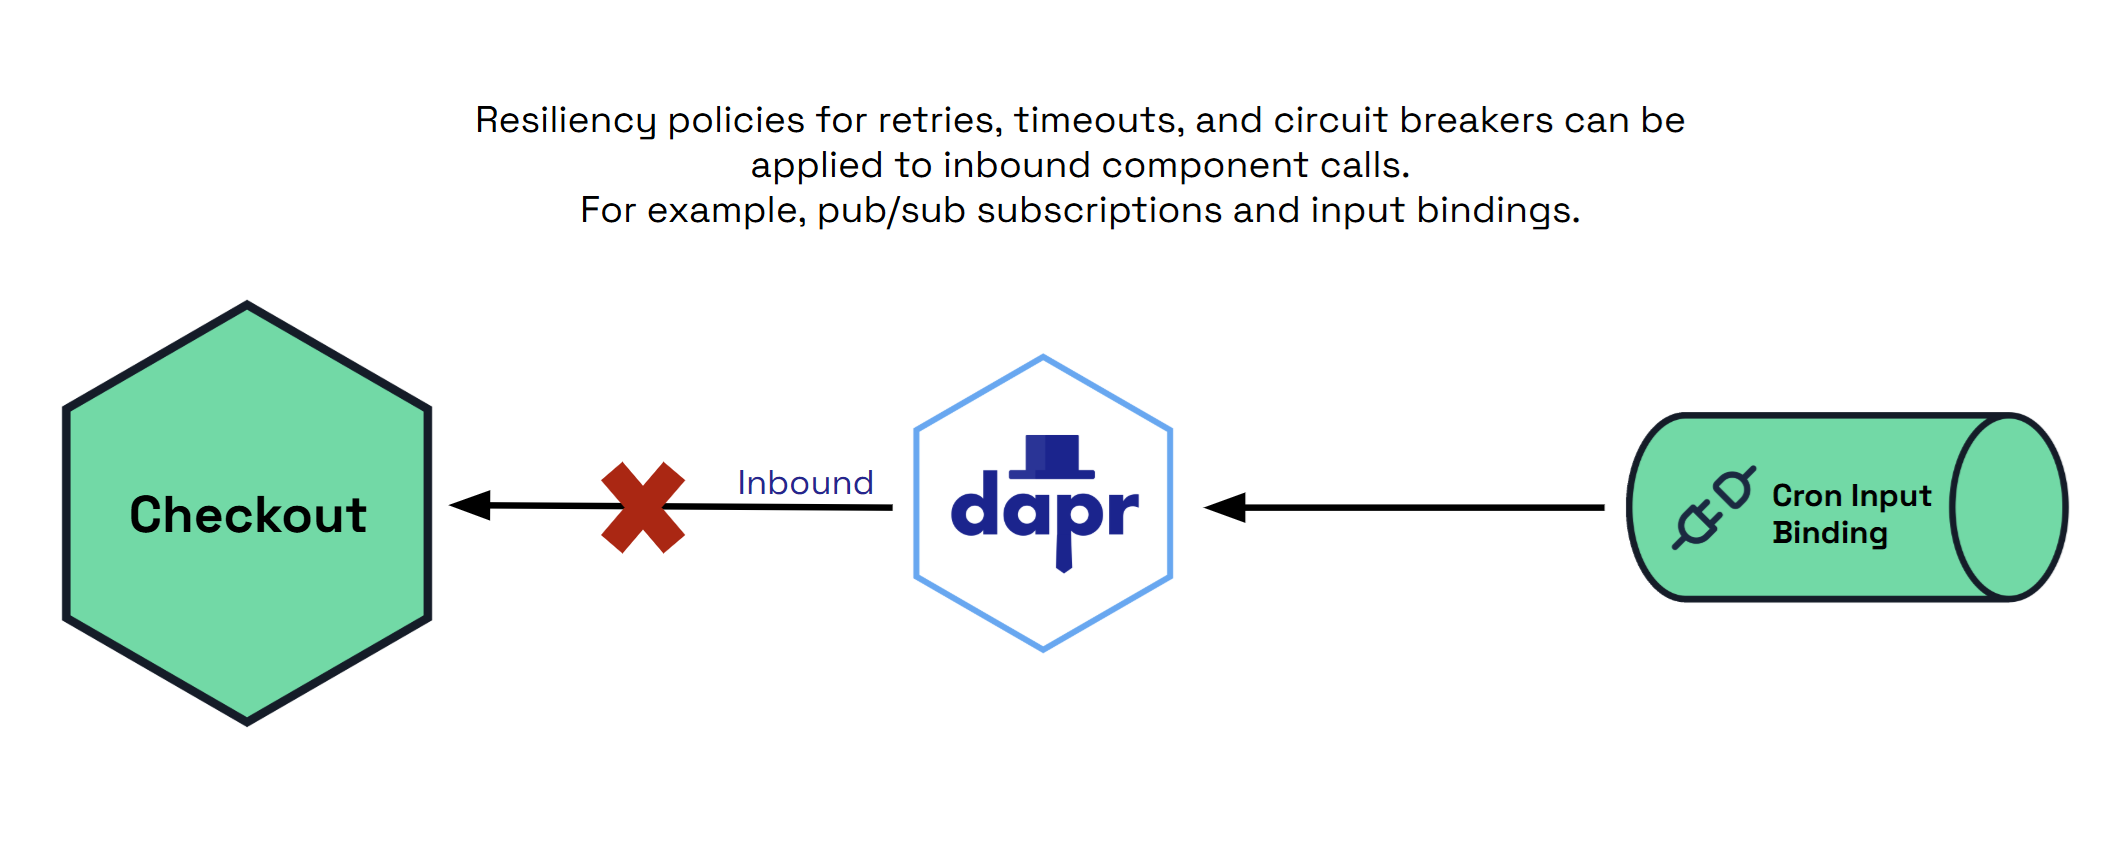
spec:
targets:
components:
myInputBinding:
inbound:
timeout: general
retry: general
circuitBreaker: general
PubSub
In a PubSub target/component, you can specify both inbound and outbound operations.
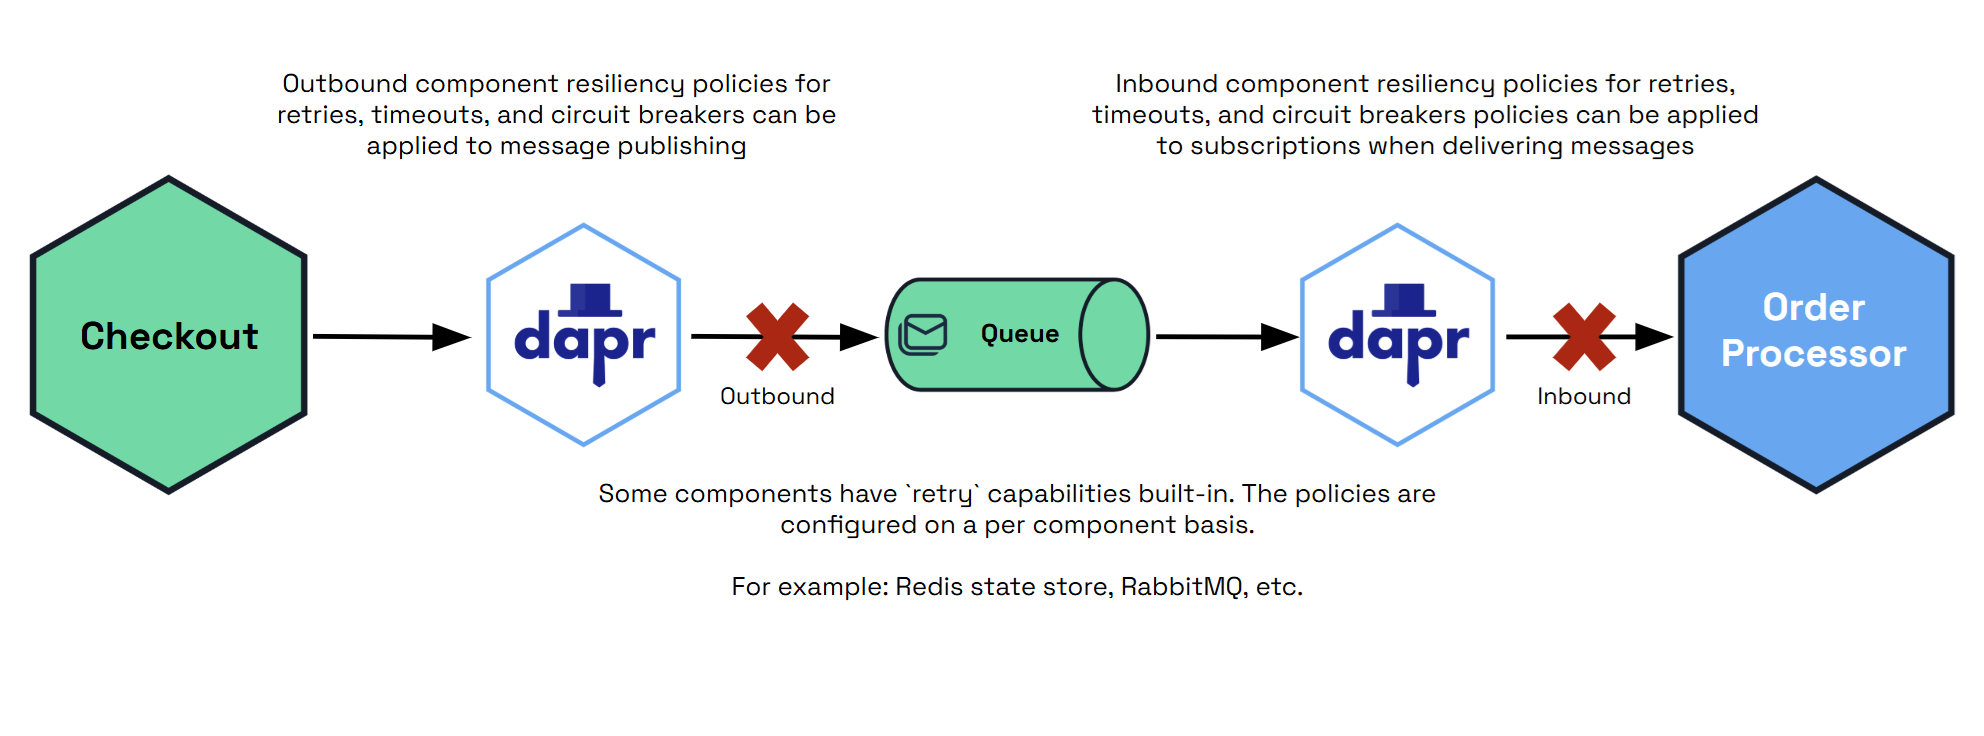
spec:
targets:
components:
myPubsub:
outbound:
retry: pubsubRetry
circuitBreaker: pubsubCB
inbound: # inbound only applies to delivery from sidecar to app
timeout: general
retry: general
circuitBreaker: general
Actors
With the actors target, you can apply retry, timeout, and circuitBreaker policies to actor operations.
When using a circuitBreaker policy for the actors target, you can specify how circuit breaking state should be scoped by using circuitBreakerScope:
id: an individual actor IDtype: all actors of a given actor typeboth: both of the above
You can also specify a cache size for the number of circuit breakers to keep in memory with the circuitBreakerCacheSize property, providing an integer value, e.g. 5000.
Example
spec:
targets:
actors:
myActorType:
timeout: general
retry: general
circuitBreaker: general
circuitBreakerScope: both
circuitBreakerCacheSize: 5000
Next steps
Try out one of the Resiliency quickstarts:
6.4 - Health checks
6.4.1 - App health checks
The app health checks feature allows probing for the health of your application and reacting to status changes.
Applications can become unresponsive for a variety of reasons. For example, your application:
- Could be too busy to accept new work;
- Could have crashed; or
- Could be in a deadlock state.
Sometimes the condition can be transitory, for example:
- If the app is just busy and will resume accepting new work eventually
- If the application is being restarted for whatever reason and is in its initialization phase
App health checks are disabled by default. Once you enable app health checks, the Dapr runtime (sidecar) periodically polls your application via HTTP or gRPC calls. When it detects a failure in the app’s health, Dapr stops accepting new work on behalf of the application by:
- Unsubscribing from all pub/sub subscriptions
- Stopping all input bindings
- Short-circuiting all service-invocation requests, which terminate in the Dapr runtime and are not forwarded to the application
- Unregistering Dapr Actor types, thereby causing Actor instances to migrate to a different replica if one is available
These changes are meant to be temporary, and Dapr resumes normal operations once it detects that the application is responsive again.
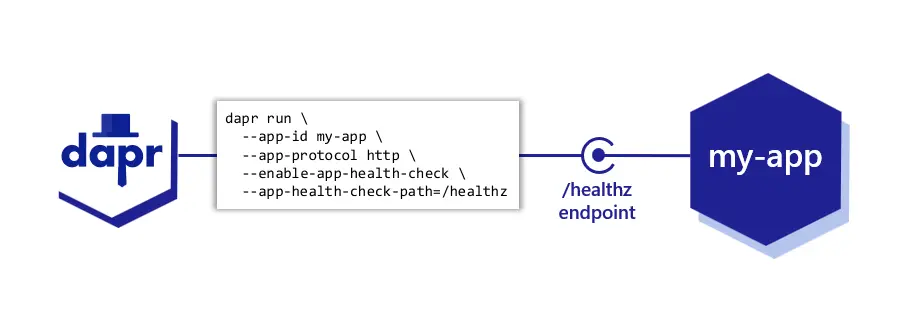
App health checks vs platform-level health checks
App health checks in Dapr are meant to be complementary to, and not replace, any platform-level health checks, like liveness probes when running on Kubernetes.
Platform-level health checks (or liveness probes) generally ensure that the application is running, and cause the platform to restart the application in case of failures.
Unlike platform-level health checks, Dapr’s app health checks focus on pausing work to an application that is currently unable to accept it, but is expected to be able to resume accepting work eventually. Goals include:
- Not bringing more load to an application that is already overloaded.
- Do the “polite” thing by not taking messages from queues, bindings, or pub/sub brokers when Dapr knows the application won’t be able to process them.
In this regard, Dapr’s app health checks are “softer”, waiting for an application to be able to process work, rather than terminating the running process in a “hard” way.
Note
For Kubernetes, a failing app health check won’t remove a pod from service discovery: this remains the responsibility of the Kubernetes liveness probe, not Dapr.Configuring app health checks
App health checks are disabled by default, but can be enabled with either:
- The
--enable-app-health-checkCLI flag; or - The
dapr.io/enable-app-health-check: trueannotation when running on Kubernetes.
Adding this flag is both necessary and sufficient to enable app health checks with the default options.
The full list of options are listed in this table:
| CLI flags | Kubernetes deployment annotation | Description | Default value |
|---|---|---|---|
--enable-app-health-check | dapr.io/enable-app-health-check | Boolean that enables the health checks | Disabled |
--app-health-check-path | dapr.io/app-health-check-path | Path that Dapr invokes for health probes when the app channel is HTTP (this value is ignored if the app channel is using gRPC) | /healthz |
--app-health-probe-interval | dapr.io/app-health-probe-interval | Number of seconds between each health probe | 5 |
--app-health-probe-timeout | dapr.io/app-health-probe-timeout | Timeout in milliseconds for health probe requests | 500 |
--app-health-threshold | dapr.io/app-health-threshold | Max number of consecutive failures before the app is considered unhealthy | 3 |
See the full Dapr arguments and annotations reference for all options and how to enable them.
Additionally, app health checks are impacted by the protocol used for the app channel, which is configured with the following flag or annotation:
| CLI flag | Kubernetes deployment annotation | Description | Default value |
|---|---|---|---|
--app-protocol | dapr.io/app-protocol | Protocol used for the app channel. supported values are http, grpc, https, grpcs, and h2c (HTTP/2 Cleartext). | http |
Note
A low app health probe timeout value can classify an application as unhealthy if it experiences a sudden high load, causing the response time to degrade. If this happens, increase thedapr.io/app-health-probe-timeout value.Health check paths
HTTP
When using HTTP (including http, https, and h2c) for app-protocol, Dapr performs health probes by making an HTTP call to the path specified in app-health-check-path, which is /health by default.
For your app to be considered healthy, the response must have an HTTP status code in the 200-299 range. Any other status code is considered a failure. Dapr is only concerned with the status code of the response, and ignores any response header or body.
gRPC
When using gRPC for the app channel (app-protocol set to grpc or grpcs), Dapr invokes the method /dapr.proto.runtime.v1.AppCallbackHealthCheck/HealthCheck in your application. Most likely, you will use a Dapr SDK to implement the handler for this method.
While responding to a health probe request, your app may decide to perform additional internal health checks to determine if it’s ready to process work from the Dapr runtime. However, this is not required; it’s a choice that depends on your application’s needs.
Intervals, timeouts, and thresholds
Intervals
By default, when app health checks are enabled, Dapr probes your application every 5 seconds. You can configure the interval, in seconds, with app-health-probe-interval. These probes happen regularly, regardless of whether your application is healthy or not.
Timeouts
When the Dapr runtime (sidecar) is initially started, Dapr waits for a successful health probe before considering the app healthy. This means that pub/sub subscriptions, input bindings, and service invocation requests won’t be enabled for your application until this first health check is complete and successful.
Health probe requests are considered successful if the application sends a successful response (as explained above) within the timeout configured in app-health-probe-timeout. The default value is 500, corresponding to 500 milliseconds (half a second).
Thresholds
Before Dapr considers an app to have entered an unhealthy state, it will wait for app-health-threshold consecutive failures, whose default value is 3. This default value means that your application must fail health probes 3 times in a row to be considered unhealthy.
If you set the threshold to 1, any failure causes Dapr to assume your app is unhealthy and will stop delivering work to it.
A threshold greater than 1 can help exclude transient failures due to external circumstances. The right value for your application depends on your requirements.
Thresholds only apply to failures. A single successful response is enough for Dapr to consider your app to be healthy and resume normal operations.
Example
Use the CLI flags with the dapr run command to enable app health checks:
dapr run \
--app-id my-app \
--app-port 7001 \
--app-protocol http \
--enable-app-health-check \
--app-health-check-path=/healthz \
--app-health-probe-interval 3 \
--app-health-probe-timeout 200 \
--app-health-threshold 2 \
-- \
<command to execute>
To enable app health checks in Kubernetes, add the relevant annotations to your Deployment:
apiVersion: apps/v1
kind: Deployment
metadata:
name: my-app
labels:
app: my-app
spec:
template:
metadata:
labels:
app: my-app
annotations:
dapr.io/enabled: "true"
dapr.io/app-id: "my-app"
dapr.io/app-port: "7001"
dapr.io/app-protocol: "http"
dapr.io/enable-app-health-check: "true"
dapr.io/app-health-check-path: "/healthz"
dapr.io/app-health-probe-interval: "3"
dapr.io/app-health-probe-timeout: "200"
dapr.io/app-health-threshold: "2"
Demo
Watch this video for an overview of using app health checks:
6.4.2 - Sidecar health
Dapr provides a way to determine its health using an HTTP /healthz endpoint. With this endpoint, the daprd process, or sidecar, can be:
- Probed for its overall health
- Probed for Dapr sidecar readiness from infrastructure platforms
- Determined for readiness and liveness with Kubernetes
In this guide, you learn how the Dapr /healthz endpoint integrates with health probes from the application hosting platform (for example, Kubernetes) as well as the Dapr SDKs.
Important
Do not depend on the/healthz endpoint in your application code. Having your application depend on the /healthz endpoint will fail for some cases (such as apps using Actor and Workflow APIs) and is considered bad practice in others as it creates a circular dependency. The /healthz endpoint is designed for infrastructure health checks (like Kubernetes probes), not for application-level health validation.Note
Dapr actors also have a health API endpoint where Dapr probes the application for a response to a signal from Dapr that the actor application is healthy and running. See actor health API.The following diagram shows the steps when a Dapr sidecar starts, the healthz endpoint and when the app channel is initialized.
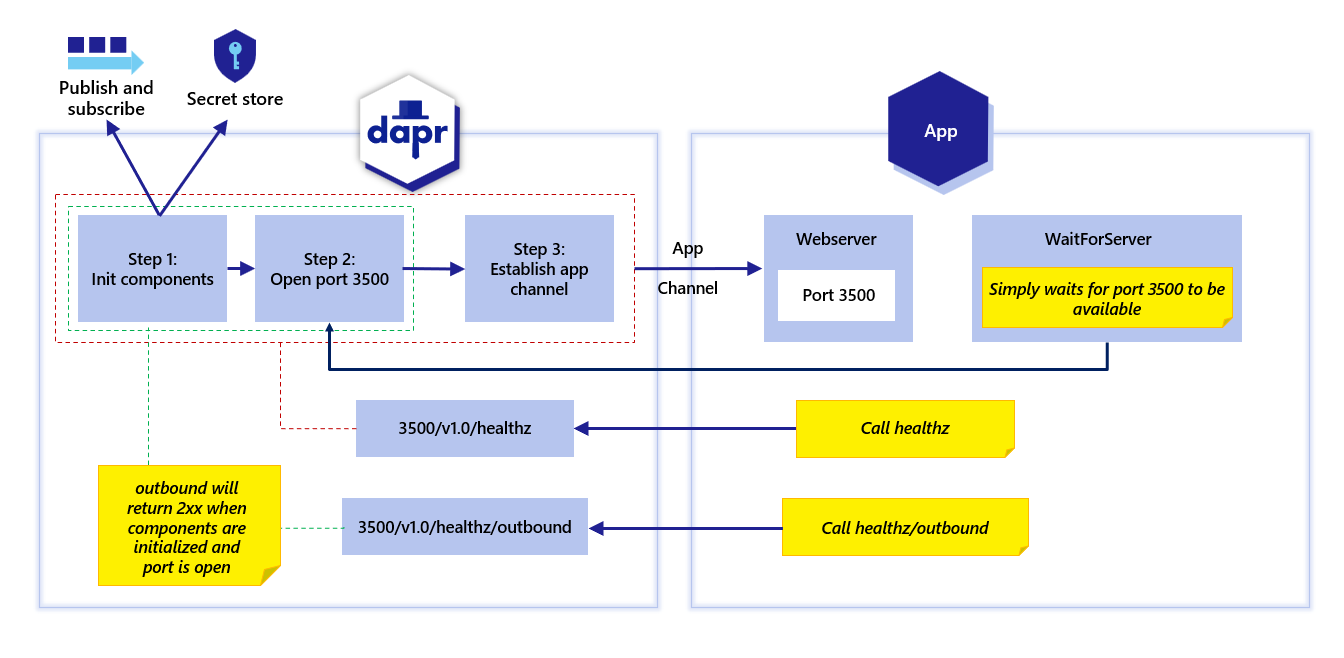
Outbound health endpoint
As shown by the red boundary lines in the diagram above, the v1.0/healthz/ endpoint is used to wait for when:
- All components are initialized;
- The Dapr HTTP port is available; and,
- The app channel is initialized.
This is used to check the complete initialization of the Dapr sidecar and its health.
Setting the DAPR_HEALTH_TIMEOUT environment variable lets you control the health timeout, which, for example, can be important in different environments with higher latency.
On the other hand, as shown by the green boundary lines in the diagram above, the v1.0/healthz/outbound endpoint returns successfully when:
- All the components are initialized;
- The Dapr HTTP port is available; but,
- The app channel is not yet established.
In the Dapr SDKs, the waitForSidecar/wait_until_ready method (depending on which SDK you use) is used for this specific check with the v1.0/healthz/outbound endpoint. Using this behavior, instead of waiting for the app channel to be available (see: red boundary lines) with the v1.0/healthz/ endpoint, Dapr waits for a successful response from v1.0/healthz/outbound. This approach enables your application to perform calls on the Dapr sidecar APIs before the app channel is initalized - for example, reading secrets with the secrets API.
If you are using the waitForSidecar/wait_until_ready method on the SDKs, then the correct initialization is performed. Otherwise, you can call the v1.0/healthz/outbound endpoint during initalization, and if successesful, you can call the Dapr sidecar APIs.
SDKs supporting outbound health endpoint
Currently, the v1.0/healthz/outbound endpoint is supported in the:
Health endpoint: Integration with Kubernetes
When deploying Dapr to a hosting platform like Kubernetes, the Dapr health endpoint is automatically configured for you.
Kubernetes uses readiness and liveness probes to determines the health of the container.
Liveness
The kubelet uses liveness probes to know when to restart a container. For example, liveness probes could catch a deadlock (a running application that is unable to make progress). Restarting a container in such a state can help to make the application more available despite having bugs.
How to configure a liveness probe in Kubernetes
In the pod configuration file, the liveness probe is added in the containers spec section as shown below:
livenessProbe:
httpGet:
path: /healthz
port: 8080
initialDelaySeconds: 3
periodSeconds: 3
In the above example, the periodSeconds field specifies that the kubelet should perform a liveness probe every 3 seconds. The initialDelaySeconds field tells the kubelet that it should wait 3 seconds before performing the first probe. To perform a probe, the kubelet sends an HTTP GET request to the server that is running in the container and listening on port 8080. If the handler for the server’s /healthz path returns a success code, the kubelet considers the container to be alive and healthy. If the handler returns a failure code, the kubelet kills the container and restarts it.
Any HTTP status code between 200 and 399 indicates success; any other status code indicates failure.
Readiness
The kubelet uses readiness probes to know when a container is ready to start accepting traffic. A pod is considered ready when all of its containers are ready. One use of this readiness signal is to control which pods are used as backends for Kubernetes services. When a pod is not ready, it is removed from Kubernetes service load balancers.
Note
The Dapr sidecar will be in ready state once the application is accessible on its configured port. The application cannot access the Dapr components during application start up/initialization.How to configure a readiness probe in Kubernetes
Readiness probes are configured similarly to liveness probes. The only difference is that you use the readinessProbe field instead of the livenessProbe field:
readinessProbe:
httpGet:
path: /healthz
port: 8080
initialDelaySeconds: 3
periodSeconds: 3
Sidecar Injector
When integrating with Kubernetes, the Dapr sidecar is injected with a Kubernetes probe configuration telling it to use the Dapr healthz endpoint. This is done by the “Sidecar Injector” system service. The integration with the kubelet is shown in the diagram below.
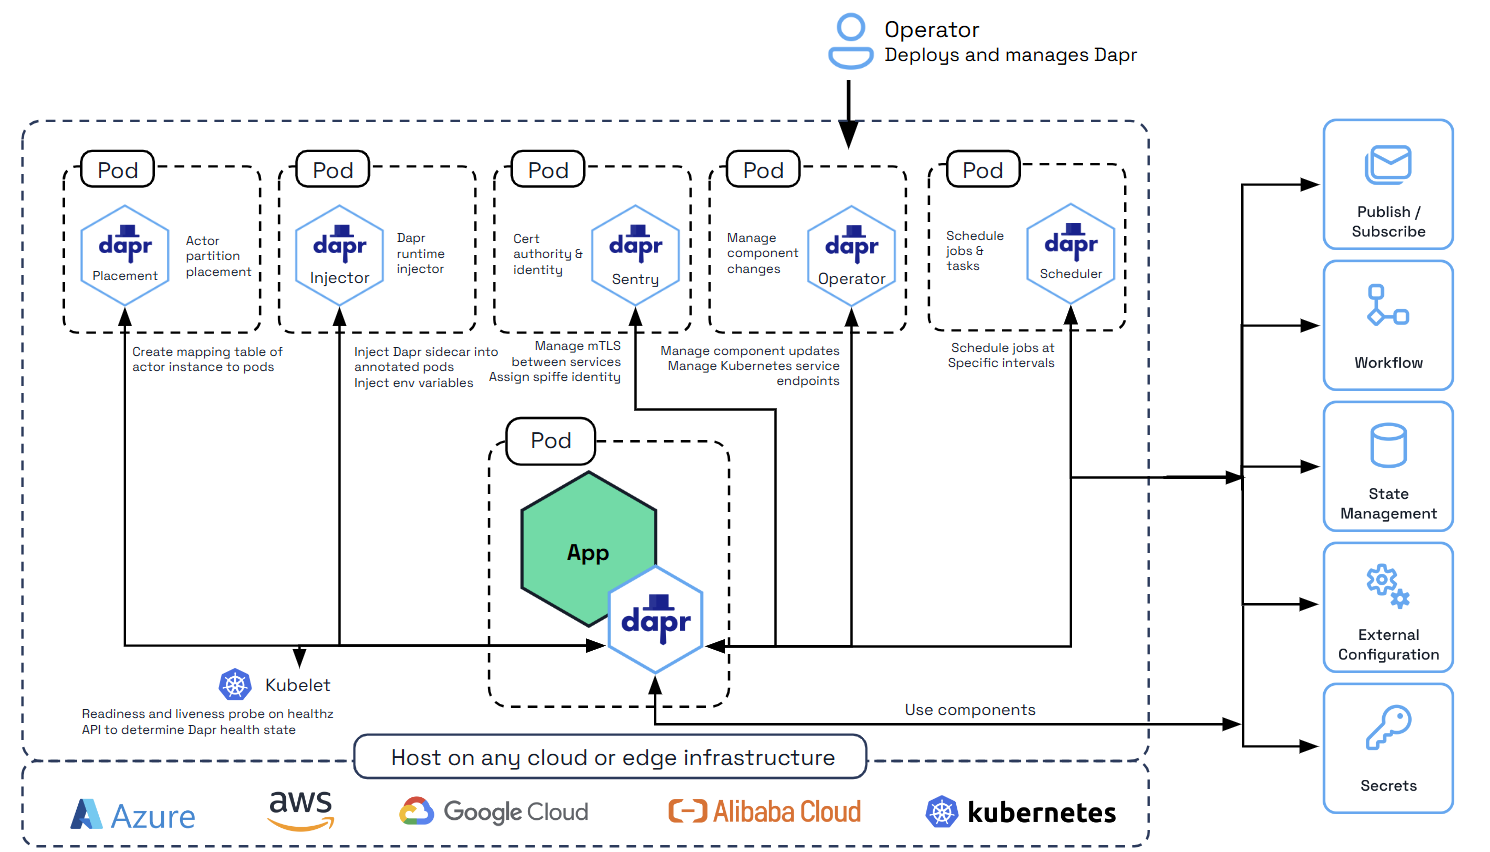
How the Dapr sidecar health endpoint is configured with Kubernetes
As mentioned above, this configuration is done automatically by the Sidecar Injector service. This section describes the specific values that are set on the liveness and readiness probes.
Dapr has its HTTP health endpoint /v1.0/healthz on port 3500. This can be used with Kubernetes for readiness and liveness probe. When the Dapr sidecar is injected, the readiness and liveness probes are configured in the pod configuration file with the following values:
livenessProbe:
httpGet:
path: v1.0/healthz
port: 3500
initialDelaySeconds: 5
periodSeconds: 10
timeoutSeconds : 5
failureThreshold : 3
readinessProbe:
httpGet:
path: v1.0/healthz
port: 3500
initialDelaySeconds: 5
periodSeconds: 10
timeoutSeconds : 5
failureThreshold: 3
Delay graceful shutdown
Dapr accepts a dapr.io/block-shutdown-duration annotation or --dapr-block-shutdown-duration CLI flag, which delays the full shutdown procedure for the specified duration, or until the app reports as unhealthy, whichever is sooner.
During this period, all subscriptions and input bindings are closed. This is useful for applications that need to use the Dapr APIs as part of their own shutdown procedure.
Applicable annotations or CLI flags include:
--dapr-graceful-shutdown-seconds/dapr.io/graceful-shutdown-seconds--dapr-block-shutdown-duration/dapr.io/block-shutdown-duration--dapr-graceful-shutdown-seconds/dapr.io/graceful-shutdown-seconds--dapr-block-shutdown-duration/dapr.io/block-shutdown-duration
Learn more about these and how to use them in the Annotations and arguments guide.
Related links
7 - Support and versioning
7.1 - Versioning policy
Introduction
Dapr is designed for future changes in the runtime, APIs and components with versioning schemes. This topic describes the versioning schemes and strategies for APIs, manifests such as components and Github repositories.
Versioning
Versioning is the process of assigning either unique version names or unique version numbers to unique states of computer software.
- Versioning provides compatibility, explicit change control and handling changes, in particular breaking changes.
- Dapr strives to be backwards compatible. If a breaking change is needed it’ll be announced in advance.
- Deprecated features are done over multiple releases with both new and deprecated features working side-by-side.
Versioning refers to the following Dapr repos: dapr, CLI, stable language SDKs, dashboard, components-contrib, quickstarts, helm-charts and documentation.
Dapr has the following versioning schemes:
- Dapr
HTTP APIversioned withMAJOR.MINOR - Dapr
GRPC APIwithMAJOR - Releases (GitHub repositories including dapr, CLI, SDKs and Helm Chart) with
MAJOR.MINOR.PATCH - Documentation and Quickstarts repositories are versioned with the Dapr runtime repository versioning.
- Dapr
ComponentswithMAJORin components-contrib GitHub repositories. - Dapr
ManifestswithMAJOR.MINOR. These include subscriptions and configurations.
Note that the Dapr APIs, binaries releases (runtime, CLI, SDKs) and components are all independent from one another.
Dapr HTTP API
The Dapr HTTP API is versioned according to these REST API guidelines.
Based to the these guidelines;
- A
MAJORversion of the API is incremented when a deprecation is expected of the older version. Any such deprecation will be communicated and an upgrade path made available. - A
MINORversions may be incremented for any other changes. For example a change to the JSON schema of the message sent to the API. The definition of a breaking change to the API can be viewed here. - Experimental APIs include an “alpha” suffix to denote for their alpha status. For example v1.0alpha, v2.0alpha, etc.
Dapr runtime
Dapr releases use MAJOR.MINOR.PATCH versioning. For example 1.0.0. Read Supported releases for more on the versioning of releases.
Helm Charts
Helm charts in the helm-charts repo are versioned with the Dapr runtime. The Helm charts are used in the Kubernetes deployment
Language SDKs, CLI and dashboard
The Dapr language SDKs, CLI and dashboard are versioned independently from the Dapr runtime and can be released at different schedules. See this table to show the compatibility between versions of the SDKs, CLI, dashboard and runtime. Each new release on the runtime lists the corresponding supported SDKs, CLI and Dashboard.
SDKs, CLIs and Dashboard are versioning follows a MAJOR.MINOR.PATCH format. A major version is incremented when there’s a non-backwards compatible change in an SDK (for example, changing a parameter on a client method. A minor version is updated for new features and bug fixes and the patch version is incremented in case of bug or security hot fixes.
Samples and examples in SDKs version with that repo.
Components
Components are implemented in the components-contrib repository and follow a MAJOR versioning scheme. The version for components adheres to major versions (vX), as patches and non-breaking changes are added to the latest major version. The version is incremented when there’s a non-backwards compatible change in a component interface, for example, changing an existing method in the State Store interface.
The components-contrib repo release is a flat version across all components inside. That is, a version for the components-contrib repo release is made up of all the schemas for the components inside it. A new version of Dapr does not mean there is a new release of components-contrib if there are no component changes.
Note: Components have a production usage lifecycle status: Alpha, Beta and Stable. These statuses are not related to their versioning. The tables of supported components shows both their versions and their status.
- List of state store components
- List of pub/sub components
- List of binding components
- List of secret store components
- List of configuration store components
- List of lock components
- List of crytpography components
- List of middleware components
For more information on component versioning read Version 2 and beyond of a component
Component schemas
Versioning for component YAMLs comes in two forms:
- Versioning for the component manifest. The
apiVersion - Version for the component implementation. The
.spec.version
A component manifest includes the schema for an implementation in the .spec.metadata field, with the .type field denoting the implementation
See the comments in the example below:
apiVersion: dapr.io/v1alpha1 # <-- This is the version of the component manifest
kind: Component
metadata:
name: pubsub
spec:
version: v1 # <-- This is the version of the pubsub.redis schema implementation
type: pubsub.redis
metadata:
- name: redisHost
value: redis-master:6379
- name: redisPassword
value: general-kenobi
Component manifest version
The Component YAML manifest is versioned with dapr.io/v1alpha1.
Component implementation version
The version for a component implementation is determined by the .spec.version field as can be seen in the example above. The .spec.version field is mandatory in a schema instance and the component fails to load if this is not present. For the release of Dapr 1.0.0 all components are marked as v1.The component implementation version is incremented only for non-backward compatible changes.
Component deprecations
Deprecations of components will be announced two (2) releases ahead. Deprecation of a component, results in major version update of the component version. After 2 releases, the component is unregistered from the Dapr runtime, and trying to load it will throw a fatal exception.
Component deprecations and removal are announced in the release notes.
Quickstarts and Samples
Quickstarts in the Quickstarts repo are versioned with the runtime, where a table of corresponding versions is on the front page of the samples repo. Users should only use Quickstarts corresponding to the version of the runtime being run.
Samples in the Samples repo are each versioned on a case by case basis depending on the sample maintainer. Samples that become very out of date with the runtime releases (many versions behind) or have not been maintained for more than 1 year will be removed.
Related links
- Read the Supported releases
- Read the Breaking Changes and Deprecation Policy
7.2 - Supported runtime and SDK releases
Introduction
This topic details the supported versions of Dapr releases, the upgrade policies and how deprecations and breaking changes are communicated in all Dapr repositories (runtime, CLI, SDKs, etc) at versions 1.x and above.
Dapr releases use MAJOR.MINOR.PATCH versioning. For example, 1.0.0.
| Versioning | Description |
|---|---|
MAJOR | Updated when there’s a non-backward compatible change to the runtime, such as an API change. A MAJOR release can also occur then there is a considered a significant addition/change of functionality that needs to differentiate from the previous version. |
MINOR | Updated as part of the regular release cadence, including new features, bug, and security fixes. |
PATCH | Incremented for a critical issue (P0) and security hot fixes. |
A supported release means:
- A hoxfix patch is released if the release has a critical issue such as a mainline broken scenario or a security issue. Each of these are reviewed on a case by case basis.
- Issues are investigated for the supported releases. If a release is no longer supported, you need to upgrade to a newer release and determine if the issue is still relevant.
From the 1.8.0 release onwards three (3) versions of Dapr are supported; the current and previous two (2) versions. Typically these are MINORrelease updates. This means that there is a rolling window that moves forward for supported releases and it is your operational responsibility to remain up to date with these supported versions. If you have an older version of Dapr you may have to do intermediate upgrades to get to a supported version.
There will be at least 13 weeks (3 months) between major.minor version releases giving users at least a 9 month rolling window for upgrading from a non-supported version. For more details on the release process read release cycle and cadence
Patch support is for supported versions (current and previous).
Build variations
The Dapr’s sidecar image is published to both GitHub Container Registry and Docker Registry. The default image contains all components. From version 1.11, Dapr also offers a variation of the sidecar image, containing only stable components.
- Default sidecar images:
daprio/daprd:<version>orghcr.io/dapr/daprd:<version>(for exampleghcr.io/dapr/daprd:1.11.1) - Sidecar images for stable components:
daprio/daprd:<version>-stablecomponentsorghcr.io/dapr/daprd:<version>-stablecomponents(for exampleghcr.io/dapr/daprd:1.11.1-stablecomponents)
On Kubernetes, the sidecar image can be overwritten for the application Deployment resource with the dapr.io/sidecar-image annotation. See more about Dapr’s arguments and annotations. The default ‘daprio/daprd:latest’ image is used if not specified.
Learn more about Dapr components’ certification lifecycle.
Supported versions
The table below shows the versions of Dapr releases that have been tested together and form a “packaged” release. Any other combinations of releases are not supported.
| Release date | Runtime | CLI | SDKs | Dashboard | Status | Release notes |
|---|---|---|---|---|---|---|
| May 5th 2025 | 1.15.5 | 1.15.0 | Java 1.14.1Go 1.12.0PHP 1.2.0Python 1.15.0.NET 1.15.4JS 3.5.2Rust 0.16.1 | 0.15.0 | Supported (current) | v1.15.5 release notes |
| April 4th 2025 | 1.15.4 | 1.15.0 | Java 1.14.0Go 1.12.0PHP 1.2.0Python 1.15.0.NET 1.15.4JS 3.5.2Rust 0.16.1 | 0.15.0 | Supported (current) | v1.15.4 release notes |
| March 5rd 2025 | 1.15.3 | 1.15.0 | Java 1.14.0Go 1.12.0PHP 1.2.0Python 1.15.0.NET 1.15.4JS 3.5.2Rust 0.16.1 | 0.15.0 | Supported (current) | v1.15.3 release notes |
| March 3rd 2025 | 1.15.2 | 1.15.0 | Java 1.14.0Go 1.12.0PHP 1.2.0Python 1.15.0.NET 1.15.0JS 3.5.0Rust 0.16 | 0.15.0 | Supported (current) | v1.15.2 release notes |
| February 28th 2025 | 1.15.1 | 1.15.0 | Java 1.14.0Go 1.12.0PHP 1.2.0Python 1.15.0.NET 1.15.0JS 3.5.0Rust 0.16 | 0.15.0 | Supported (current) | v1.15.1 release notes |
| February 27th 2025 | 1.15.0 | 1.15.0 | Java 1.14.0Go 1.12.0PHP 1.2.0Python 1.15.0.NET 1.15.0JS 3.5.0Rust 0.16 | 0.15.0 | Supported | v1.15.0 release notes |
| September 16th 2024 | 1.14.4 | 1.14.1 | Java 1.12.0Go 1.11.0PHP 1.2.0Python 1.14.0.NET 1.14.0JS 3.3.1 | 0.15.0 | Supported | v1.14.4 release notes |
| September 13th 2024 | 1.14.3 | 1.14.1 | Java 1.12.0Go 1.11.0PHP 1.2.0Python 1.14.0.NET 1.14.0JS 3.3.1 | 0.15.0 | ⚠️ Recalled | v1.14.3 release notes |
| September 6th 2024 | 1.14.2 | 1.14.1 | Java 1.12.0Go 1.11.0PHP 1.2.0Python 1.14.0.NET 1.14.0JS 3.3.1 | 0.15.0 | Supported | v1.14.2 release notes |
| August 14th 2024 | 1.14.1 | 1.14.1 | Java 1.12.0Go 1.11.0PHP 1.2.0Python 1.14.0.NET 1.14.0JS 3.3.1 | 0.15.0 | Supported | v1.14.1 release notes |
| August 14th 2024 | 1.14.0 | 1.14.0 | Java 1.12.0Go 1.11.0PHP 1.2.0Python 1.14.0.NET 1.14.0JS 3.3.1 | 0.15.0 | Supported | v1.14.0 release notes |
| May 29th 2024 | 1.13.4 | 1.13.0 | Java 1.11.0Go 1.10.0PHP 1.2.0Python 1.13.0.NET 1.13.0JS 3.3.0 | 0.14.0 | Supported | v1.13.4 release notes |
| May 21st 2024 | 1.13.3 | 1.13.0 | Java 1.11.0Go 1.10.0PHP 1.2.0Python 1.13.0.NET 1.13.0JS 3.3.0 | 0.14.0 | Supported | v1.13.3 release notes |
| April 3rd 2024 | 1.13.2 | 1.13.0 | Java 1.11.0Go 1.10.0PHP 1.2.0Python 1.13.0.NET 1.13.0JS 3.3.0 | 0.14.0 | Supported | v1.13.2 release notes |
| March 26th 2024 | 1.13.1 | 1.13.0 | Java 1.11.0Go 1.10.0PHP 1.2.0Python 1.13.0.NET 1.13.0JS 3.3.0 | 0.14.0 | Supported | v1.13.1 release notes |
| March 6th 2024 | 1.13.0 | 1.13.0 | Java 1.11.0Go 1.10.0PHP 1.2.0Python 1.13.0.NET 1.13.0JS 3.3.0 | 0.14.0 | Supported | v1.13.0 release notes |
| January 17th 2024 | 1.12.4 | 1.12.0 | Java 1.10.0Go 1.9.1PHP 1.2.0Python 1.12.0.NET 1.12.0JS 3.2.0 | 0.14.0 | Unsupported | v1.12.4 release notes |
| January 2nd 2024 | 1.12.3 | 1.12.0 | Java 1.10.0Go 1.9.1PHP 1.2.0Python 1.12.0.NET 1.12.0JS 3.2.0 | 0.14.0 | Unsupported | v1.12.3 release notes |
| November 18th 2023 | 1.12.2 | 1.12.0 | Java 1.10.0Go 1.9.1PHP 1.2.0Python 1.12.0.NET 1.12.0JS 3.2.0 | 0.14.0 | Unsupported | v1.12.2 release notes |
| November 16th 2023 | 1.12.1 | 1.12.0 | Java 1.10.0Go 1.9.1PHP 1.2.0Python 1.12.0.NET 1.12.0JS 3.2.0 | 0.14.0 | Unsupported | v1.12.1 release notes |
| October 11th 2023 | 1.12.0 | 1.12.0 | Java 1.10.0Go 1.9.0PHP 1.1.0Python 1.11.0.NET 1.12.0JS 3.1.2 | 0.14.0 | Unsupported | v1.12.0 release notes |
| November 18th 2023 | 1.11.6 | 1.11.0 | Java 1.9.0Go 1.8.0PHP 1.1.0Python 1.10.0.NET 1.11.0JS 3.1.0 | 0.13.0 | Unsupported | v1.11.6 release notes |
| November 3rd 2023 | 1.11.5 | 1.11.0 | Java 1.9.0Go 1.8.0PHP 1.1.0Python 1.10.0.NET 1.11.0JS 3.1.0 | 0.13.0 | Unsupported | v1.11.5 release notes |
| October 5th 2023 | 1.11.4 | 1.11.0 | Java 1.9.0Go 1.8.0PHP 1.1.0Python 1.10.0.NET 1.11.0JS 3.1.0 | 0.13.0 | Unsupported | v1.11.4 release notes |
| August 31st 2023 | 1.11.3 | 1.11.0 | Java 1.9.0Go 1.8.0PHP 1.1.0Python 1.10.0.NET 1.11.0JS 3.1.0 | 0.13.0 | Unsupported | v1.11.3 release notes |
| July 20th 2023 | 1.11.2 | 1.11.0 | Java 1.9.0Go 1.8.0PHP 1.1.0Python 1.10.0.NET 1.11.0JS 3.1.0 | 0.13.0 | Unsupported | v1.11.2 release notes |
| June 22nd 2023 | 1.11.1 | 1.11.0 | Java 1.9.0Go 1.8.0PHP 1.1.0Python 1.10.0.NET 1.11.0JS 3.1.0 | 0.13.0 | Unsupported | v1.11.1 release notes |
| June 12th 2023 | 1.11.0 | 1.11.0 | Java 1.9.0Go 1.8.0PHP 1.1.0Python 1.10.0.NET 1.11.0JS 3.1.0 | 0.13.0 | Unsupported | v1.11.0 release notes |
| November 18th 2023 | 1.10.10 | 1.10.0 | Java 1.8.0Go 1.7.0PHP 1.1.0Python 1.9.0.NET 1.10.0JS 3.0.0 | 0.11.0 | Unsupported | |
| July 20th 2023 | 1.10.9 | 1.10.0 | Java 1.8.0Go 1.7.0PHP 1.1.0Python 1.9.0.NET 1.10.0JS 3.0.0 | 0.11.0 | Unsupported | |
| June 22nd 2023 | 1.10.8 | 1.10.0 | Java 1.8.0Go 1.7.0PHP 1.1.0Python 1.9.0.NET 1.10.0JS 3.0.0 | 0.11.0 | Unsupported | |
| May 15th 2023 | 1.10.7 | 1.10.0 | Java 1.8.0Go 1.7.0PHP 1.1.0Python 1.9.0.NET 1.10.0JS 3.0.0 | 0.11.0 | Unsupported | |
| May 12th 2023 | 1.10.6 | 1.10.0 | Java 1.8.0Go 1.7.0PHP 1.1.0Python 1.9.0.NET 1.10.0JS 3.0.0 | 0.11.0 | Unsupported | |
| April 13 2023 | 1.10.5 | 1.10.0 | Java 1.8.0Go 1.6.0PHP 1.1.0Python 1.9.0.NET 1.10.0JS 3.0.0 | 0.11.0 | Unsupported | |
| March 16 2023 | 1.10.4 | 1.10.0 | Java 1.8.0Go 1.6.0PHP 1.1.0Python 1.9.0.NET 1.10.0JS 2.5.0 | 0.11.0 | Unsupported | |
| March 14 2023 | 1.10.3 | 1.10.0 | Java 1.8.0Go 1.6.0PHP 1.1.0Python 1.9.0.NET 1.10.0JS 2.5.0 | 0.11.0 | Unsupported | |
| February 24 2023 | 1.10.2 | 1.10.0 | Java 1.8.0Go 1.6.0PHP 1.1.0Python 1.9.0.NET 1.10.0JS 2.5.0 | 0.11.0 | Unsupported | |
| February 20 2023 | 1.10.1 | 1.10.0 | Java 1.8.0Go 1.6.0PHP 1.1.0Python 1.9.0.NET 1.10.0JS 2.5.0 | 0.11.0 | Unsupported | |
| February 14 2023 | 1.10.0 | 1.10.0 | Java 1.8.0Go 1.6.0PHP 1.1.0Python 1.9.0.NET 1.10.0JS 2.5.0 | 0.11.0 | Unsupported | |
| December 2nd 2022 | 1.9.5 | 1.9.1 | Java 1.7.0Go 1.6.0PHP 1.1.0Python 1.8.3.NET 1.9.0JS 2.4.2 | 0.11.0 | Unsupported | |
| November 17th 2022 | 1.9.4 | 1.9.1 | Java 1.7.0Go 1.6.0PHP 1.1.0Python 1.8.3.NET 1.9.0JS 2.4.2 | 0.11.0 | Unsupported | |
| November 4th 2022 | 1.9.3 | 1.9.1 | Java 1.7.0Go 1.6.0PHP 1.1.0Python 1.8.3.NET 1.9.0JS 2.4.2 | 0.11.0 | Unsupported | |
| November 1st 2022 | 1.9.2 | 1.9.1 | Java 1.7.0Go 1.6.0PHP 1.1.0Python 1.8.1.NET 1.9.0JS 2.4.2 | 0.11.0 | Unsupported | |
| October 26th 2022 | 1.9.1 | 1.9.1 | Java 1.7.0Go 1.6.0PHP 1.1.0Python 1.8.1.NET 1.9.0JS 2.4.2 | 0.11.0 | Unsupported | |
| October 13th 2022 | 1.9.0 | 1.9.1 | Java 1.7.0Go 1.6.0PHP 1.1.0Python 1.8.3.NET 1.9.0JS 2.4.2 | 0.11.0 | Unsupported | |
| October 26th 2022 | 1.8.6 | 1.8.1 | Java 1.6.0Go 1.5.0PHP 1.1.0Python 1.7.0.NET 1.8.0JS 2.3.0 | 0.11.0 | Unsupported | |
| October 13th 2022 | 1.8.5 | 1.8.1 | Java 1.6.0Go 1.5.0PHP 1.1.0Python 1.7.0.NET 1.8.0JS 2.3.0 | 0.11.0 | Unsupported | |
| August 10th 2022 | 1.8.4 | 1.8.1 | Java 1.6.0Go 1.5.0PHP 1.1.0Python 1.7.0.NET 1.8.0JS 2.3.0 | 0.11.0 | Unsupported | |
| July 29th 2022 | 1.8.3 | 1.8.0 | Java 1.6.0Go 1.5.0PHP 1.1.0Python 1.7.0.NET 1.8.0JS 2.3.0 | 0.11.0 | Unsupported | |
| July 21st 2022 | 1.8.2 | 1.8.0 | Java 1.6.0Go 1.5.0PHP 1.1.0Python 1.7.0.NET 1.8.0JS 2.3.0 | 0.11.0 | Unsupported | |
| July 20th 2022 | 1.8.1 | 1.8.0 | Java 1.6.0Go 1.5.0PHP 1.1.0Python 1.7.0.NET 1.8.0JS 2.3.0 | 0.11.0 | Unsupported | |
| July 7th 2022 | 1.8.0 | 1.8.0 | Java 1.6.0Go 1.5.0PHP 1.1.0Python 1.7.0.NET 1.8.0JS 2.3.0 | 0.11.0 | Unsupported | |
| October 26th 2022 | 1.7.5 | 1.7.0 | Java 1.5.0Go 1.4.0PHP 1.1.0Python 1.6.0.NET 1.7.0JS 2.2.1 | 0.10.0 | Unsupported | |
| May 31st 2022 | 1.7.4 | 1.7.0 | Java 1.5.0Go 1.4.0PHP 1.1.0Python 1.6.0.NET 1.7.0JS 2.2.1 | 0.10.0 | Unsupported | |
| May 17th 2022 | 1.7.3 | 1.7.0 | Java 1.5.0Go 1.4.0PHP 1.1.0Python 1.6.0.NET 1.7.0JS 2.2.1 | 0.10.0 | Unsupported | |
| Apr 22th 2022 | 1.7.2 | 1.7.0 | Java 1.5.0Go 1.4.0PHP 1.1.0Python 1.6.0.NET 1.7.0JS 2.1.0 | 0.10.0 | Unsupported | |
| Apr 20th 2022 | 1.7.1 | 1.7.0 | Java 1.5.0Go 1.4.0PHP 1.1.0Python 1.6.0.NET 1.7.0JS 2.1.0 | 0.10.0 | Unsupported | |
| Apr 7th 2022 | 1.7.0 | 1.7.0 | Java 1.5.0Go 1.4.0PHP 1.1.0Python 1.6.0.NET 1.7.0JS 2.1.0 | 0.10.0 | Unsupported | |
| Apr 20th 2022 | 1.6.2 | 1.6.0 | Java 1.4.0Go 1.3.1PHP 1.1.0Python 1.5.0.NET 1.6.0JS 2.0.0 | 0.9.0 | Unsupported | |
| Mar 25th 2022 | 1.6.1 | 1.6.0 | Java 1.4.0Go 1.3.1PHP 1.1.0Python 1.5.0.NET 1.6.0JS 2.0.0 | 0.9.0 | Unsupported | |
| Jan 25th 2022 | 1.6.0 | 1.6.0 | Java 1.4.0Go 1.3.1PHP 1.1.0Python 1.5.0.NET 1.6.0JS 2.0.0 | 0.9.0 | Unsupported |
SDK compatibility
The SDKs and runtime are committed to non-breaking changes other than those required for security issues. All breaking changes are announced if required in the release notes.
SDK and runtime forward compatibility
Newer Dapr SDKs support the latest version of Dapr runtime and two previous versions (N-2).
SDK and runtime backward compatibility
For a new Dapr runtime, the current SDK version and two previous versions (N-2) are supported.
Upgrade paths
After the 1.0 release of the runtime there may be situations where it is necessary to explicitly upgrade through an additional release to reach the desired target. For example, an upgrade from v1.0 to v1.2 may need to pass through v1.1.
Note
Dapr only has a seamless guarantee when upgrading patch versions in a single minor version, or upgrading from one minor version to the next. For example, upgrading fromv1.6.0 to v1.6.4 or v1.6.4 to v1.7.0 is guaranteed tested. Upgrading more than one minor version at a time is untested and treated as best effort.The table below shows the tested upgrade paths for the Dapr runtime. Any other combinations of upgrades have not been tested.
General guidance on upgrading can be found for self hosted mode and Kubernetes deployments. It is best to review the target version release notes for specific guidance.
| Current Runtime version | Must upgrade through | Target Runtime version |
|---|---|---|
| 1.5.0 to 1.5.2 | N/A | 1.6.0 |
| 1.6.0 | 1.6.2 | |
| 1.6.2 | 1.7.5 | |
| 1.7.5 | 1.8.6 | |
| 1.8.6 | 1.9.6 | |
| 1.9.6 | 1.10.7 | |
| 1.6.0 to 1.6.2 | N/A | 1.7.5 |
| 1.7.5 | 1.8.6 | |
| 1.8.6 | 1.9.6 | |
| 1.9.6 | 1.10.7 | |
| 1.7.0 to 1.7.5 | N/A | 1.8.6 |
| 1.8.6 | 1.9.6 | |
| 1.9.6 | 1.10.7 | |
| 1.8.0 to 1.8.6 | N/A | 1.9.6 |
| 1.9.0 to 1.9.6 | N/A | 1.10.8 |
| 1.10.0 to 1.10.8 | N/A | 1.11.4 |
| 1.11.0 to 1.11.4 | N/A | 1.12.4 |
| 1.12.0 to 1.12.4 | N/A | 1.13.5 |
| 1.13.0 to 1.13.5 | N/A | 1.14.0 |
| 1.14.0 to 1.14.4 | N/A | 1.14.4 |
| 1.15.0 | N/A | 1.15.0 |
Upgrade on Hosting platforms
Dapr can support multiple hosting platforms for production. With the 1.0 release the two supported platforms are Kubernetes and physical machines. For Kubernetes upgrades see Production guidelines on Kubernetes
Supported versions of dependencies
Below is a list of software that the latest version of Dapr (v1.15.5) has been tested against.
| Dependency | Supported Version |
|---|---|
| Kubernetes | Dapr support for Kubernetes is aligned with Kubernetes Version Skew Policy |
| Open Telemetry collector (OTEL) | v0.101.0 |
| Prometheus | v2.28 |
Related links
- Read the Versioning Policy
- Read the Breaking Changes and Deprecation Policy
7.3 - Breaking changes and deprecations
Breaking changes
Breaking changes are defined as a change to any of the following that cause compilation errors or undesirable runtime behavior to an existing 3rd party consumer application or script after upgrading to the next stable minor version of a Dapr artifact (SDK, CLI, runtime, etc):
- Code behavior
- Schema
- Default configuration value
- Command line argument
- Published metric
- Kubernetes resource template
- Publicly accessible API
- Publicly visible SDK interface, method, class, or attribute
Breaking changes can be applied right away to the following cases:
- Projects that have not reached version 1.0.0 yet
- Preview feature
- Alpha API
- Preview or Alpha interface, class, method or attribute in SDK
- Dapr Component in Alpha or Beta
- Interfaces for
github.com/dapr/components-contrib - URLs in Docs and Blog
- An exceptional case where it is required to fix a critical bug or security vulnerability.
Process for applying breaking changes
There is a process for applying breaking changes:
- A deprecation notice must be posted as part of a release.
- The breaking changes are applied two (2) releases after the release in which the deprecation was announced.
- For example, feature X is announced to be deprecated in the 1.0.0 release notes and will then be removed in 1.2.0.
Deprecations
Deprecations can apply to:
- APIs, including alpha APIs
- Preview features
- Components
- CLI
- Features that could result in security vulnerabilities
Deprecations appear in release notes under a section named “Deprecations”, which indicates:
- The point in the future the now-deprecated feature will no longer be supported. For example release x.y.z. This is at least two (2) releases prior.
- Document any steps the user must take to modify their code, operations, etc if applicable in the release notes.
After announcing a future breaking change, the change will happen in 2 releases or 6 months, whichever is greater. Deprecated features should respond with warning but do nothing otherwise.
Announced deprecations
| Feature | Deprecation announcement | Removal |
|---|---|---|
| GET /v1.0/shutdown API (Users should use POST API instead) | 1.2.0 | 1.4.0 |
| Java domain builder classes deprecated (Users should use setters instead) | Java SDK 1.3.0 | Java SDK 1.5.0 |
Service invocation will no longer provide a default content type header of application/json when no content-type is specified. You must explicitly set a content-type header for service invocation if your invoked apps rely on this header. | 1.7.0 | 1.9.0 |
gRPC service invocation using invoke method is deprecated. Use proxy mode service invocation instead. See How-To: Invoke services using gRPC to use the proxy mode. | 1.9.0 | 1.10.0 |
The CLI flag --app-ssl (in both the Dapr CLI and daprd) has been deprecated in favor of using --app-protocol with values https or grpcs. daprd:6158 cli:1267 | 1.11.0 | 1.13.0 |
| Hazelcast PubSub Component | 1.9.0 | 1.11.0 |
| Twitter Binding Component | 1.10.0 | 1.11.0 |
| NATS Streaming PubSub Component | 1.11.0 | 1.13.0 |
Workflows API Alpha1 /v1.0-alpha1/workflows being deprecated in favor of Workflow Client | 1.15.0 | 1.17.0 |
Related links
- Read the Versioning Policy
- Read the Supported Releases
7.4 - Reporting security issues
The Dapr project and maintainers make security a central focus of how we operate and design our software. From the Dapr binaries to the GitHub release processes, we take numerous steps to ensure user applications and data is secure. For more information on Dapr security features, visit the security page.
Repositories and issues covered
When we say “a security vulnerability in Dapr”, this means a security issue in any repository under the dapr GitHub organization.
This reporting process is intended only for security issues in the Dapr project itself, and doesn’t apply to applications using Dapr or to issues which do not affect security.
If the issue cannot be fixed by a change to one of the covered repositories above, then it’s recommended to create a GitHub issue in the appropriate repo or raise a question in Discord.
If you’re unsure, err on the side of caution and reach out using the reporting process before raising your issue through GitHub, Discord, or another channel.
Explicitly Not Covered: Vulnerability Scanner Reports
We do not accept reports which amount to copy and pasted output from a vulnerability scanning tool unless work has specifically been done to confirm that a vulnerability reported by the tool actually exists in Dapr, including the CLI, Dapr SDKs, the components-contrib repo, or any other repo under the Dapr org.
We make use of these tools ourselves and try to act on the output they produce. We tend to find, however, that when these reports are sent to our security mailing list they almost always represent false positives, since these tools tend to check for the presence of a library without considering how the library is used in context.
If we receive a report which seems to simply be a vulnerability list from a scanner, we reserve the right to ignore it.
This applies especially when tools produce vulnerability identifiers which are not publicly visible or which are proprietary in some way. We can look up CVEs or other publicly-available identifiers for further details, but cannot do the same for proprietary identifiers.
Security Contacts
The people who should have access to read your security report are listed in maintainers.md.
Reporting Process
- Describe the issue in English, ideally with some example configuration or code which allows the issue to be reproduced. Explain why you believe this to be a security issue in Dapr.
- Put that information into an email. Use a descriptive title.
- Send an email to Security (security@dapr.io)
Response
Response times could be affected by weekends, holidays, breaks or time zone differences. That said, the maintainers team endeavours to reply as soon as possible, ideally within 3 working days.
If the team concludes that the reported issue is indeed a security vulnerability in a Dapr project, at least two members of the maintainers team discuss the next steps together as soon as possible, ideally within 24 hours.
As soon as the team decides that the report is of a genuine vulnerability, one of the team responds to the reporter acknowledging the issue and establishing a disclosure timeline, which should be as soon as possible.
Triage, response, patching and announcement should all happen within 30 days.
7.5 - Preview features
Preview features in Dapr are considered experimental when they are first released.
Runtime preview features require explicit opt-in in order to be used. The runtime opt-in is specified in a preview setting feature in Dapr’s application configuration. See How-To: Enable preview features for more information.
For CLI there is no explicit opt-in, just the version that this was first made available.
Current preview features
| Feature | Description | Setting | Documentation | Version introduced |
|---|---|---|---|---|
| Pluggable components | Allows creating self-hosted gRPC-based components written in any language that supports gRPC. The following component APIs are supported: State stores, Pub/sub, Bindings | N/A | Pluggable components concept | v1.9 |
| Multi-App Run for Kubernetes | Configure multiple Dapr applications from a single configuration file and run from a single command on Kubernetes | dapr run -k -f | Multi-App Run | v1.12 |
| Cryptography | Encrypt or decrypt data without having to manage secrets keys | N/A | Cryptography concept | v1.11 |
| Actor State TTL | Allow actors to save records to state stores with Time To Live (TTL) set to automatically clean up old data. In its current implementation, actor state with TTL may not be reflected correctly by clients, read Actor State Transactions for more information. | ActorStateTTL | Actor State Transactions | v1.11 |
| Component Hot Reloading | Allows for Dapr-loaded components to be “hot reloaded”. A component spec is reloaded when it is created/updated/deleted in Kubernetes or on file when running in self-hosted mode. Ignores changes to actor state stores and workflow backends. | HotReload | Hot Reloading | v1.13 |
| Subscription Hot Reloading | Allows for declarative subscriptions to be “hot reloaded”. A subscription is reloaded either when it is created/updated/deleted in Kubernetes, or on file in self-hosted mode. In-flight messages are unaffected when reloading. | HotReload | Hot Reloading | v1.14 |
| Scheduler Actor Reminders | Scheduler actor reminders are actor reminders stored in the Scheduler control plane service, as opposed to the Placement control plane service actor reminder system. The SchedulerReminders preview feature defaults to true, but you can disable Scheduler actor reminders by setting it to false. | SchedulerReminders | Scheduler actor reminders | v1.14 |
7.6 - Alpha and Beta APIs
Alpha APIs
| Building block/API | gRPC | HTTP | Description | Documentation | Version introduced |
|---|---|---|---|---|---|
| Query State | Query State proto | v1.0-alpha1/state/statestore/query | The state query API enables you to retrieve, filter, and sort the key/value data stored in state store components. | Query State API | v1.5 |
| Distributed Lock | Lock proto | /v1.0-alpha1/lock | The distributed lock API enables you to take a lock on a resource. | Distributed Lock API | v1.8 |
| Bulk Publish | Bulk publish proto | v1.0-alpha1/publish/bulk | The bulk publish API allows you to publish multiple messages to a topic in a single request. | Bulk Publish and Subscribe API | v1.10 |
| Bulk Subscribe | Bulk subscribe proto | N/A | The bulk subscribe application callback receives multiple messages from a topic in a single call. | Bulk Publish and Subscribe API | v1.10 |
| Cryptography | Crypto proto | v1.0-alpha1/crypto | The cryptography API enables you to perform high level cryptography operations for encrypting and decrypting messages. | Cryptography API | v1.11 |
| Jobs | Jobs proto | v1.0-alpha1/jobs | The jobs API enables you to schedule and orchestrate jobs. | Jobs API | v1.14 |
| Conversation | Conversation proto | v1.0-alpha1/conversation | Converse between different large language models using the conversation API. | Conversation API | v1.15 |
Beta APIs
No current beta APIs.
Related links
Learn more about the Alpha, Beta, and Stable lifecycle stages.
8 - Performance and scalability statistics of Dapr
8.1 - Service invocation performance
This article provides service invocation API performance benchmarks and resource utilization for the components needed to run Dapr in different hosting environments.
System overview
Dapr consists of a data plane, the sidecar that runs next to your app, and a control plane that configures the sidecars and provides capabilities such as cert and identity management.
Self-hosted components
- Sidecar (data plane)
- Sentry (optional, control plane)
- Placement (optional, control plane)
For more information see overview of Dapr in self-hosted mode.
Kubernetes components
- Sidecar (data plane)
- Sentry (optional, control plane)
- Placement (optional, control planee)
- Operator (control plane)
- Sidecar Injector (control plane)
For more information see overview of Dapr on Kubernetes.
Performance summary for Dapr v1.0
The service invocation API is a reverse proxy with built-in service discovery to connect to other services. This includes tracing, metrics, mTLS for in-transit encryption of traffic, together with resiliency in the form of retries for network partitions and connection errors.
Using service invocation you can call from HTTP to HTTP, HTTP to gRPC, gRPC to HTTP, and gRPC to gRPC. Dapr does not use HTTP for the communication between sidecars, always using gRPC, while carrying over the semantics of the protocol used when called from the app. Service invocation is the underlying mechanism of communicating with Dapr Actors.
For more information see service invocation overview.
Kubernetes performance test setup
The test was conducted on a 3 node Kubernetes cluster, using commodity hardware running 4 cores and 8GB of RAM, without any network acceleration. The setup included a load tester (Fortio) pod with a Dapr sidecar injected into it that called the service invocation API to reach a pod on a different node.
Test parameters:
- 1000 requests per second
- Sidecar limited to 0.5 vCPU
- Sidecar mTLS enabled
- Sidecar telemetry enabled (tracing with a sampling rate of 0.1)
- Payload of 1KB
The baseline test included direct, non-encrypted traffic, without telemetry, directly from the load tester to the target app.
Control plane performance
The Dapr control plane uses a total of 0.009 vCPU and 61.6 Mb when running in non-HA mode, meaning a single replica per system component. When running in a highly available production setup, the Dapr control plane consumes ~0.02 vCPU and 185 Mb.
| Component | vCPU | Memory |
|---|---|---|
| Operator | 0.001 | 12.5 Mb |
| Sentry | 0.005 | 13.6 Mb |
| Sidecar Injector | 0.002 | 14.6 Mb |
| Placement | 0.001 | 20.9 Mb |
There are a number of variants that affect the CPU and memory consumption for each of the system components. These variants are shown in the table below.
| Component | vCPU | Memory |
|---|---|---|
| Operator | Number of pods requesting components, configurations and subscriptions | |
| Sentry | Number of certificate requests | |
| Sidecar Injector | Number of admission requests | |
| Placement | Number of actor rebalancing operations | Number of connected actor hosts |
Data plane performance
The Dapr sidecar uses 0.48 vCPU and 23Mb per 1000 requests per second. End-to-end, the Dapr sidecars (client and server) add ~1.40 ms to the 90th percentile latency, and ~2.10 ms to the 99th percentile latency. End-to-end here is a call from one app to another app receiving a response. This is shown by steps 1-7 in this diagram.
This performance is on par or better than commonly used service meshes.
Latency
In the test setup, requests went through the Dapr sidecar both on the client side (serving requests from the load tester tool) and the server side (the target app). mTLS and telemetry (tracing with a sampling rate of 0.1) and metrics were enabled on the Dapr test, and disabled for the baseline test.
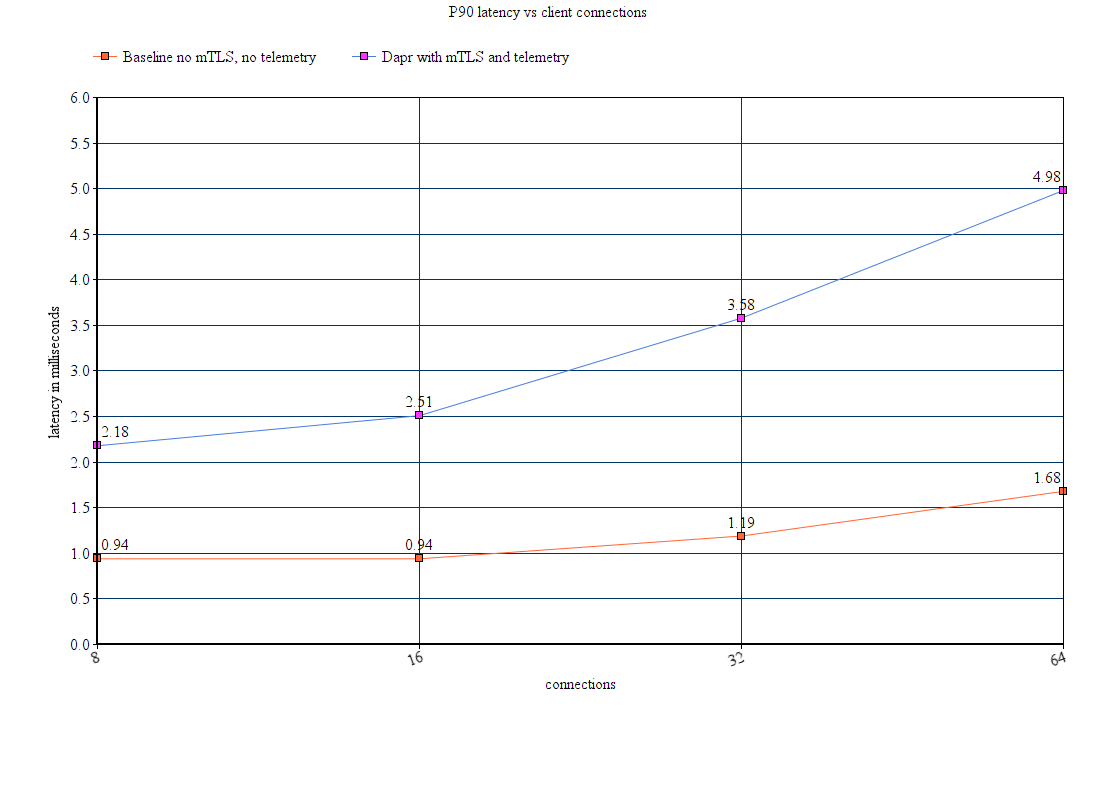
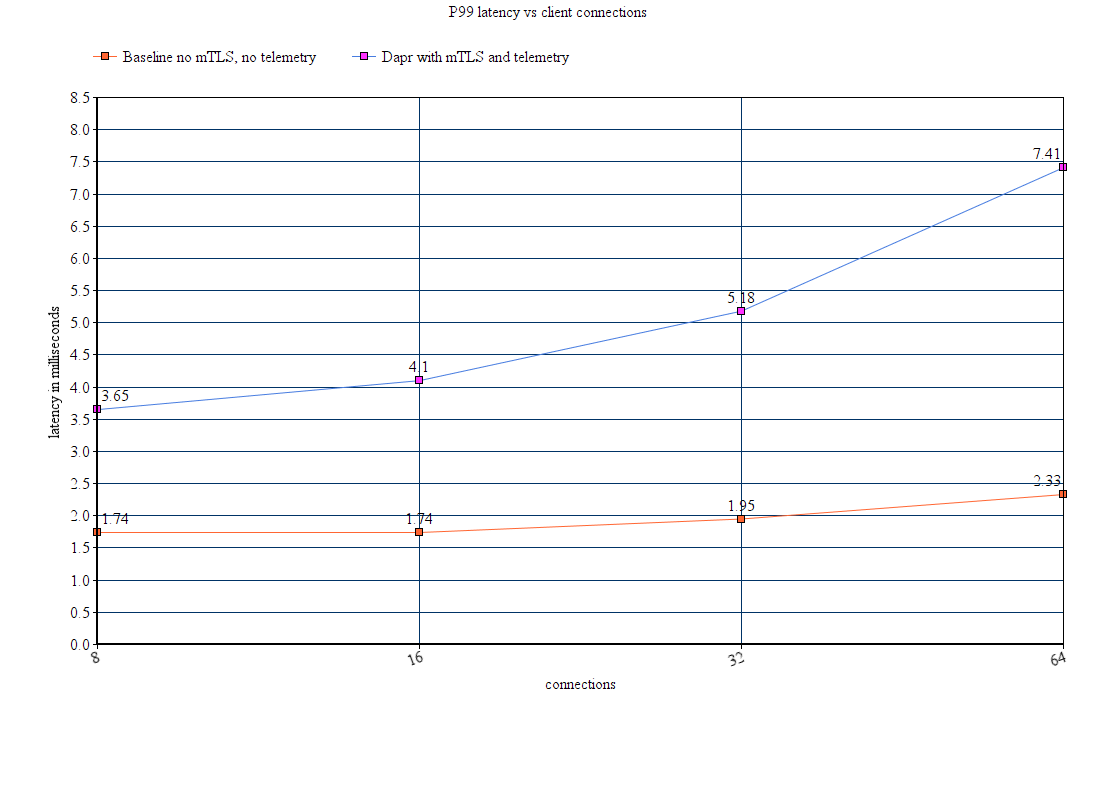
8.2 - Actors activation performance
This article provides service invocation API performance benchmarks and resource utilization for actors in Dapr on Kubernetes.
System overview
For applications using actors in Dapr there are two aspects to be considered. First, is the routing of actor invocations handled by Dapr sidecar. Second, is the actors runtime that is implemented and handled on the application side and depends on the SDK. For now, the performance tests are using the Java SDK to provide an actors runtime in the application.
Kubernetes components
- Sidecar (data plane)
- Placement (required for actors, control plane mapping actor types to hosts)
- Operator (control plane)
- Sidecar Injector (control plane)
- Sentry (optional, control plane)
Performance summary for Dapr v1.0
The actors API in Dapr sidecar will identify which hosts are registered for a given actor type and route the request to the appropriate host for a given actor ID. The host runs an instance of the application and uses the Dapr SDK (.Net, Java, Python or PHP) to handle actors requests via HTTP.
This test uses invokes actors via Dapr’s HTTP API directly.
For more information see actors overview.
Kubernetes performance test setup
The test was conducted on a 3 node Kubernetes cluster, using commodity hardware running 4 cores and 8GB of RAM, without any network acceleration. The setup included a load tester (Fortio) pod with a Dapr sidecar injected into it that called the service invocation API to reach a pod on a different node.
Test parameters:
- 500 requests per second
- 1 replica
- 1 minute duration
- Sidecar limited to 0.5 vCPU
- mTLS enabled
- Sidecar telemetry enabled (tracing with a sampling rate of 0.1)
- Payload of an empty JSON object:
{}
Results
- The actual throughput was ~500 qps.
- The tp90 latency was ~3ms.
- The tp99 latency was ~6.2ms.
- Dapr app consumed ~523m CPU and ~304.7Mb of Memory
- Dapr sidecar consumed 2m CPU and ~18.2Mb of Memory
- No app restarts
- No sidecar restarts
Related links
- For more information see overview of Dapr on Kubernetes
9 - Debugging and Troubleshooting
9.1 - Common issues when running Dapr
This guide covers common issues you may encounter while installing and running Dapr.
Dapr can’t connect to Docker when installing the Dapr CLI
When installing and initializing the Dapr CLI, if you see the following error message after running dapr init:
⌛ Making the jump to hyperspace...
❌ could not connect to docker. docker may not be installed or running
Troubleshoot the error by ensuring:
In Docker Desktop, verify the Allow the default Docker socket to be used (requires password) option is selected.
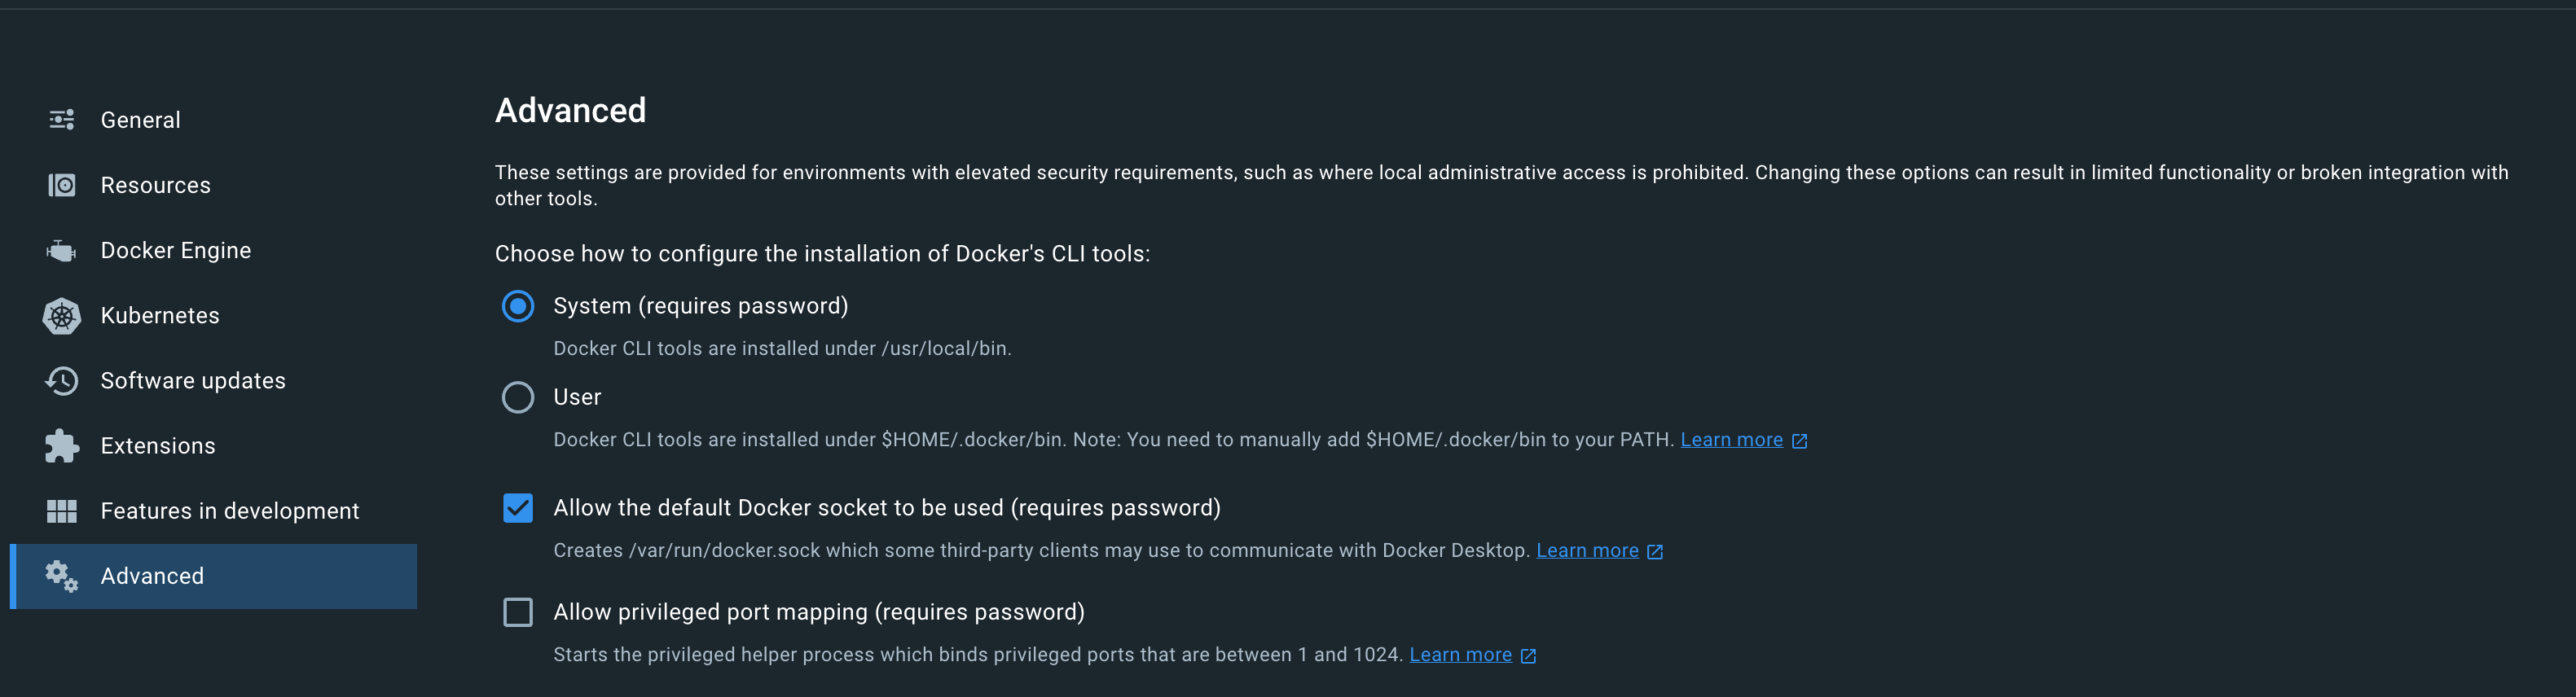
I don’t see the Dapr sidecar injected to my pod
There could be several reasons to why a sidecar will not be injected into a pod. First, check your deployment or pod YAML file, and check that you have the following annotations in the right place:
annotations:
dapr.io/enabled: "true"
dapr.io/app-id: "nodeapp"
dapr.io/app-port: "3000"
Sample deployment:
apiVersion: apps/v1
kind: Deployment
metadata:
name: nodeapp
namespace: default
labels:
app: node
spec:
replicas: 1
selector:
matchLabels:
app: node
template:
metadata:
labels:
app: node
annotations:
dapr.io/enabled: "true"
dapr.io/app-id: "nodeapp"
dapr.io/app-port: "3000"
spec:
containers:
- name: node
image: dapriosamples/hello-k8s-node
ports:
- containerPort: 3000
imagePullPolicy: Always
There are some known cases where this might not properly work:
If your pod spec template is annotated correctly, and you still don’t see the sidecar injected, make sure Dapr was deployed to the cluster before your deployment or pod were deployed.
If this is the case, restarting the pods will fix the issue.
If you are deploying Dapr on a private GKE cluster, sidecar injection does not work without extra steps. See Setup a Google Kubernetes Engine cluster.
In order to further diagnose any issue, check the logs of the Dapr sidecar injector:
kubectl logs -l app=dapr-sidecar-injector -n dapr-systemNote: If you installed Dapr to a different namespace, replace dapr-system above with the desired namespace
If you are deploying Dapr on Amazon EKS and using an overlay network such as Calico, you will need to set
hostNetworkparameter to true, this is a limitation of EKS with such CNIs.You can set this parameter using Helm
values.yamlfile:helm upgrade --install dapr dapr/dapr \ --namespace dapr-system \ --create-namespace \ --values values.yamlvalues.yamldapr_sidecar_injector: hostNetwork: trueor using command line:
helm upgrade --install dapr dapr/dapr \ --namespace dapr-system \ --create-namespace \ --set dapr_sidecar_injector.hostNetwork=trueMake sure the kube api server can reach the following webhooks services:
- Sidecar Mutating Webhook Injector Service at port 4000 that is served from the sidecar injector.
- Resource Conversion Webhook Service at port 19443 that is served from the operator.
Check with your cluster administrators to setup allow ingress rules to the above ports, 4000 and 19443, in the cluster from the kube api servers.
My pod is in CrashLoopBackoff or another failed state due to the daprd sidecar
If the Dapr sidecar (daprd) is taking too long to initialize, this might be surfaced as a failing health check by Kubernetes.
If your pod is in a failed state you should check this:
kubectl describe pod <name-of-pod>
You might see a table like the following at the end of the command output:
Normal Created 7m41s (x2 over 8m2s) kubelet, aks-agentpool-12499885-vmss000000 Created container daprd
Normal Started 7m41s (x2 over 8m2s) kubelet, aks-agentpool-12499885-vmss000000 Started container daprd
Warning Unhealthy 7m28s (x5 over 7m58s) kubelet, aks-agentpool-12499885-vmss000000 Readiness probe failed: Get http://10.244.1.10:3500/v1.0/healthz: dial tcp 10.244.1.10:3500: connect: connection refused
Warning Unhealthy 7m25s (x6 over 7m55s) kubelet, aks-agentpool-12499885-vmss000000 Liveness probe failed: Get http://10.244.1.10:3500/v1.0/healthz: dial tcp 10.244.1.10:3500: connect: connection refused
Normal Killing 7m25s (x2 over 7m43s) kubelet, aks-agentpool-12499885-vmss000000 Container daprd failed liveness probe, will be restarted
Warning BackOff 3m2s (x18 over 6m48s) kubelet, aks-agentpool-12499885-vmss000000 Back-off restarting failed container
The message Container daprd failed liveness probe, will be restarted indicates at the Dapr sidecar has failed its health checks and will be restarted. The messages Readiness probe failed: Get http://10.244.1.10:3500/v1.0/healthz: dial tcp 10.244.1.10:3500: connect: connection refused and Liveness probe failed: Get http://10.244.1.10:3500/v1.0/healthz: dial tcp 10.244.1.10:3500: connect: connection refused show that the health check failed because no connection could be made to the sidecar.
The most common cause of this failure is that a component (such as a state store) is misconfigured and is causing initialization to take too long. When initialization takes a long time, it’s possible that the health check could terminate the sidecar before anything useful is logged by the sidecar.
To diagnose the root cause:
- Significantly increase the liveness probe delay - link
- Set the log level of the sidecar to debug - link
- Watch the logs for meaningful information - link
Remember to configure the liveness check delay and log level back to your desired values after solving the problem.
I am unable to save state or get state
Have you installed an Dapr State store in your cluster?
To check, use kubectl get a list of components:
kubectl get components
If there isn’t a state store component, it means you need to set one up. Visit here for more details.
If everything’s set up correctly, make sure you got the credentials right. Search the Dapr runtime logs and look for any state store errors:
kubectl logs <name-of-pod> daprd
I am unable to publish and receive events
Have you installed an Dapr Message Bus in your cluster?
To check, use kubectl get a list of components:
kubectl get components
If there isn’t a pub/sub component, it means you need to set one up. Visit here for more details.
If everything is set up correctly, make sure you got the credentials right. Search the Dapr runtime logs and look for any pub/sub errors:
kubectl logs <name-of-pod> daprd
I’m getting 500 Error responses when calling Dapr
This means there are some internal issue inside the Dapr runtime. To diagnose, view the logs of the sidecar:
kubectl logs <name-of-pod> daprd
I’m getting 404 Not Found responses when calling Dapr
This means you’re trying to call an Dapr API endpoint that either doesn’t exist or the URL is malformed. Look at the Dapr API reference here and make sure you’re calling the right endpoint.
I don’t see any incoming events or calls from other services
Have you specified the port your app is listening on?
In Kubernetes, make sure the dapr.io/app-port annotation is specified:
annotations:
dapr.io/enabled: "true"
dapr.io/app-id: "nodeapp"
dapr.io/app-port: "3000"
If using Dapr Standalone and the Dapr CLI, make sure you pass the --app-port flag to the dapr run command.
My Dapr-enabled app isn’t behaving correctly
The first thing to do is inspect the HTTP error code returned from the Dapr API, if any.
If you still can’t find the issue, try enabling debug log levels for the Dapr runtime. See here how to do so.
You might also want to look at error logs from your own process. If running on Kubernetes, find the pod containing your app, and execute the following:
kubectl logs <pod-name> <name-of-your-container>
If running in Standalone mode, you should see the stderr and stdout outputs from your app displayed in the main console session.
I’m getting timeout/connection errors when running Actors locally
Each Dapr instance reports it’s host address to the placement service. The placement service then distributes a table of nodes and their addresses to all Dapr instances. If that host address is unreachable, you are likely to encounter socket timeout errors or other variants of failing request errors.
Unless the host name has been specified by setting an environment variable named DAPR_HOST_IP to a reachable, pingable address, Dapr will loop over the network interfaces and select the first non-loopback address it finds.
As described above, in order to tell Dapr what the host name should be used, simply set an environment variable with the name of DAPR_HOST_IP.
The following example shows how to set the Host IP env var to 127.0.0.1:
Note: for versions <= 0.4.0 use HOST_IP
export DAPR_HOST_IP=127.0.0.1
None of my components are getting loaded when my application starts. I keep getting “Error component X cannot be found”
This is usually due to one of the following issues
- You may have defined the
NAMESPACEenvironment variable locally or deployed your components into a different namespace in Kubernetes. Check which namespace your app and the components are deployed to. Read scoping components to one or more applications for more information. - You may have not provided a
--resources-pathwith the Daprruncommands or not placed your components into the default components folder for your OS. Read define a component for more information. - You may have a syntax issue in component YAML file. Check your component YAML with the component YAML samples.
Service invocation is failing and my Dapr service is missing an appId (macOS)
Some organizations will implement software that filters out all UDP traffic, which is what mDNS is based on. Mostly commonly, on MacOS, Microsoft Content Filter is the culprit.
In order for mDNS to function properly, ensure Microsoft Content Filter is inactive.
- Open a terminal shell.
- Type
mdatp system-extension network-filter disableand hit enter. - Enter your account password.
Microsoft Content Filter is disabled when the output is “Success”.
Some organizations will re-enable the filter from time to time. If you repeatedly encounter app-id values missing, first check to see if the filter has been re-enabled before doing more extensive troubleshooting.
Admission webhook denied the request
You may encounter an error similar to the one below due to admission webhook having an allowlist for service accounts to create or modify resources.
root:[dapr]$ kubectl run -i --tty --rm debug --image=busybox --restart=Never -- sh
Error from server: admission webhook "sidecar-injector.dapr.io" denied the request: service account 'user-xdd5l' not on the list of allowed controller accounts
To resolve this error, you should create a clusterrolebind for the current user:
kubectl create clusterrolebinding dapr-<name-of-user> --clusterrole=dapr-operator-admin --user <name-of-user>
You can run the below command to get all users in your cluster:
kubectl config get-users
You may learn more about webhooks here.
Ports not available during dapr init
You might encounter the following error on Windows after attempting to execute dapr init:
PS C:\Users\You> dapr init Making the jump to hyperspace… Container images will be pulled from Docker Hub Installing runtime version 1.14.4 Downloading binaries and setting up components… docker: Error response from daemon: Ports are not available: exposing port TCP 0.0.0.0:52379 -> 0.0.0.0:0: listen tcp4 0.0.0.0:52379: bind: An attempt was made to access a socket in a way forbidden by its access permissions.
To resolve this error, open a command prompt in an elevated terminal and run:
nat stop winnat
dapr init
net start winnat
9.2 - Configure and view Dapr Logs
This section will assist you in understanding how logging works in Dapr, configuring and viewing logs.
Overview
Logs have different, configurable verbosity levels. The levels outlined below are the same for both system components and the Dapr sidecar process/container:
- error
- warn
- info
- debug
error produces the minimum amount of output, where debug produces the maximum amount. The default level is info, which provides a balanced amount of information for operating Dapr in normal conditions.
To set the output level, you can use the --log-level command-line option. For example:
./daprd --log-level error
./placement --log-level debug
This will start the Dapr runtime binary with a log level of error and the Dapr Actor Placement Service with a log level of debug.
Logs in stand-alone mode
To set the log level when running your app with the Dapr CLI, pass the log-level param:
dapr run --log-level warn node myapp.js
As outlined above, every Dapr binary takes a --log-level argument. For example, to launch the placement service with a log level of warning:
./placement --log-level warn
Viewing Logs on Standalone Mode
When running Dapr with the Dapr CLI, both your app’s log output and the runtime’s output will be redirected to the same session, for easy debugging. For example, this is the output when running Dapr:
dapr run node myapp.js
ℹ️ Starting Dapr with id Trackgreat-Lancer on port 56730
✅ You are up and running! Both Dapr and your app logs will appear here.
== APP == App listening on port 3000!
== DAPR == time="2019-09-05T12:26:43-07:00" level=info msg="starting Dapr Runtime -- version 0.3.0-alpha -- commit b6f2810-dirty"
== DAPR == time="2019-09-05T12:26:43-07:00" level=info msg="log level set to: info"
== DAPR == time="2019-09-05T12:26:43-07:00" level=info msg="standalone mode configured"
== DAPR == time="2019-09-05T12:26:43-07:00" level=info msg="app id: Trackgreat-Lancer"
== DAPR == time="2019-09-05T12:26:43-07:00" level=info msg="loaded component statestore (state.redis)"
== DAPR == time="2019-09-05T12:26:43-07:00" level=info msg="loaded component messagebus (pubsub.redis)"
== DAPR == 2019/09/05 12:26:43 redis: connecting to localhost:6379
== DAPR == 2019/09/05 12:26:43 redis: connected to localhost:6379 (localAddr: [::1]:56734, remAddr: [::1]:6379)
== DAPR == time="2019-09-05T12:26:43-07:00" level=warn msg="failed to init input bindings: app channel not initialized"
== DAPR == time="2019-09-05T12:26:43-07:00" level=info msg="actor runtime started. actor idle timeout: 1h0m0s. actor scan interval: 30s"
== DAPR == time="2019-09-05T12:26:43-07:00" level=info msg="actors: starting connection attempt to placement service at localhost:50005"
== DAPR == time="2019-09-05T12:26:43-07:00" level=info msg="http server is running on port 56730"
== DAPR == time="2019-09-05T12:26:43-07:00" level=info msg="gRPC server is running on port 56731"
== DAPR == time="2019-09-05T12:26:43-07:00" level=info msg="dapr initialized. Status: Running. Init Elapsed 8.772922000000001ms"
== DAPR == time="2019-09-05T12:26:43-07:00" level=info msg="actors: established connection to placement service at localhost:50005"
Logs in Kubernetes mode
You can set the log level individually for every sidecar by providing the following annotation in your pod spec template:
annotations:
dapr.io/log-level: "debug"
Setting system pods log level
When deploying Dapr to your cluster using Helm 3.x, you can individually set the log level for every Dapr system component:
helm install dapr dapr/dapr --namespace dapr-system --set <COMPONENT>.logLevel=<LEVEL>
Components:
- dapr_operator
- dapr_placement
- dapr_sidecar_injector
Example:
helm install dapr dapr/dapr --namespace dapr-system --set dapr_operator.logLevel=error
Viewing Logs on Kubernetes
Dapr logs are written to stdout and stderr. This section will guide you on how to view logs for Dapr system components as well as the Dapr sidecar.
Sidecar Logs
When deployed in Kubernetes, the Dapr sidecar injector will inject a Dapr container named daprd into your annotated pod.
In order to view logs for the sidecar, simply find the pod in question by running kubectl get pods:
NAME READY STATUS RESTARTS AGE
addapp-74b57fb78c-67zm6 2/2 Running 0 40h
Next, get the logs for the Dapr sidecar container:
kubectl logs addapp-74b57fb78c-67zm6 -c daprd
time="2019-09-04T02:52:27Z" level=info msg="starting Dapr Runtime -- version 0.3.0-alpha -- commit b6f2810-dirty"
time="2019-09-04T02:52:27Z" level=info msg="log level set to: info"
time="2019-09-04T02:52:27Z" level=info msg="kubernetes mode configured"
time="2019-09-04T02:52:27Z" level=info msg="app id: addapp"
time="2019-09-04T02:52:27Z" level=info msg="application protocol: http. waiting on port 6000"
time="2019-09-04T02:52:27Z" level=info msg="application discovered on port 6000"
time="2019-09-04T02:52:27Z" level=info msg="actor runtime started. actor idle timeout: 1h0m0s. actor scan interval: 30s"
time="2019-09-04T02:52:27Z" level=info msg="actors: starting connection attempt to placement service at dapr-placement.dapr-system.svc.cluster.local:80"
time="2019-09-04T02:52:27Z" level=info msg="http server is running on port 3500"
time="2019-09-04T02:52:27Z" level=info msg="gRPC server is running on port 50001"
time="2019-09-04T02:52:27Z" level=info msg="dapr initialized. Status: Running. Init Elapsed 64.234049ms"
time="2019-09-04T02:52:27Z" level=info msg="actors: established connection to placement service at dapr-placement.dapr-system.svc.cluster.local:80"
System Logs
Dapr runs the following system pods:
- Dapr operator
- Dapr sidecar injector
- Dapr placement service
Operator Logs
kubectl logs -l app=dapr-operator -n dapr-system
I1207 06:01:02.891031 1 leaderelection.go:243] attempting to acquire leader lease dapr-system/operator.dapr.io...
I1207 06:01:02.913696 1 leaderelection.go:253] successfully acquired lease dapr-system/operator.dapr.io
time="2021-12-07T06:01:03.092529085Z" level=info msg="getting tls certificates" instance=dapr-operator-84bb47f895-dvbsj scope=dapr.operator type=log ver=unknown
time="2021-12-07T06:01:03.092703283Z" level=info msg="tls certificates loaded successfully" instance=dapr-operator-84bb47f895-dvbsj scope=dapr.operator type=log ver=unknown
time="2021-12-07T06:01:03.093062379Z" level=info msg="starting gRPC server" instance=dapr-operator-84bb47f895-dvbsj scope=dapr.operator.api type=log ver=unknown
time="2021-12-07T06:01:03.093123778Z" level=info msg="Healthz server is listening on :8080" instance=dapr-operator-84bb47f895-dvbsj scope=dapr.operator type=log ver=unknown
time="2021-12-07T06:01:03.497889776Z" level=info msg="starting webhooks" instance=dapr-operator-84bb47f895-dvbsj scope=dapr.operator type=log ver=unknown
I1207 06:01:03.497944 1 leaderelection.go:243] attempting to acquire leader lease dapr-system/webhooks.dapr.io...
I1207 06:01:03.516641 1 leaderelection.go:253] successfully acquired lease dapr-system/webhooks.dapr.io
time="2021-12-07T06:01:03.526202227Z" level=info msg="Successfully patched webhook in CRD "subscriptions.dapr.io"" instance=dapr-operator-84bb47f895-dvbsj scope=dapr.operator type=log ver=unknown
Note: If Dapr is installed to a different namespace than dapr-system, simply replace the namespace to the desired one in the command above
Sidecar Injector Logs
kubectl logs -l app=dapr-sidecar-injector -n dapr-system
time="2021-12-07T06:01:01.554859058Z" level=info msg="log level set to: info" instance=dapr-sidecar-injector-5d88fcfcf5-2gmvv scope=dapr.injector type=log ver=unknown
time="2021-12-07T06:01:01.555114755Z" level=info msg="metrics server started on :9090/" instance=dapr-sidecar-injector-5d88fcfcf5-2gmvv scope=dapr.metrics type=log ver=unknown
time="2021-12-07T06:01:01.555233253Z" level=info msg="starting Dapr Sidecar Injector -- version 1.5.1 -- commit c6daae8e9b11b3e241a9cb84c33e5aa740d74368" instance=dapr-sidecar-injector-5d88fcfcf5-2gmvv scope=dapr.injector type=log ver=unknown
time="2021-12-07T06:01:01.557646524Z" level=info msg="Healthz server is listening on :8080" instance=dapr-sidecar-injector-5d88fcfcf5-2gmvv scope=dapr.injector type=log ver=unknown
time="2021-12-07T06:01:01.621291968Z" level=info msg="Sidecar injector is listening on :4000, patching Dapr-enabled pods" instance=dapr-sidecar-injector-5d88fcfcf5-2gmvv scope=dapr.injector type=log ver=unknown
Note: If Dapr is installed to a different namespace than dapr-system, simply replace the namespace to the desired one in the command above
Viewing Placement Service Logs
kubectl logs -l app=dapr-placement-server -n dapr-system
time="2021-12-04T05:08:05.733416791Z" level=info msg="starting Dapr Placement Service -- version 1.5.0 -- commit 83fe579f5dc93bef1ce3b464d3167a225a3aff3a" instance=dapr-placement-server-0 scope=dapr.placement type=log ver=unknown
time="2021-12-04T05:08:05.733469491Z" level=info msg="log level set to: info" instance=dapr-placement-server-0 scope=dapr.placement type=log ver=1.5.0
time="2021-12-04T05:08:05.733512692Z" level=info msg="metrics server started on :9090/" instance=dapr-placement-server-0 scope=dapr.metrics type=log ver=1.5.0
time="2021-12-04T05:08:05.735207095Z" level=info msg="Raft server is starting on 127.0.0.1:8201..." instance=dapr-placement-server-0 scope=dapr.placement.raft type=log ver=1.5.0
time="2021-12-04T05:08:05.735221195Z" level=info msg="mTLS enabled, getting tls certificates" instance=dapr-placement-server-0 scope=dapr.placement type=log ver=1.5.0
time="2021-12-04T05:08:05.735265696Z" level=info msg="tls certificates loaded successfully" instance=dapr-placement-server-0 scope=dapr.placement type=log ver=1.5.0
time="2021-12-04T05:08:05.735276396Z" level=info msg="placement service started on port 50005" instance=dapr-placement-server-0 scope=dapr.placement type=log ver=1.5.0
time="2021-12-04T05:08:05.735553696Z" level=info msg="Healthz server is listening on :8080" instance=dapr-placement-server-0 scope=dapr.placement type=log ver=1.5.0
time="2021-12-04T05:08:07.036850257Z" level=info msg="cluster leadership acquired" instance=dapr-placement-server-0 scope=dapr.placement type=log ver=1.5.0
time="2021-12-04T05:08:07.036909357Z" level=info msg="leader is established." instance=dapr-placement-server-0 scope=dapr.placement type=log ver=1.5.0
Note: If Dapr is installed to a different namespace than dapr-system, simply replace the namespace to the desired one in the command above
Non Kubernetes Environments
The examples above are specific specific to Kubernetes, but the principal is the same for any kind of container based environment: simply grab the container ID of the Dapr sidecar and/or system component (if applicable) and view its logs.
References
9.3 - Dapr API Logs
API logging enables you to see the API calls your application makes to the Dapr sidecar. This is useful to monitor your application’s behavior or for other debugging purposes. You can also combine Dapr API logging with Dapr log events (see configure and view Dapr Logs into the output if you want to use the logging capabilities together.
Overview
API logging is disabled by default.
To enable API logging, you can use the --enable-api-logging command-line option when starting the daprd process. For example:
./daprd --enable-api-logging
Configuring API logging in self-hosted mode
To enable API logging when running your app with the Dapr CLI, pass the --enable-api-logging flag:
dapr run \
--enable-api-logging \
-- node myapp.js
Viewing API logs in self-hosted mode
When running Dapr with the Dapr CLI, both your app’s log output and the Dapr runtime log output are redirected to the same session, for easy debugging.
The example below shows some API logs:
$ dapr run --enable-api-logging -- node myapp.js
ℹ️ Starting Dapr with id order-processor on port 56730
✅ You are up and running! Both Dapr and your app logs will appear here.
.....
INFO[0000] HTTP API Called app_id=order-processor instance=mypc method="POST /v1.0/state/mystate" scope=dapr.runtime.http-info type=log useragent=Go-http-client/1.1 ver=edge
== APP == INFO:root:Saving Order: {'orderId': '483'}
INFO[0000] HTTP API Called app_id=order-processor instance=mypc method="GET /v1.0/state/mystate/key123" scope=dapr.runtime.http-info type=log useragent=Go-http-client/1.1 ver=edge
== APP == INFO:root:Getting Order: {'orderId': '483'}
INFO[0000] HTTP API Called app_id=order-processor instance=mypc method="DELETE /v1.0/state/mystate" scope=dapr.runtime.http-info type=log useragent=Go-http-client/1.1 ver=edge
== APP == INFO:root:Deleted Order: {'orderId': '483'}
INFO[0000] HTTP API Called app_id=order-processor instance=mypc method="PUT /v1.0/metadata/cliPID" scope=dapr.runtime.http-info type=log useragent=Go-http-client/1.1 ver=edge
Configuring API logging in Kubernetes
You can enable the API logs for a sidecar by adding the following annotation in your pod spec template:
annotations:
dapr.io/enable-api-logging: "true"
Viewing API logs on Kubernetes
Dapr API logs are written to stdout and stderr and you can view API logs on Kubernetes.
See the kubernetes API logs by executing the below command.
kubectl logs <pod_name> daprd -n <name_space>
The example below show info level API logging in Kubernetes (with URL obfuscation enabled).
time="2022-03-16T18:32:02.487041454Z" level=info msg="HTTP API Called" method="POST /v1.0/invoke/{id}/method/{method:*}" app_id=invoke-caller instance=invokecaller-f4f949886-cbnmt scope=dapr.runtime.http-info type=log useragent=Go-http-client/1.1 ver=edge
time="2022-03-16T18:32:02.698387866Z" level=info msg="HTTP API Called" method="POST /v1.0/invoke/{id}/method/{method:*}" app_id=invoke-caller instance=invokecaller-f4f949886-cbnmt scope=dapr.runtime.http-info type=log useragent=Go-http-client/1.1 ver=edge
time="2022-03-16T18:32:02.917629403Z" level=info msg="HTTP API Called" method="POST /v1.0/invoke/{id}/method/{method:*}" app_id=invoke-caller instance=invokecaller-f4f949886-cbnmt scope=dapr.runtime.http-info type=log useragent=Go-http-client/1.1 ver=edge
time="2022-03-16T18:32:03.137830112Z" level=info msg="HTTP API Called" method="POST /v1.0/invoke/{id}/method/{method:*}" app_id=invoke-caller instance=invokecaller-f4f949886-cbnmt scope=dapr.runtime.http-info type=log useragent=Go-http-client/1.1 ver=edge
time="2022-03-16T18:32:03.359097916Z" level=info msg="HTTP API Called" method="POST /v1.0/invoke/{id}/method/{method:*}" app_id=invoke-caller instance=invokecaller-f4f949886-cbnmt scope=dapr.runtime.http-info type=log useragent=Go-http-client/1.1 ver=edge
API logging configuration
Using the Dapr Configuration spec, you can configure the default behavior of API logging in Dapr runtimes.
Enable API logging by default
Using the Dapr Configuration spec, you can set the default value for the --enable-api-logging flag (and the correspondent annotation when running on Kubernetes), with the logging.apiLogging.enabled option. This value applies to all Dapr runtimes that reference the Configuration document or resource in which it’s defined.
- If
logging.apiLogging.enabledis set tofalse, the default value, API logging is disabled for Dapr runtimes unless--enable-api-loggingis set totrue(or thedapr.io/enable-api-logging: trueannotation is added). - When
logging.apiLogging.enabledistrue, Dapr runtimes have API logging enabled by default, and it can be disabled by setting--enable-api-logging=falseor with thedapr.io/enable-api-logging: falseannotation.
For example:
logging:
apiLogging:
enabled: true
Obfuscate URLs in HTTP API logging
By default, logs for API calls in the HTTP endpoints include the full URL being invoked (for example, POST /v1.0/invoke/directory/method/user-123), which could contain Personal Identifiable Information (PII).
To reduce the risk of PII being accidentally included in API logs (when enabled), Dapr can instead log the abstract route being invoked (for example, POST /v1.0/invoke/{id}/method/{method:*}). This can help ensuring compliance with privacy regulations such as GDPR.
To enable obfuscation of URLs in Dapr’s HTTP API logs, set logging.apiLogging.obfuscateURLs to true. For example:
logging:
apiLogging:
obfuscateURLs: true
Logs emitted by the Dapr gRPC APIs are not impacted by this configuration option, as they only include the name of the method invoked and no arguments.
Omit health checks from API logging
When API logging is enabled, all calls to the Dapr API server are logged, including those to health check endpoints (e.g. /v1.0/healthz). Depending on your environment, this may generate multiple log lines per minute and could create unwanted noise.
You can configure Dapr to not log calls to health check endpoints when API logging is enabled using the Dapr Configuration spec, by setting logging.apiLogging.omitHealthChecks: true. The default value is false, which means that health checks calls are logged in the API logs.
For example:
logging:
apiLogging:
omitHealthChecks: true
9.4 - Profiling & Debugging
In any real world scenario, an app might start exhibiting undesirable behavior in terms of resource spikes. CPU/Memory spikes are not uncommon in most cases.
Dapr allows users to start an on-demand profiling session using pprof through its profiling server endpoint and start an instrumentation session to discover problems and issues such as concurrency, performance, cpu and memory usage.
Enable profiling
Dapr allows you to enable profiling in both Kubernetes and stand-alone modes.
Stand-alone
To enable profiling in Standalone mode, pass the --enable-profiling and the --profile-port flags to the Dapr CLI:
Note that profile-port is not required, and if not provided Dapr will pick an available port.
dapr run --enable-profiling --profile-port 7777 python myapp.py
Kubernetes
To enable profiling in Kubernetes, simply add the dapr.io/enable-profiling annotation to your Dapr annotated pod:
annotations:
dapr.io/enabled: "true"
dapr.io/app-id: "rust-app"
dapr.io/enable-profiling: "true"
Debug a profiling session
After profiling is enabled, we can start a profiling session to investigate what’s going on with the Dapr runtime.
Stand-alone
For Standalone mode, locate the Dapr instance that you want to profile:
dapr list
APP ID DAPR PORT APP PORT COMMAND AGE CREATED PID
node-subscriber 3500 3000 node app.js 12s 2019-09-09 15:11.24 896
Grab the DAPR PORT, and if profiling has been enabled as described above, you can now start using pprof to profile Dapr.
Look at the Kubernetes examples above for some useful commands to profile Dapr.
More info on pprof can be found here.
Kubernetes
First, find the pod containing the Dapr runtime. If you don’t already know the the pod name, type kubectl get pods:
NAME READY STATUS RESTARTS AGE
divideapp-6dddf7dc74-6sq4l 2/2 Running 0 2d23h
If profiling has been enabled successfully, the runtime logs should show the following:
time="2019-09-09T20:56:21Z" level=info msg="starting profiling server on port 7777"
In this case, we want to start a session with the Dapr runtime inside of pod divideapp-6dddf7dc74-6sq4l.
We can do so by connecting to the pod via port forwarding:
kubectl port-forward divideapp-6dddf7dc74-6sq4 7777:7777
Forwarding from 127.0.0.1:7777 -> 7777
Forwarding from [::1]:7777 -> 7777
Handling connection for 7777
Now that the connection has been established, we can use pprof to profile the Dapr runtime.
The following example will create a cpu.pprof file containing samples from a profile session that lasts 120 seconds:
curl "http://localhost:7777/debug/pprof/profile?seconds=120" > cpu.pprof
Analyze the file with pprof:
pprof cpu.pprof
You can also save the results in a visualized way inside a PDF:
go tool pprof --pdf your-binary-file http://localhost:7777/debug/pprof/profile?seconds=120 > profile.pdf
For memory related issues, you can profile the heap:
go tool pprof --pdf your-binary-file http://localhost:7777/debug/pprof/heap > heap.pdf
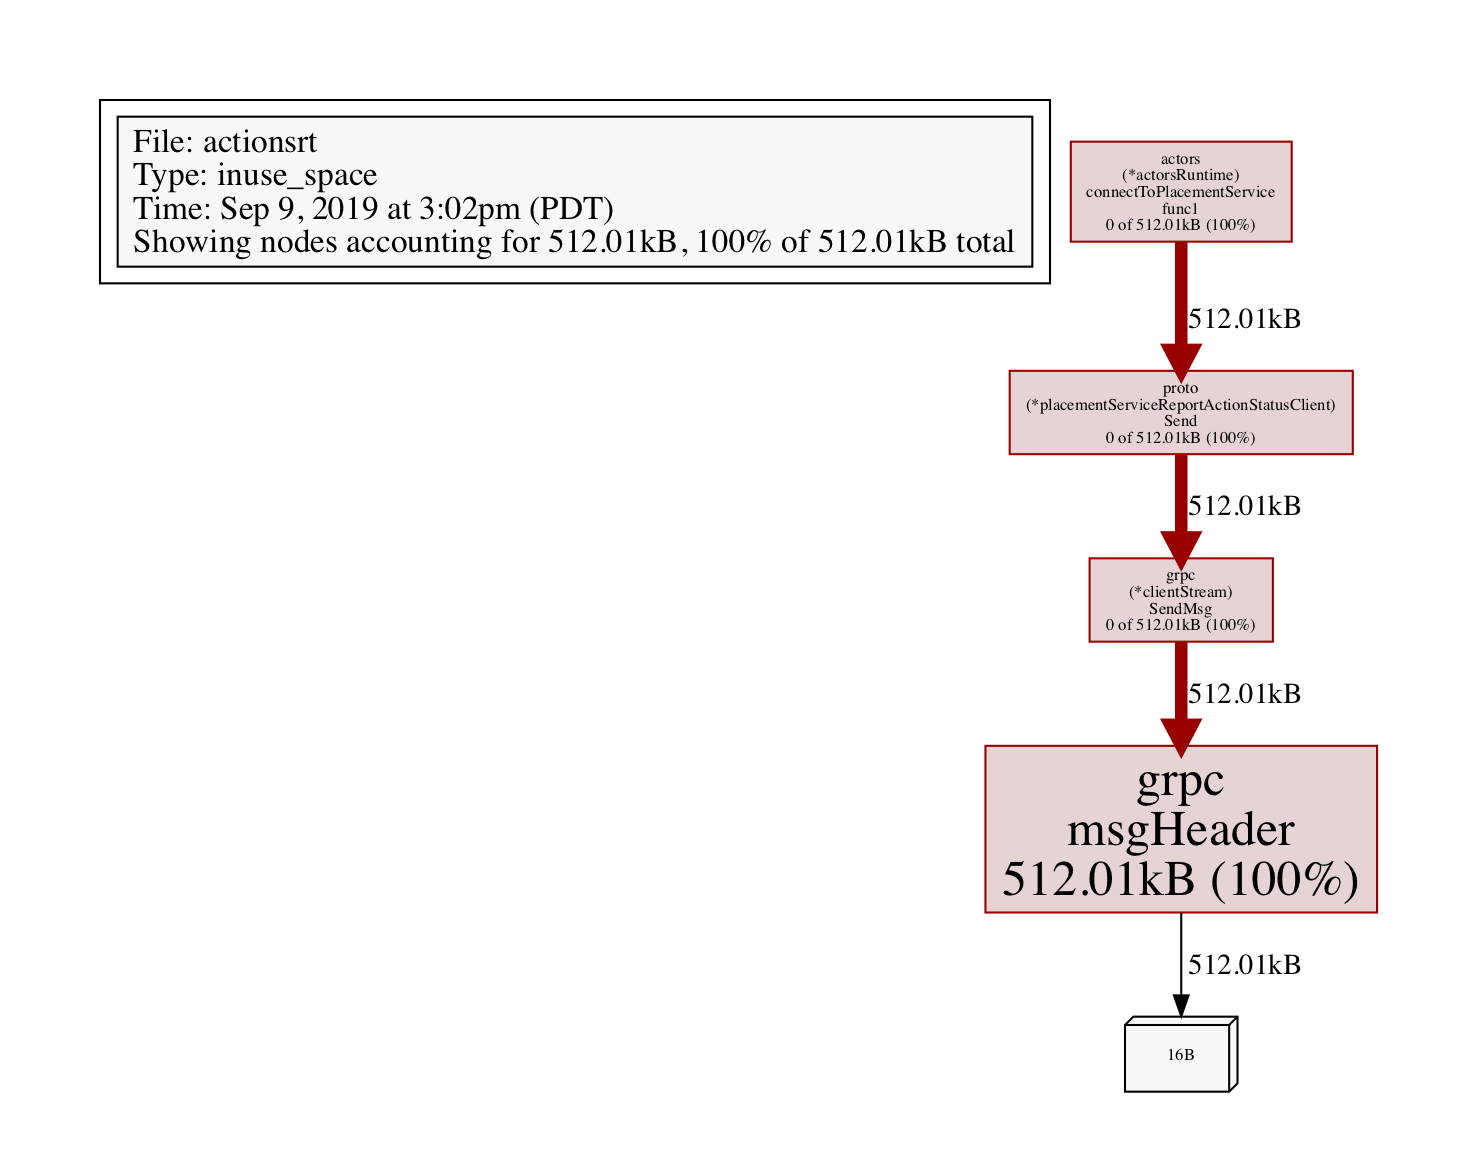
Profiling allocated objects:
go tool pprof http://localhost:7777/debug/pprof/heap
> exit
Saved profile in /Users/myusername/pprof/pprof.daprd.alloc_objects.alloc_space.inuse_objects.inuse_space.003.pb.gz
To analyze, grab the file path above (its a dynamic file path, so pay attention to note paste this one), and execute:
go tool pprof -alloc_objects --pdf /Users/myusername/pprof/pprof.daprd.alloc_objects.alloc_space.inuse_objects.inuse_space.003.pb.gz > alloc-objects.pdf