This is the multi-page printable view of this section. Click here to print.
IDE support
1 - Visual Studio Code integration with Dapr
1.1 - Dapr Visual Studio Code extension overview
Dapr offers a preview Dapr Visual Studio Code extension for local development which enables users a variety of features related to better managing their Dapr applications and debugging of your Dapr applications for all supported Dapr languages which are .NET, Go, PHP, Python and Java.
Features
Scaffold Dapr debugging tasks
The Dapr extension helps you debug your applications with Dapr using Visual Studio Code’s built-in debugging capability.
Using the Dapr: Scaffold Dapr Tasks Command Palette operation, you can update your existing task.json and launch.json files to launch and configure the Dapr sidecar when you begin debugging.
- Make sure you have a launch configuration set for your app. (Learn more)
- Open the Command Palette with
Ctrl+Shift+P - Select
Dapr: Scaffold Dapr Tasks - Run your app and the Dapr sidecar with
F5or via the Run view.
Scaffold Dapr components
When adding Dapr to your application, you may want to have a dedicated components directory, separate from the default components initialized as part of dapr init.
To create a dedicated components folder with the default statestore, pubsub, and zipkin components, use the Dapr: Scaffold Dapr Components Command Palette operation.
- Open your application directory in Visual Studio Code
- Open the Command Palette with
Ctrl+Shift+P - Select
Dapr: Scaffold Dapr Components - Run your application with
dapr run --resources-path ./components -- ...
View running Dapr applications
The Applications view shows Dapr applications running locally on your machine.
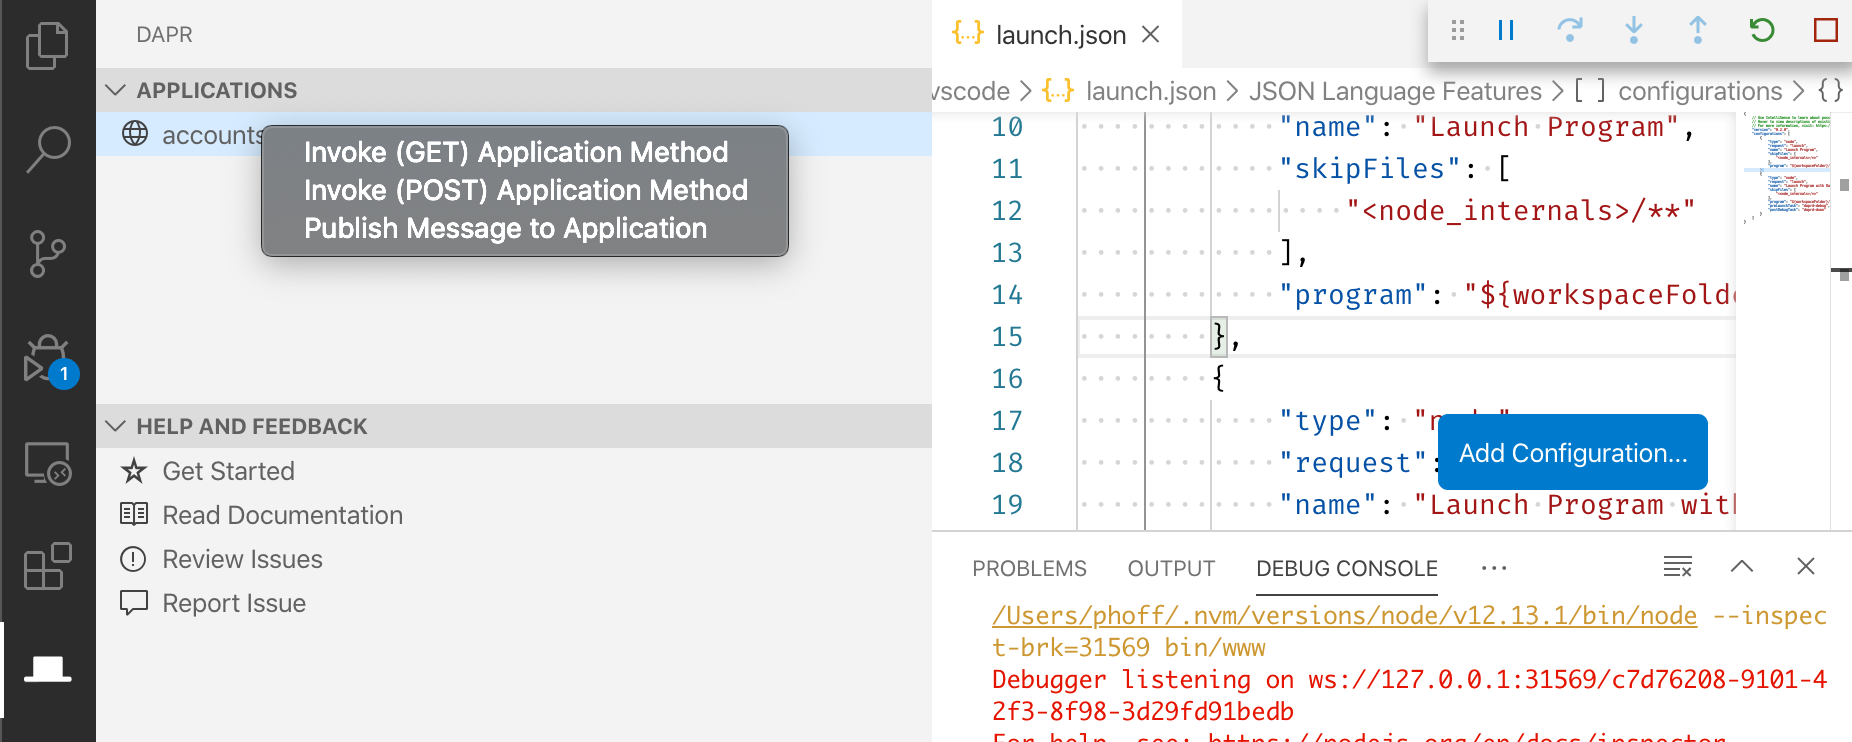
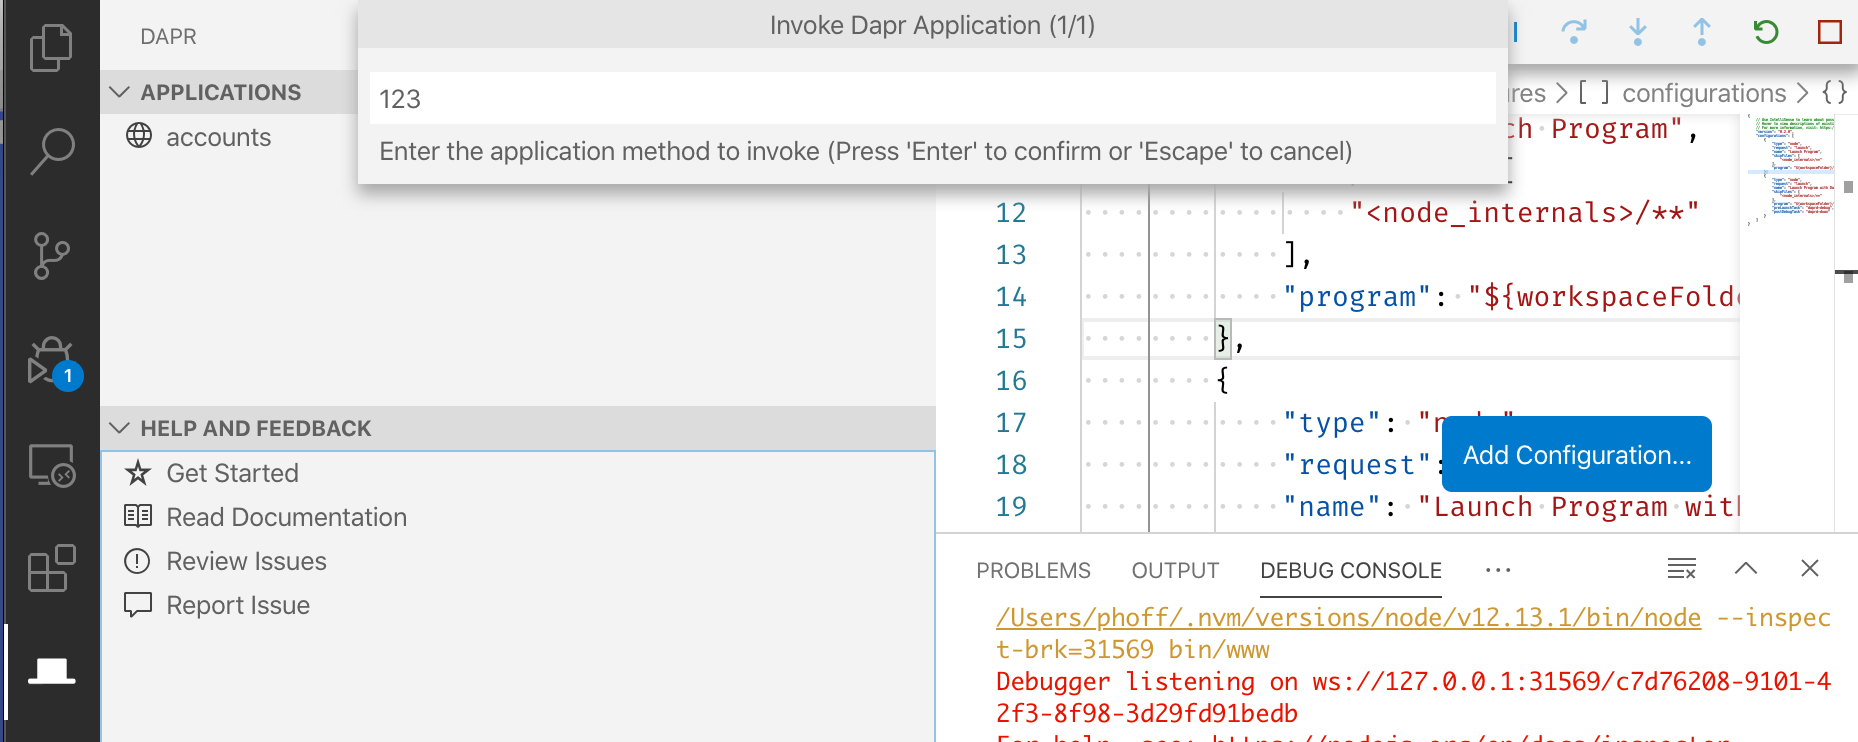
Invoke Dapr applications
Within the Applications view, users can right-click and invoke Dapr apps via GET or POST methods, optionally specifying a payload.
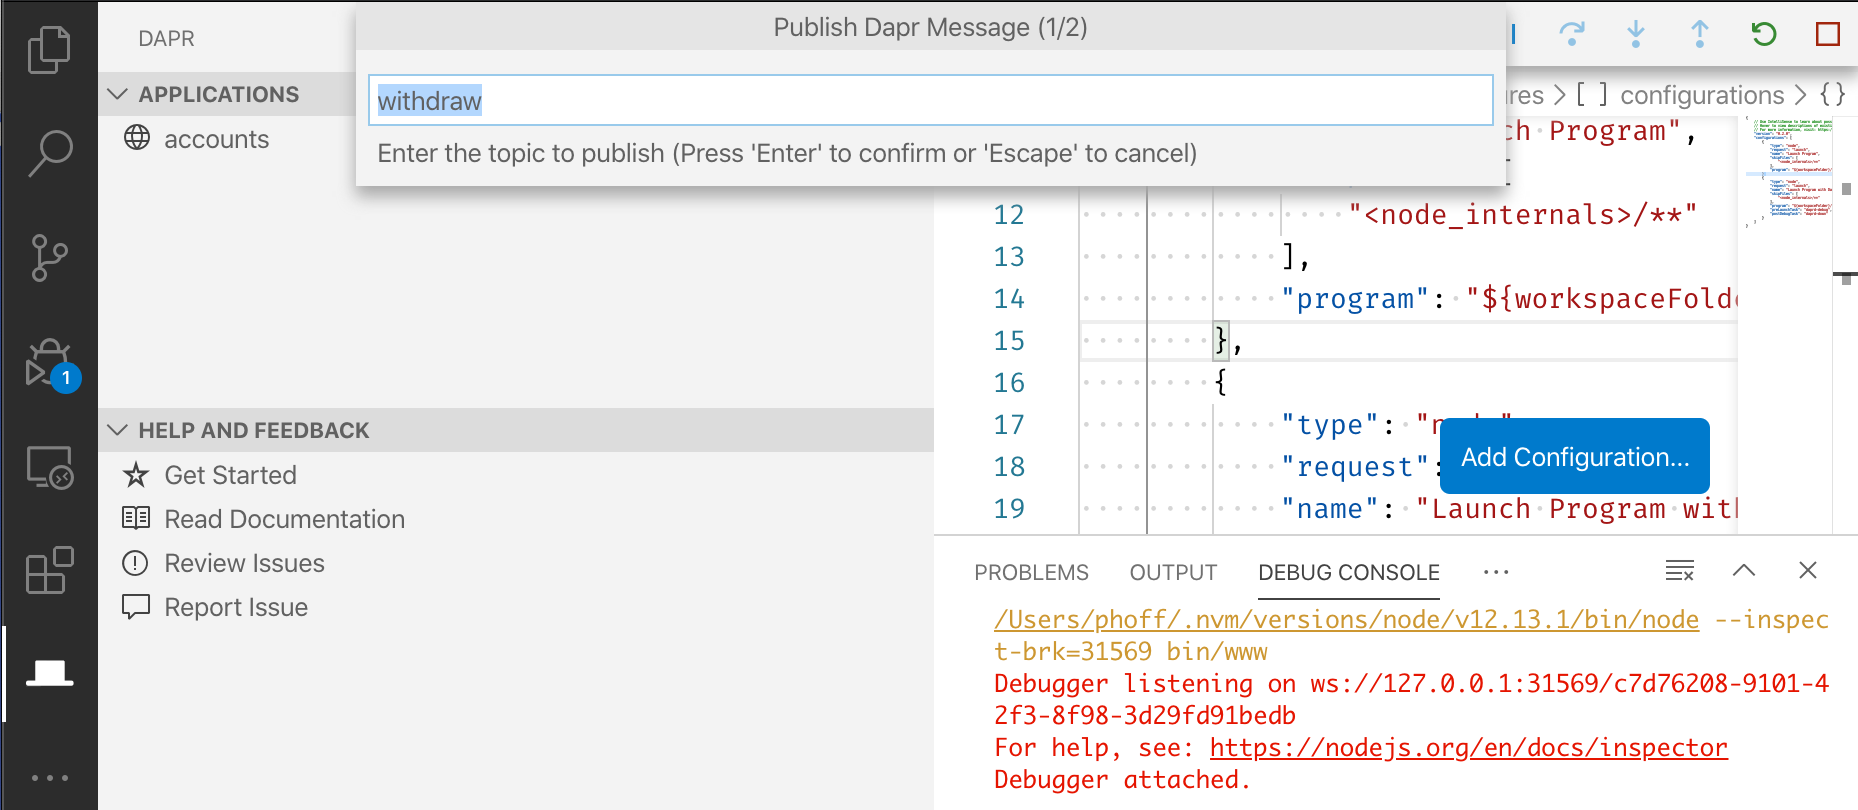
Publish events to Dapr applications
Within the Applications view, users can right-click and publish messages to a running Dapr application, specifying the topic and payload.
Users can also publish messages to all running applications.
Additional resources
Debugging multiple Dapr applications at the same time
Using the VS Code extension, you can debug multiple Dapr applications at the same time with Multi-target debugging.
Community call demo
Watch this video on how to use the Dapr VS Code extension:
1.2 - How-To: Debug Dapr applications with Visual Studio Code
Manual debugging
When developing Dapr applications, you typically use the Dapr CLI to start your daprized service similar to this:
dapr run --app-id nodeapp --app-port 3000 --dapr-http-port 3500 app.js
One approach to attaching the debugger to your service is to first run daprd with the correct arguments from the command line and then launch your code and attach the debugger. While this is a perfectly acceptable solution, it does require a few extra steps and some instruction to developers who might want to clone your repo and hit the “play” button to begin debugging.
If your application is a collection of microservices, each with a Dapr sidecar, it will be useful to debug them together in Visual Studio Code. This page will use the hello world quickstart to showcase how to configure VSCode to debug multiple Dapr application using VSCode debugging.
Prerequisites
- Install the Dapr extension. You will be using the tasks it offers later on.
- Optionally clone the hello world quickstart
Step 1: Configure launch.json
The file .vscode/launch.json contains launch configurations for a VS Code debug run. This file defines what will launch and how it is configured when the user begins debugging. Configurations are available for each programming language in the Visual Studio Code marketplace.
Scaffold debugging configuration
The Dapr VSCode extension offers built-in scaffolding to generate launch.json and tasks.json for you.
In the case of the hello world quickstart, two applications are launched, each with its own Dapr sidecar. One is written in Node.JS, and the other in Python. You’ll notice each configuration contains a daprd run preLaunchTask and a daprd stop postDebugTask.
{
    "version": "0.2.0",
    "configurations": [
       {
         "type": "pwa-node",
         "request": "launch",
         "name": "Nodeapp with Dapr",
         "skipFiles": [
             "<node_internals>/**"
         ],
         "program": "${workspaceFolder}/node/app.js",
         "preLaunchTask": "daprd-debug-node",
         "postDebugTask": "daprd-down-node"
       },
       {
         "type": "python",
         "request": "launch",
         "name": "Pythonapp with Dapr",
         "program": "${workspaceFolder}/python/app.py",
         "console": "integratedTerminal",
         "preLaunchTask": "daprd-debug-python",
         "postDebugTask": "daprd-down-python"
       }
    ]
}
If you’re using ports other than the default ports baked into the code, set the DAPR_HTTP_PORT and DAPR_GRPC_PORT environment variables in the launch.json debug configuration. Match with the httpPort and grpcPort in the daprd tasks.json. For example, launch.json:
{
  // Set the non-default HTTP and gRPC ports
  "env": {
      "DAPR_HTTP_PORT": "3502",
      "DAPR_GRPC_PORT": "50002"
  },
}
tasks.json:
{
  // Match with ports set in launch.json
  "httpPort": 3502,
  "grpcPort": 50002
}
Each configuration requires a request, type and name. These parameters help VSCode identify the task configurations in the .vscode/tasks.json files.
typedefines the language used. Depending on the language, it might require an extension found in the marketplace, such as the Python Extension.nameis a unique name for the configuration. This is used for compound configurations when calling multiple configurations in your project.${workspaceFolder}is a VS Code variable reference. This is the path to the workspace opened in VS Code.- The
preLaunchTaskandpostDebugTaskparameters refer to the program configurations run before and after launching the application. See step 2 on how to configure these.
For more information on VSCode debugging parameters see VS Code launch attributes.
Step 2: Configure tasks.json
For each task defined in .vscode/launch.json , a corresponding task definition must exist in .vscode/tasks.json.
For the quickstart, each service needs a task to launch a Dapr sidecar with the daprd type, and a task to stop the sidecar with daprd-down. The parameters appId, httpPort, metricsPort, label and type are required. Additional optional parameters are available, see the reference table here.
{
    "version": "2.0.0",
    "tasks": [
        {
            "label": "daprd-debug-node",
            "type": "daprd",
            "appId": "nodeapp",
            "appPort": 3000,
            "httpPort": 3500,
            "metricsPort": 9090
        },
        {
            "label": "daprd-down-node",
            "type": "daprd-down",
            "appId": "nodeapp"
        },
        {
            "label": "daprd-debug-python",
            "type": "daprd",
            "appId": "pythonapp",
            "httpPort": 53109,
            "grpcPort": 53317,
            "metricsPort": 9091
        },
        {
            "label": "daprd-down-python",
            "type": "daprd-down",
            "appId": "pythonapp"
        }
   ]
}
Step 3: Configure a compound launch in launch.json
A compound launch configuration can defined in .vscode/launch.json and is a set of two or more launch configurations that are launched in parallel. Optionally, a preLaunchTask can be specified and run before the individual debug sessions are started.
For this example the compound configuration is:
{
   "version": "2.0.0",
   "configurations": [...],
   "compounds": [
      {
        "name": "Node/Python Dapr",
        "configurations": ["Nodeapp with Dapr","Pythonapp with Dapr"]
      }
    ]
}
Step 4: Launch your debugging session
You can now run the applications in debug mode by finding the compound command name you have defined in the previous step in the VS Code debugger:
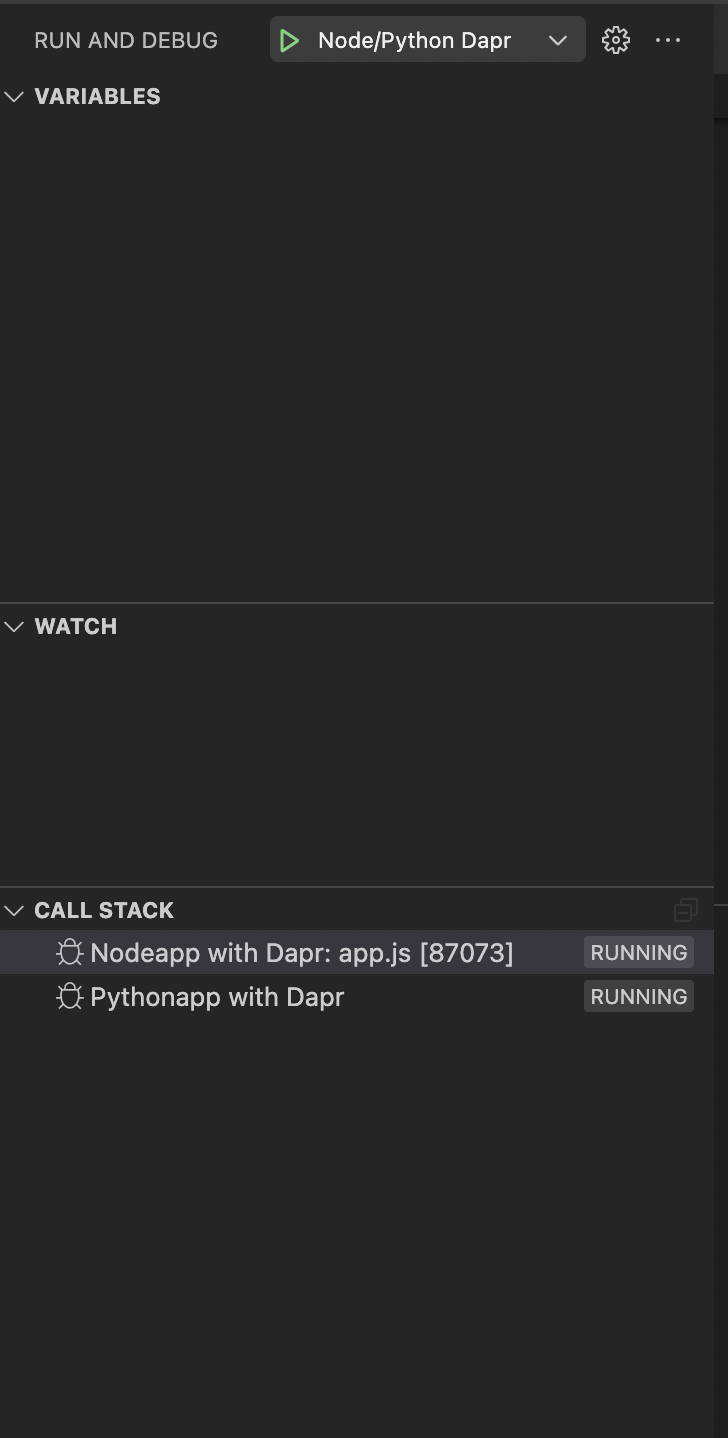
You are now debugging multiple applications with Dapr!
Daprd parameter table
Below are the supported parameters for VS Code tasks. These parameters are equivalent to daprd arguments as detailed in this reference:
| Parameter | Description | Required | Example |
|---|---|---|---|
allowedOrigins | Allowed HTTP origins (default “*”) | No | "allowedOrigins": "*" |
appId | The unique ID of the application. Used for service discovery, state encapsulation and the pub/sub consumer ID | Yes | "appId": "divideapp" |
appMaxConcurrency | Limit the concurrency of your application. A valid value is any number larger than 0 | No | "appMaxConcurrency": -1 |
appPort | This parameter tells Dapr which port your application is listening on | Yes | "appPort": 4000 |
appProtocol | Tells Dapr which protocol your application is using. Valid options are http, grpc, https, grpcs, h2c. Default is http. | No | "appProtocol": "http" |
args | Sets a list of arguments to pass on to the Dapr app | No | “args”: [] |
componentsPath | Path for components directory. If empty, components will not be loaded. | No | "componentsPath": "./components" |
config | Tells Dapr which Configuration resource to use | No | "config": "./config" |
controlPlaneAddress | Address for a Dapr control plane | No | "controlPlaneAddress": "http://localhost:1366/" |
enableProfiling | Enable profiling | No | "enableProfiling": false |
enableMtls | Enables automatic mTLS for daprd to daprd communication channels | No | "enableMtls": false |
grpcPort | gRPC port for the Dapr API to listen on (default “50001”) | Yes, if multiple apps | "grpcPort": 50004 |
httpPort | The HTTP port for the Dapr API | Yes | "httpPort": 3502 |
internalGrpcPort | gRPC port for the Dapr Internal API to listen on | No | "internalGrpcPort": 50001 |
logAsJson | Setting this parameter to true outputs logs in JSON format. Default is false | No | "logAsJson": false |
logLevel | Sets the log level for the Dapr sidecar. Allowed values are debug, info, warn, error. Default is info | No | "logLevel": "debug" |
metricsPort | Sets the port for the sidecar metrics server. Default is 9090 | Yes, if multiple apps | "metricsPort": 9093 |
mode | Runtime mode for Dapr (default “standalone”) | No | "mode": "standalone" |
placementHostAddress | Addresses for Dapr Actor Placement servers | No | "placementHostAddress": "http://localhost:1313/" |
profilePort | The port for the profile server (default “7777”) | No | "profilePort": 7777 |
sentryAddress | Address for the Sentry CA service | No | "sentryAddress": "http://localhost:1345/" |
type | Tells VS Code it will be a daprd task type | Yes | "type": "daprd" |
Related Links
1.3 - Developing Dapr applications with Dev Containers
The Visual Studio Code Dev Containers extension lets you use a self-contained Docker container as a complete development environment, without installing any additional packages, libraries, or utilities in your local filesystem.
Dapr has pre-built Dev Containers for C# and JavaScript/TypeScript; you can pick the one of your choice for a ready made environment. Note these pre-built containers automatically update to the latest Dapr release.
We also publish a Dev Container feature that installs the Dapr CLI inside any Dev Container.
Setup the development environment
Prerequisites
Add the Dapr CLI using a Dev Container feature
You can install the Dapr CLI inside any Dev Container using Dev Container features.
To do that, edit your devcontainer.json and add two objects in the "features" section:
"features": {
    // Install the Dapr CLI
    "ghcr.io/dapr/cli/dapr-cli:0": {},
    // Enable Docker (via Docker-in-Docker)
    "ghcr.io/devcontainers/features/docker-in-docker:2": {},
    // Alternatively, use Docker-outside-of-Docker (uses Docker in the host)
    //"ghcr.io/devcontainers/features/docker-outside-of-docker:1": {},
}
After saving the JSON file and (re-)building the container that hosts your development environment, you will have the Dapr CLI (and Docker) available, and can install Dapr by running this command in the container:
dapr init
Example: create a Java Dev Container for Dapr
This is an example of creating a Dev Container for creating Java apps that use Dapr, based on the official Java 17 Dev Container image.
Place this in a file called .devcontainer/devcontainer.json in your project:
// For format details, see https://aka.ms/devcontainer.json. For config options, see the
// README at: https://github.com/devcontainers/templates/tree/main/src/java
{
	"name": "Java",
	// Or use a Dockerfile or Docker Compose file. More info: https://containers.dev/guide/dockerfile
	"image": "mcr.microsoft.com/devcontainers/java:0-17",

	"features": {
		"ghcr.io/devcontainers/features/java:1": {
			"version": "none",
			"installMaven": "false",
			"installGradle": "false"
		},
        // Install the Dapr CLI
        "ghcr.io/dapr/cli/dapr-cli:0": {},
        // Enable Docker (via Docker-in-Docker)
        "ghcr.io/devcontainers/features/docker-in-docker:2": {},
        // Alternatively, use Docker-outside-of-Docker (uses Docker in the host)
        //"ghcr.io/devcontainers/features/docker-outside-of-docker:1": {},
	}

	// Use 'forwardPorts' to make a list of ports inside the container available locally.
	// "forwardPorts": [],

	// Use 'postCreateCommand' to run commands after the container is created.
	// "postCreateCommand": "java -version",

	// Configure tool-specific properties.
	// "customizations": {},

	// Uncomment to connect as root instead. More info: https://aka.ms/dev-containers-non-root.
	// "remoteUser": "root"
}
Then, using the VS Code command palette (CTRL + SHIFT + P or CMD + SHIFT + P on Mac), select Dev Containers: Rebuild and Reopen in Container.
Use a pre-built Dev Container (C# and JavaScript/TypeScript)
- Open your application workspace in VS Code
- In the command command palette (
CTRL + SHIFT + PorCMD + SHIFT + Pon Mac) type and selectDev Containers: Add Development Container Configuration Files...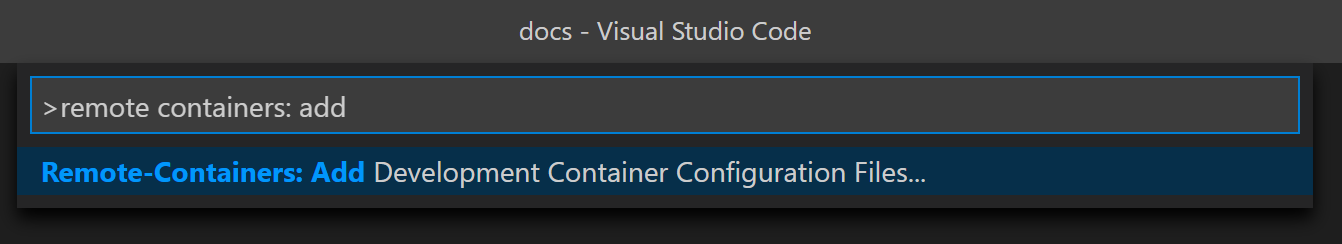
- Type
daprto filter the list to available Dapr remote containers and choose the language container that matches your application. Note you may need to selectShow All Definitions...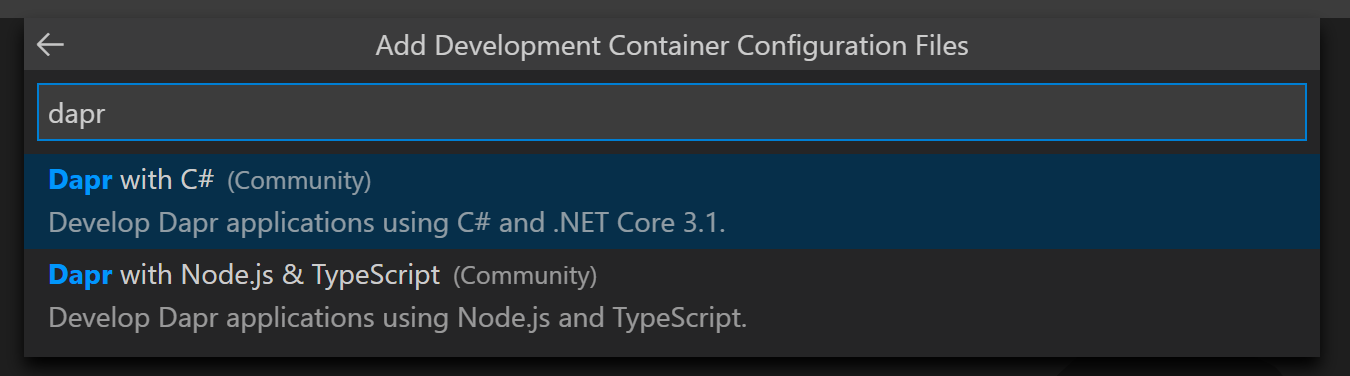
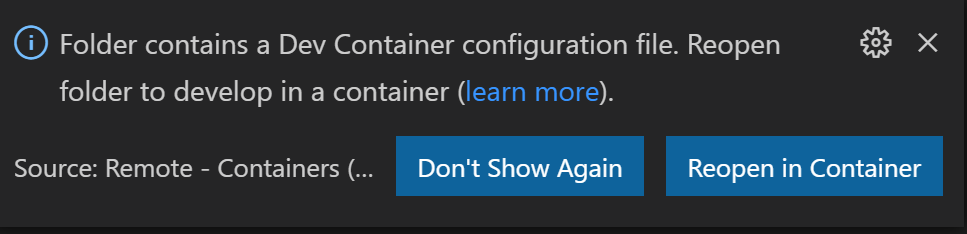
- Follow the prompts to reopen your workspace in the container.
Example
Watch this video on how to use the Dapr Dev Containers with your application.
2 - IntelliJ
When developing Dapr applications, you typically use the Dapr CLI to start your ‘Daprized’ service similar to this:
dapr run --app-id nodeapp --app-port 3000 --dapr-http-port 3500 app.js
This uses the default components yaml files (created on dapr init) so that your service can interact with the local Redis container. This is great when you are just getting started but what if you want to attach a debugger to your service and step through the code? This is where you can use the dapr cli without invoking an app.
One approach to attaching the debugger to your service is to first run dapr run -- from the command line and then launch your code and attach the debugger. While this is a perfectly acceptable solution, it does require a few extra steps (like switching between terminal and IDE) and some instruction to developers who might want to clone your repo and hit the “play” button to begin debugging.
This document explains how to use dapr directly from IntelliJ. As a pre-requisite, make sure you have initialized the Dapr’s dev environment via dapr init.
Let’s get started!
Add Dapr as an ‘External Tool’
First, quit IntelliJ before modifying the configurations file directly.
IntelliJ configuration file location
For versions 2020.1 and above the configuration files for tools should be located in:
%USERPROFILE%\AppData\Roaming\JetBrains\IntelliJIdea2020.1\tools\
$HOME/.config/JetBrains/IntelliJIdea2020.1/tools/
~/Library/Application\ Support/JetBrains/IntelliJIdea2020.1/tools/
The configuration file location is different for version 2019.3 or prior. See here for more details.
Change the version of IntelliJ in the path if needed.
Create or edit the file in <CONFIG PATH>/tools/External\ Tools.xml (change IntelliJ version in path if needed). The <CONFIG PATH> is OS dependent as seen above.
Add a new <tool></tool> entry:
<toolSet name="External Tools">
  ...
  <!-- 1. Each tool has its own app-id, so create one per application to be debugged -->
  <tool name="dapr for DemoService in examples" description="Dapr sidecar" showInMainMenu="false" showInEditor="false" showInProject="false" showInSearchPopup="false" disabled="false" useConsole="true" showConsoleOnStdOut="true" showConsoleOnStdErr="true" synchronizeAfterRun="true">
    <exec>
      <!-- 2. For Linux or MacOS use: /usr/local/bin/dapr -->
      <option name="COMMAND" value="C:\dapr\dapr.exe" />
      <!-- 3. Choose app, http and grpc ports that do not conflict with other daprd command entries (placement address should not change). -->
      <option name="PARAMETERS" value="run -app-id demoservice -app-port 3000 -dapr-http-port 3005 -dapr-grpc-port 52000" />
      <!-- 4. Use the folder where the `components` folder is located -->
      <option name="WORKING_DIRECTORY" value="C:/Code/dapr/java-sdk/examples" />
    </exec>
  </tool>
  ...
</toolSet>
Optionally, you may also create a new entry for a sidecar tool that can be reused across many projects:
<toolSet name="External Tools">
  ...
  <!-- 1. Reusable entry for apps with app port. -->
  <tool name="dapr with app-port" description="Dapr sidecar" showInMainMenu="false" showInEditor="false" showInProject="false" showInSearchPopup="false" disabled="false" useConsole="true" showConsoleOnStdOut="true" showConsoleOnStdErr="true" synchronizeAfterRun="true">
    <exec>
      <!-- 2. For Linux or MacOS use: /usr/local/bin/dapr -->
      <option name="COMMAND" value="c:\dapr\dapr.exe" />
      <!-- 3. Prompts user 4 times (in order): app id, app port, Dapr's http port, Dapr's grpc port. -->
      <option name="PARAMETERS" value="run --app-id $Prompt$ --app-port $Prompt$ --dapr-http-port $Prompt$ --dapr-grpc-port $Prompt$" />
      <!-- 4. Use the folder where the `components` folder is located -->
      <option name="WORKING_DIRECTORY" value="$ProjectFileDir$" />
    </exec>
  </tool>
  <!-- 1. Reusable entry for apps without app port. -->
  <tool name="dapr without app-port" description="Dapr sidecar" showInMainMenu="false" showInEditor="false" showInProject="false" showInSearchPopup="false" disabled="false" useConsole="true" showConsoleOnStdOut="true" showConsoleOnStdErr="true" synchronizeAfterRun="true">
    <exec>
      <!-- 2. For Linux or MacOS use: /usr/local/bin/dapr -->
      <option name="COMMAND" value="c:\dapr\dapr.exe" />
      <!-- 3. Prompts user 3 times (in order): app id, Dapr's http port, Dapr's grpc port. -->
      <option name="PARAMETERS" value="run --app-id $Prompt$ --dapr-http-port $Prompt$ --dapr-grpc-port $Prompt$" />
      <!-- 4. Use the folder where the `components` folder is located -->
      <option name="WORKING_DIRECTORY" value="$ProjectFileDir$" />
    </exec>
  </tool>
  ...
</toolSet>
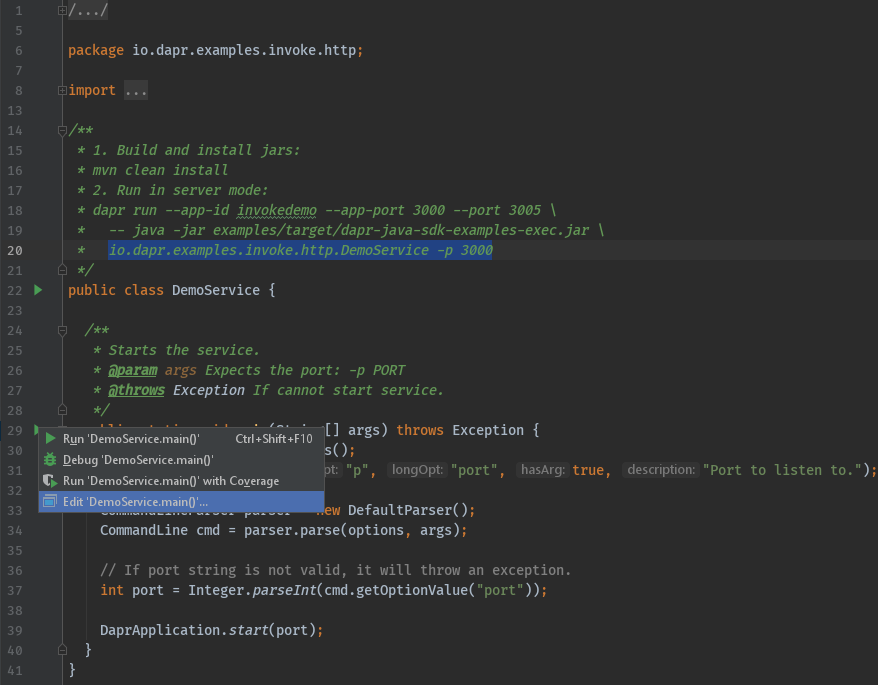
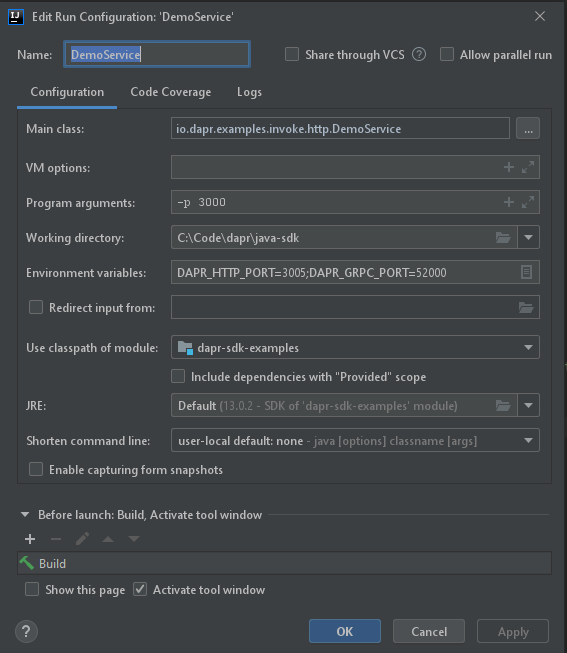
Create or edit run configuration
Now, create or edit the run configuration for the application to be debugged. It can be found in the menu next to the main() function.
Now, add the program arguments and environment variables. These need to match the ports defined in the entry in ‘External Tool’ above.
- Command line arguments for this example:
-p 3000 - Environment variables for this example:
DAPR_HTTP_PORT=3005;DAPR_GRPC_PORT=52000
Start debugging
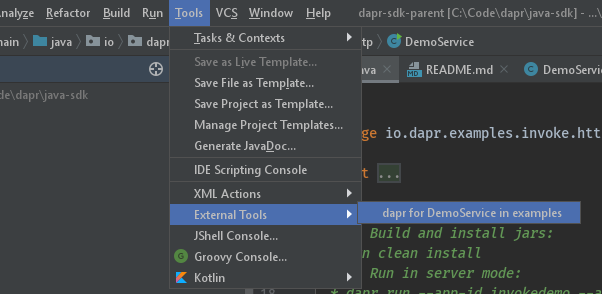
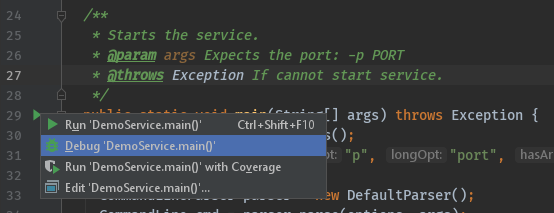
Once the one-time config above is done, there are two steps required to debug a Java application with Dapr in IntelliJ:
- Start
daprviaTools->External Toolin IntelliJ.
- Start your application in debug mode.
Wrapping up
After debugging, make sure you stop both dapr and your app in IntelliJ.
Note: Since you launched the service(s) using the dapr run CLI command, the dapr list command will show runs from IntelliJ in the list of apps that are currently running with Dapr.
Happy debugging!
Related links
- Change in IntelliJ configuration directory location